TradeCityPro | XLM : Tracking Corrections and Key Levels👋 Welcome to TradeCity Pro!
In this analysis, I’ll review the XLM coin. The Stellar project is one of the oldest crypto projects and operates one of the earliest decentralized exchanges (DEXs).
📅 Daily Timeframe: Correction After a 500% Rally
In the daily timeframe, we observe a powerful upward trend. After bottoming out at $0.0884, bullish momentum entered the market. Once $0.1101 was broken, this momentum increased further. With higher buying volume and RSI entering the Overbought zone, the resistance at $0.1566 was also broken, and the price is now near its ATH.
🔍 After reaching the $0.5653 resistance, buying volume and bullish momentum slowed, and the market has entered a more stable corrective phase. So far, the price has corrected to $0.3308, which isn’t even the 0.382 Fibonacci level and indicates the correction hasn’t fully reflected the sharp price increase.
📈 The price might resume its upward movement with strong momentum even with this shallow correction. If the $0.5653 ceiling is broken, the price could move to the $0.7247 ATH resistance and potentially form new all-time highs if this resistance is surpassed.
🔽 However, the price is currently forming lower highs, which increases the likelihood of further correction due to insufficient correction thus far. If the market leans towards correction, the price might retest the $0.3308 support and, if broken, could reach supports like the SMA99 and the 0.382 Fibonacci level. Further corrections could lead the price to 0.5 and 0.618 Fibonacci levels. A break below 50 on RSI would strengthen the corrective scenario.
✨ If you’ve previously bought this coin at lower prices and are looking for an exit point, I recommend exiting if the price stabilizes below $0.3308. However, if you wish to maintain your profits and re-enter, you can consider buying again if the price recovers above this level.
⏳ 4-Hour Timeframe: Futures Triggers
In the 4-hour timeframe, we can observe the price movement during the correction phase in greater detail. As you can see, the price has a critical resistance at $0.4651, which it has tested multiple times.
📊 The best long trigger currently is breaking the $0.4651 resistance, with the first target being $0.5781. Breaking this $0.5781 level would provide a second long trigger.
🔽 For short positions, the first trigger, which is quite risky, is breaking $0.3907, while the main trigger is $0.3240. The targets for these positions have been identified using Fibonacci levels in the daily timeframe. However, since the main trend remains bullish, all short positions carry significant risk.
📝 Final Thoughts
This analysis reflects our opinions and is not financial advice.
Share your thoughts in the comments, and don’t forget to share this analysis with your friends! ❤️
XLM

#XLM/USDT Ready to go higher#XLM
The price is moving in a descending channel on the 1-hour frame and sticking to it well
We have a bounce from the lower limit of the descending channel, this support is at 0.4300
We have a downtrend on the RSI indicator that is about to be broken, which supports the rise
We have a trend to stabilize above the moving average 100
Entry price 0.4434
First target 0.4590
Second target 0.4746
Third target 0.4927

Stellar can give a Stellar Performance?Stellar is ideally going to the buys on the point of attraction where green line is shown, unless small ups, its better to big long to the position marked or short when comes to yellow box, breaks above the red line of the yellow box will defy whats made.

XLM - 1hr Chart TA by GrokAI
Given the 1-hour chart of XLM/USD, here's an in-depth technical analysis:
Price Action & Trend Analysis:
Current Price: $0.449910 USD, showing a recent test of lower levels after a peak near $0.49.
Trend: The price has been in a downward trend but seems to be finding support around the $0.45 level. This could be a pivot point for either a bounce back or a breakdown.
Moving Averages:
200-period SMA (Simple Moving Average): The price is trading below this long-term average, indicating a bearish sentiment over a longer time frame.
50-period SMA: The price has also dipped below this shorter-term average, reinforcing the bearish outlook in the short term.
Volume:
The volume appears subdued, suggesting a lack of strong buying or selling pressure. This might indicate consolidation or a wait for a market catalyst.
Fibonacci Retracement:
The chart shows Fibonacci retracement levels from a recent swing low to high. Key levels to watch:
0.382 at $0.41841100: This could be a strong support level if the price continues to decline.
0.5 at $0.43855500: A test of this level could indicate further resistance or support, depending on price action.
Indicators:
Stochastic RSI: Positioned below 50, indicating a potential bearish phase or preparation for a bounce if it turns upwards.
MACD: While not visible in the provided image, typically, if the MACD line were below the signal line, it would suggest bearish momentum. Conversely, a crossover above the signal line would be bullish.
RSI (Relative Strength Index): At 45.57, it's neutral but shows a bearish divergence (price makes higher highs while RSI makes lower highs), which could precede a price drop if support doesn't hold.
Support and Resistance:
Support: Around $0.418 (0.382 Fib level). If broken, the next support could be lower, around previous lows or psychological levels.
Resistance: Near current price levels and above at $0.462 (0.5 Fib level).
Strategy:
For Sellers: Consider entering on a confirmed break below $0.418 with stops just above this level to manage risk.
For Buyers: Look for bullish signals or a clear reversal pattern forming near the $0.418 support, with stops below this level.
Market Sentiment:
Given the bearish signals from moving averages and RSI divergence, the market might be leaning towards further downside unless supported by volume increase or positive news.
Final Thoughts:
Always watch for volume spikes which could confirm the current trend or indicate a reversal.
Keep an eye on global crypto market sentiment, as XLM often correlates with broader market movements.
Use additional tools like trend lines, chart patterns, or other indicators for confirmation before making trading decisions.
This analysis provides a snapshot based on the given chart. Always combine technical analysis with fundamental analysis and risk management for the best trading outcomes.

XLM SHORT Stellar Lumens 5-15min Chart:It appears to me there will be a shorting, so I am looking at a short-term scalp short on XLM 5min chart. Tradingview would not let me publish 5min so I am publishing on a 15min chart.

XLM expected movementBINANCE:XLMUSDT
Stellar was in a falling wedge pattern. now the price has already broken the pattern so all we need to do is sit and wait for it to reach the top of the pattern.
⚠️ Disclaimer:
This is not financial advice. Always manage your risks and trade responsibly.
👉 Follow me for daily updates,
💬 Comment and like to share your thoughts,
📌 And check the link in my bio for even more resources!
Let’s navigate the markets together—join the journey today! 💹✨

Trading opportunity for XLMUSDTBased on technical factors there is a Buy position in :
📊 XLMUSDT
🔵 Buy Now
🪫Stop loss 0.4320
🔋Target 0.4900
📏 R/R 2,8
💸RISK : 1%
We hope it is profitable for you ❤️
Please support our activity with your likes👍 and comments📝

Support zone: 0.4024
Hello, traders.
If you "Follow", you can always get new information quickly.
Please click "Boost" as well.
Have a nice day today.
-------------------------------------
(XLMUSDT 1D chart)
As it rose this time, the candle's body color changed to green (#42bda8, #00332a).
In order to continue the short-term uptrend, the price must be maintained around 0.4024 or higher.
If it fails to do so and falls below 0.3747, it may fall to around 0.3070.
-
Since the high point boundary zone is formed in the 0.4931-0.5362 zone, the point of observation is whether it can break through this zone upward.
Therefore, when the support is confirmed around 0.4024, it is the time to buy.
-
Thank you for reading to the end.
I hope you have a successful trade.
--------------------------------------------------
- Big picture
I used TradingView's INDEX chart to check the entire range of BTC.
(BTCUSD 12M chart)
Looking at the big picture, it seems to have been maintaining an upward trend following a pattern since 2015.
In other words, it is a pattern that maintains a 3-year upward trend and faces a 1-year downward trend.
Accordingly, the upward trend is expected to continue until 2025.
-
(LOG chart)
Looking at the LOG chart, you can see that the upward trend is decreasing.
Accordingly, the 46K-48K range is expected to be a very important support and resistance range from a long-term perspective.
Therefore, it is expected that prices below 44K-48K will not be seen in the future.
-
The Fibonacci ratio on the left is the Fibonacci ratio of the uptrend that started in 2015.
In other words, it is the Fibonacci ratio of the first wave of the uptrend.
The Fibonacci ratio on the right is the Fibonacci ratio of the uptrend that started in 2019.
Therefore, it is expected that this Fibonacci ratio will be used until 2026.
-
No matter what anyone says, the chart has already been created and is already moving.
It is up to you how to view and respond to this.
If the ATH is renewed, there are no support and resistance points, so the Fibonacci ratio can be appropriately utilized.
However, although the Fibonacci ratio is useful for chart analysis, it is ambiguous to use it as support and resistance.
The reason is that the user must directly select the important selection points required to generate Fibonacci.
Therefore, since it is expressed differently depending on how the user specifies the selection points, it can be useful for chart analysis, but it can be seen as ambiguous to use it for trading strategies.
1st: 44234.54
2nd: 61383.23
3rd: 89126.41
101875.70-106275.10 (when overshooting)
4th: 134018.28
151166.97-157451.83 (when overshooting)
5th: 178910.15
-----------------

XLM and XRP 's breakout#xlm #stellar price has just made a breakout of the falling trend and it seems CRYPTOCAP:XLM is heading to a retest. A successful retest will likely ride #xlmusd to the impulsive wave.

xlmI'm hoping this area is green, and if it can't hold, we should come and check further down in the purple lines.

XLM Falling Wedge Could Rise 135% to .95 On Bullish Break!Here I have COINBASE:XLMUSD on the Daily Chart.
Low - .089449
High - .63445
Since the High, Price has been forming a Falling Wedge where we see Price Retraced to the Golden Ratio Zone @ .31339 where it tested the Falling Support then to find more Support at the 50% Fibonacci Level to now be currently Testing the Falling Resistance!
If Price can generate a Bullish Break and continue finding Support, then I believe the prior 608% Price Increase we saw over November, could suggest a Potential 135% Price Increase to the .95 - $1 Area on a Bullish Break!!
Indicators:
-RSI Above 50
-BBTrend Printing Green Bars
-Bullish Volume Building

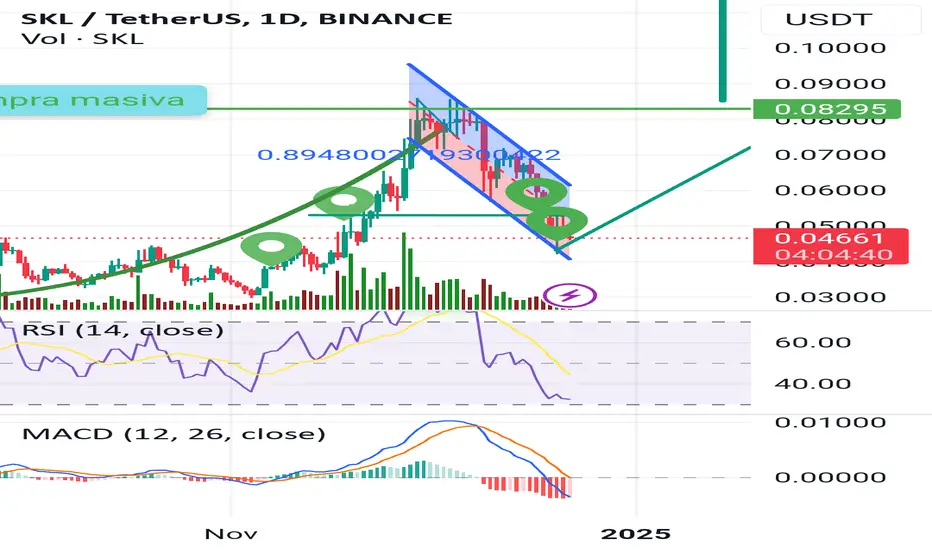
Skl time to flipi been looking for this coin for almost 5 years now, ans i see that a flip is comming.
As you can see, rsi is in over sell position, and MACD is shoeing efforts of a big change.
In the chart there are little green points, those are my Buy positions.
I understand that january and February will be greates than november.
xlmIn the high time frame, it has made a move
If it wants to reverse 50% of the move, it can reach the yellow lines, but on the other hand, there is another channel midline
But in the short term, we have a conflict between the green and red boxes, and a break from either side activates the next areas
It is safer to buy in the blue points

XLMUSDT Short Idea - Struggling to Maintain Bullish MomentumXLMUSDT has had a strong run up to ~$0.63, as have many other alts, but is now struggling to maintain that bullish momentum.
Looking at a fib retracement view of the bullish push, we can see that the price action has been oscillating between the 0.5 and 0.618 fib levels and has once again been rejected off the bottom of the 0.5 level.
This chart shows a lower timeframe snapshot of that price action rejection off the bottom of the 0.5 fib.
From a bearish push fib retracement view, we can see that there is confluence between the 0.5 bullish fib level and the 0.618 bearish fib retracement region. We can see this level holding well and a potential rejection back down towards another bearish move.
The target for this short idea is a combination of the supply order block level sitting around 0.26, and the -0.618 fib extension level of the bearish fib retracement fib. Stop placement is above the order block flip zone indicated by the yellow box. For lower timeframe traders, a tighter stop could be attempted if you watch the price action closely following a breakdown below the last point of support at 0.38.

XLM - BullishXLM is in consolidation with its sideways movement. The sideways movement seems to play within a symmetrical triangle with the ability to continue its upward trend. The 20ma and 200ma are still in play after its golden cross in early November. According to the Relative Strength Index (RSI), XLM is currently in an oversold condition. However, the On Balance Volume (OBV) shows that XLM has increased buy pressure as it's in price discovery. I believe it's finding new lows at a higher value before the break to new resistance levels. There are many bull signals, which makes me bullish on XLM.
Support - $0.43
Resistance - $0.56
Fear and Greed Index - 79 (80 = Extreme Greed; if the market hits extreme greed, be prepared to watch things moon.)

$XLM retreace to ALL TIME HIGHon CRYPTOCAP:XLM the full fibonacci retrace from the xlm high on december 1st 2024 to the low only a day later on december 2nd 2024
is exactly the ALL TIME HIGH for STELLAR

XLM Ready for Lift-Off? Wait for Breakout of $0.458!Stellar XLM is still trading in the range zone between $0.40 and $0.46 with the sideways price action.
1. If XLM can break through $0.458 with confidence, bulls might take over and aim for the next resistance at $0.525 and, possibly, higher. That’s where momentum could build up nicely, potentially giving traders something to cheer about (Solid Green Projection).
2. The price is pushing higher. However, if the price stumbles here, we’ll need to watch closely. A minor pullback to $0.431 and a bounce higher would signal buyers still have skin in the game (Dashed Green Projection).
3. On the other hand, if sellers step up and push XLM below $0.399, things could take a bearish turn. A drop toward $0.325 would be the next logical stop, and traders may want to brace for a deeper pullback if that level fails (Red Projection).
In short: $0.458 is the decision zone. A breakout or breakdown will set the tone. Bulls have a target at $0.525 and then $0.593, while bears have their eyes on $0.40—let’s see who blinks first!

xlm long!"🌟 Welcome to Golden Candle! 🌟
We're a team of 📈 passionate traders 📉 who love sharing our 🔍 technical analysis insights 🔎 with the TradingView community. 🌎
Our goal is to provide 💡 valuable perspectives 💡 on market trends and patterns, but 🚫 please note that our analyses are not intended as buy or sell recommendations. 🚫
Instead, they reflect our own 💭 personal attitudes and thoughts. 💭
Follow along and 📚 learn 📚 from our analyses! 📊💡"

XLM/USDT BULL FLAG In this idea I show that XLM is about to pump out of a bull flag and really start taking off. Pretty basic chart here not too much frills or fluff. Hope you get in for the ride much love - ND

XLM's Correction Complete? Targeting $1.10 with Strong MomentumContext and Recent Price Action
XLM has been one of the standout performers in recent months, showcasing impressive bullish momentum:
The November Surge: Starting from $0.084 in early November, XLM skyrocketed to a peak of $0.63 by the end of the month. This remarkable 613% rally highlights intense buying pressure and growing market interest.
The Correction: Following this explosive move, XLM entered a natural consolidation phase, retracing about 40% of its gains. This correction has formed a classic ABC pattern, with the price finding support at $0.35. Such retracements are common after parabolic moves and often set the stage for the next leg higher.
The Bullish Reversal: On Friday, December 13th, XLM has begun to show signs of renewed strength. After revisiting the $0.35 low, the price has rebounded to $0.43, forming a solid bullish engulfing candle on the 6-hour timeframe. This is a strong indication that buyers are regaining control.
Outlook and Target Projection
XLM's structure suggests the corrective phase is nearing its end, paving the way for the next impulse wave. Considering the prior momentum and market conditions, a price target of $1.10 is highly probable within the next 2 weeks.
Key Levels to Monitor
Entry Point:
Current price at $0.43 provides an attractive entry zone for buyers anticipating the next move higher.
Profit Targets:
$0.65 – Retest of the November high.
$1.10 – Extended target based on historical momentum and potential wave projections.
Stop Loss:
Below $0.35 – A breach of this support would invalidate the bullish thesis and could lead to further downside exploration.
Risk-to-Reward Analysis
With the price currently at $0.43:
Downside Risk: Stop loss at $0.35 results in a risk of ~18.6%.
Upside Potential: Targeting $1.10 offers a reward of ~155%.
This gives a compelling risk-to-reward ratio of approximately 8:1.
Conclusion
XLM's recent surge, healthy correction, and current bullish signals create an excellent opportunity for traders. With clear profit targets at $0.65 and $1.10, and a well-defined stop loss at $0.35, this setup offers a strong blend of technical reliability and favorable risk-to-reward dynamics. As XLM completes its consolidation, it seems poised to resume its upward momentum.
Let me know if you’d like further refinements!

XLM back to .58XLM back to .58
XLM can bounce to the .55 level which has more than 15% upside.
Idea would be invalidated if XLM sustains below .47 for more than 24-36 hours

XLMUSDT - ABC correctionXLM had an increase of over +600% in just 20 days followed by a 15-day consolidation phase suggests an exhaustion of the previous trend. The sideways movement aligns with an ABC correction, where wave C is likely unfolding.
Key Levels and Confluence
Trend-Based Fibonacci Extensions:
1:1 Target for Wave C: $0.3873
Key Support Zone:
$0.3725−$0.3873
Market Sentiment
Lack of Volume: Reflects reduced interest from buyers, confirming a bearish bias.
Below Weekly and Monthly Opens: These levels often act as dynamic resistance, showing bears are in control for now.
