XLM - BITCOIN - UPDATE - Patience Required At This PointThis is a quick video update on what is currently taking place across XLMBTC - XLMUSD - BTCUSD
In my opinion this is a turning point and aside from the obvious reversal signals, this is a time to be patient.
Learning the waves gives you peace of mind which frees up your mental time to think about other markets and the beauty of the patterns.
No point obsessing over something that will take time to unfold.
One word of warning, once XLM starts to gain momentum nothing will stop it!
I will post more ideas shortly to asses the situation in the broader context of the markets.
Check out my previous related ideas below.
Remember to use Disciplined Money Management Principles to ensure longevity as a trader.
If you don't know the long term pattern shouldn't you be doing your research instead of just following the crowd?
Just remember: I am not a financial advisor, I suggest using this only as a guide. Always do your own research.
Each video idea I post builds on the previous idea as I use AriasWave to try and navigate the waves in Crypto Markets.
Xlmbtc

XLM/BTC 1H BUYAlso set some Buy orders near the Trendline
Remember no more than 5% of the deposit in one trade
SL: next sell signal

BITCOIN - Where To From Here?In this video I bring together the XLMBTC, XLMUSD and BTCUSD charts together and attempt to piece together some clues.
My previous post introduced the AriasWave interpretation of the XLMBTC chart which will set the tone for this video.
In order to explain why I believe that XLMUSD and BTCUSD will go against each we have to understand the waves in each chart.
AriasWave gives me the ability to do this because the patterns become clearer the more you learn them.
I know this video idea may cause some controversy but you have to take into consideration that we are in uncharted territory right now.
We have never seen what happens between these Crypto's in a large degree Wave 2 correction before because it has never happened.
That's where AriasWave comes into the equation, without it, these ideas and insights would not be possible in the first place.
See related ideas below.
Remember to use Disciplined Money Management Principles to ensure longevity as a trader.
If you don't know the long term pattern shouldn't you be doing your research instead of just following the crowd?
Just remember: I am not a financial advisor, I suggest using this only as a guide. Always do your own research.
Each video idea I post builds on the previous idea as I use AriasWave to try and navigate the waves in Crypto Markets.

XLM UPDATE - Just Another Day At The OfficeIn this video I start to introduce the XLMBTC chart into the equation to help you understand what is happening here.
XLM is bouncing back and this is just another buying opportunity.
Are we going to catch every single buying opportunity at exactly the right time? Maybe if you are a market Ninja.
It's funny how some of you try to bag me out yet you keep coming back for more. You guys are secretly my biggest fans, just admit it.
If you do not learn the waves you will continue to go through the stress of not knowing what is next.
Your own education is the most valuable thing, not just making some blind profits because of the hype around crypto.
FOMO = Bad Investment Decisions.
Lack of knowledge = Stress, which also leads to Bad Investment Decisions.
Remember to use Disciplined Money Management Principles to ensure longevity as a trader.
If you don't know the long term pattern shouldn't you be doing your research instead of just following the crowd?
Just remember: I am not a financial advisor, I suggest using this only as a guide. Always do your own research.

Stellar ATH coming Stellar Looking good for big move,
0.920 is critical so I'll expect to bounce back down then up to ATH at 1.11
Fibonacci is siting right on 1.11 and my measured move it's sitting right on the price.
I'm not financial adviser please do your own research before trading,trading is risky and you can lose your money.


XLM Going to pump up? 💣Hello Traders. I hope you are having a great Tuesday.
Today I want to talk about XLM. Well as you can see in 4H timeframe, price broke the green area which was ATH an has retested it 2 times and has gone up
since then. Now price is moving in a channel and recently has broken out of a purple range and in smaller timeframes has managed to pullback to it. So in my
opinion it is a good place to open a long position.
Entry : 0.61$ ( around purple range ) Target : 0.8$ ( midline of the channel ) Stop loss : 0.58$ ( if the candle closes below the purple support )
Midterm target for XLM can be around 1$.
🚩 Always remember to put stop loss for your orders in order to reduce the risk of your trades.
🚩 Always keep an eye on BTC chart as well because it can affect the movement of altcoins as you all know my dear traders.
If you want to check out my other analysis , I have linked them below and also don`t forget to follow me for further updates and new analysis.
Thank you guys for reading my idea on XLM and don`t forget to comment what you think. ✌

#XLMUSDT #STELLAR - Re-Entering the Path of Glory: Targeting 60%#XLM #Stellar
Targeting
60% @0.83
and 117% @1.10
SL @ 0.51

Stellar (XLM) - May 17Hello?
Dear traders, nice to meet you.
By "following" you can always get new information quickly.
Please also click "Like".
Have a good day.
-------------------------------------
(XLMUSD 1W chart)
(1D chart)
You should watch for any movement that deviates from the 0.65641072-0.81250044 section.
In particular, we must see if it rises above the 0.75097460 point and follows the uptrend line.
If you decline at 0.65641072, you need a short stop loss.
However, you can touch the 0.61234368 point and climb, so you need to trade carefully.
It is important to be able to open the door of the ascent by touching the 0.81250044-0.86453034 section.
However, it appears that the BTC price is undergoing a cascading decline, so careful trading is necessary.
-------------------------------------
(XLMBTC 1W chart)
On the CCI-RC indicator, the CCI line is attempting to rise above zero.
As a result, volatility may occur, so careful trading is necessary.
(1D chart)
We have to see if there can be any movement to ascend above the 1560 Satoshi point.
If it falls, we need to make sure we get support in the 1392 Satoshi-1453 Satoshi section.
If it falls at the 1208 Satoshi point, a short stop loss is required.
--------------------------------------
It is advisable to trade at your average unit price.
This is because if the price flows below your average unit price, which was on an uptrend or downtrend, there is a high possibility that you will not be able to earn a large profit due to the psychological burden.
The center of every trade starts with the average unit price you start trading.
If you ignore this, you may be trading in the wrong direction.
Therefore, it is important to find a way to lower the average unit price and adjust the proportion of the investment, so that the money that ultimately corresponds to the profit can regenerate the profit.
-------------------------------------------------- -------------------------------------------
** All indicators are lagging indicators.
So, it's important to be aware that the indicator moves accordingly with the movement of price and volume.
Just for the sake of convenience, we are talking upside down for interpretation of the indicators.
** The wRSI_SR indicator is an indicator created by adding settings and options from the existing Stochastic RSI indicator.
Therefore, the interpretation is the same as the conventional stochastic RSI indicator. (K, D line -> R, S line)
** The OBV indicator was re-created by applying a formula to the DepthHouse Trading indicator, an indicator that oh92 disclosed. (Thank you for this.)
** Check support, resistance, and abbreviation points.
** Support or resistance is based on the closing price of the 1D chart.
** All explanations are for reference only and do not guarantee profit or loss on investment.
Explanation of abbreviations displayed on the chart
R: A point or section of resistance that requires a response to preserve profits
S-L: Stop Loss point or section
S: A point or segment that can be bought for profit generation as a support point or segment
(Short-term Stop Loss can be said to be a point where profits and losses can be preserved or additionally entered through installment transactions. It is a short-term investment perspective.)
GAP refers to the difference in prices that occurred when the stock market, CME, and BAKKT exchanges were closed because they do not trade 24 hours a day.
G1: Closing price when closed
G2: Market price at the time of opening
(Example) Gap (G1-G2)

XLM/BTCXLM/BTC has broken out from + 2 year range , its going to follow other majors .
I am very bullish on this one.

$XLM/BTC longeterm bullish targets$XLM, Stellar, another old coin ready to go for a ride.
For $XLM using 2 set of fibs.
1st fibset is old one used in previous cycle with the never reached target of the 2.618 fibline at 8.5k satoshi, making it the first target for this cycle.
4.236 of the first fibset at 14k satoshi market another interesting point which together with the 2.618 at 16.5k satoshi of the new fib set makes up an area suited as the 2nd target.
Finally the 4.236 fibline of the new fib set at around 26k satoshi which is the final target from my perspective.
In case of XLM reaching all the way up to 26k satoshi and showing real strength one should consider the price breaking upwards into another fib set, which I plan to update accordingly on the chart depending on future circumstances.


Stellar XLM is following ETH and ADA in the bullrunWe have confirmed the breakout ,, will enjoy nice ride like ETH and ADA

In Bitcoin 80.000$ Not Joke. + %80#Bitcoin will definitely go for $ 80,000. But first they wanted altcoin season.
It looks like everyone will run to bitcoin when the altcoin season stops.
It may even be 95 thousand dollars. I am not kidding.
We are Preparing for the Future. #Btc Legend will rise in the future.
Follow the rise in Ethereum. I have a target of -69-73-80-95-120 thousand dollars for Btc the moment #Ethereum stops rising and I don't think we will understand what this will come very fast.
Whales in the market are buying BTC. And whales don't easily buy high-volume bitcoins.
Don't Forget These Days. #Hodl
When It's Time to Rise Nobody can hold bitcoin.
It can fall to 38 thousand. Progressive Buying is correct.
You can zoom in on my analysis in my articles about Bitcoin.
How they keep it, How they will keep it, My analysis will come.
not investment advice.

XLM potential 1 $ -3 $ +%216 XLM, XTZ, XRP, ADA are very interconnected coins. investors invest in the same group at the same time. time shows the same time.
In these coins, the case is no longer considered important, even if it is a matter of law.
Everyone will have trouble. In the future, it may be beneficial to enter it a little bit rather than taking it from the top.
I'm adding back the tp I got because I got it from the bottom.
Everyone wants to earn money, if anyone wants to get out of the points I mentioned earlier.
Think like an Investor, plant the soil, take your harvest and enjoy yourself, there is a boom in the Trade business, there is a stop, there is a loss.
You can't get out of big money. So get tp. Try to add stop-loss.
I usually add it to the 12h Ema144-Ema72 band. Of course, this means a serious decline, but because my team is on watch, it takes the necessary actions.
Pay attention to your risk. Be careful not to sell at loss.
Do not be afraid while experiencing stop-loss, that is, cutting losses.
Our research is based on at least 1 month ago. It is not investment advice.
There is no shaking in any analysis, we look at research, indicator, money inflow, special software, risk analysis, market research, statistics and a few more details.
If you don't think the same way, you can enter a reverse action.
You can buy and sell it wherever you want. Absolutely the decision is yours.
This job has nothing to do with luck. This is an investment. Big wins.

STELLAR LUMENS : THE STEP BY STEP GROWING ROAD - LONG SETUP 🔔Welcome back Traders, Investors, and Community!
Check the Links on BIO and If you LIKE this analysis, Please support our page by hitting the LIKE👍 button
Traders, if you like this idea or have your own opinion about it, please write your own in the comment box . We will be glad for this.
Feel free to request any pair/instrument analysis or ask any questions in the comment section below.
Have a Good trading day!

XLM - long base big move !!XLM Stellar is poised for a big move !!
It has been basing against bitcoin for about 24 months - or 2 years !!
Big base - Big move !!
In USD we are making new 2021 highs at the moment !
Above 1250 - 1350 satoshi it is GAME ON BIG TIME for XLM !!
Do not waste this opportunity !
I am positioned and raised my position by 30% last week when XLM was around 50 cents.

Here I buy Stellar Lumens against Bitcoin and XLM will go upHere I buy Stellar Lumens against Bitcoin. The price is testing the major resistance against Bitcoin, so now I buy and the bullish breakout against Bitcoin will start.
And Stellar Lumens will go up.
See you up there

Xlm-Btc LONG- weekly close above structure=Big gainsThe xlm btc pair has created a structure between the current range of 350-1300 sats over the last few months but is currently attempting to break above this structure
- it seems biased to upside and a clean weekly close above 1300 sats could start a massive leg up toward its ATH on this pair
-eth is cooling off after a massive run and stellar is an alternative smart contract building platform that could receive some liquidity from eth profits
- while most altcoins have broke ATH or are up 1000% plus this year stellar has had modest performance compared to some and though you could have technically bought stellar for 3 cents a little over a year ago that price only lasted a matter of hours and the bottom generally as around 6-8 cents for the most part
- xlm is one of the few extremely cheap transfer fee, transact in seconds, significantly decentralized coins
I am biased, invested in stellar, and this does not constitute financial advice. But if I could give you financial advice it would be to buy the weekly close above 1300 sats coming up
PLEASE SHARE THOUGHTS AND COMMENTS :)

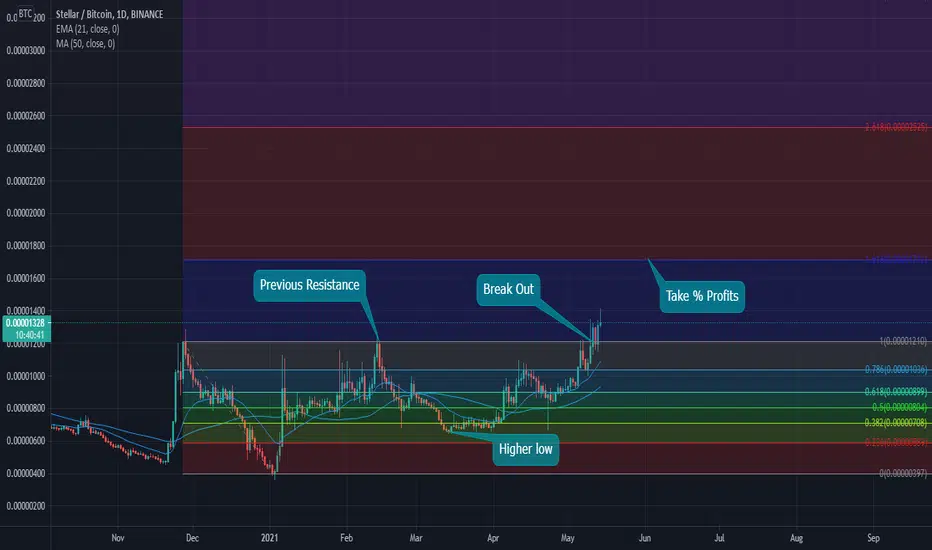
Stellar Lumens vs. Bitcoin Trend Reversal - XLMBTC, XLM, XLMETHXLM/BTC has been rangebound for nearly a year. This week, from May 10 - May 14, XLMBTC probed outside of its range before breaking out and closing at a new 1 year high. This generated a BUY signal for me in XLMBTC, and I am ID'ing the pattern as a Head and Shoulders bottom (trend reversal).
Price would need to move below the low of the week to negate this signal, and hence I view this as a low risk entry opportunity, assuming no major liquidity concerns.
I also view the XLM/ETH chart as constructive.
Stellar's website describes it as a fast, open-source blockchain network for payments and currencies. In short, it attempts to connect financial institutions while providing cheap transactions. Coins with faster, lighter (and albeit less secure) transactions than those on the bitcoin network are gaining exposure after Elon Musk tweeted that bitcoin uses too much energy. Musk also noted that Tesla was not selling the bitcoin it purchased as treasury reserves, but that the company is looking for cryptocurrencies that are more "environmentally friendly" to be more in-line with Tesla's overall mission statement.
BITFINEX:XLMBTC

XLMBTC Massive Breakout ImminentStrong Candle through the resistance levels on the weekly, weekly close here would look extremely good. possible small retracement to the 38fib level and a continuation upwards towards 2 targets given. Long term hold for this one. (4-8 weeks). Trade Safe.

Profit targetsWhen considering BTC.D now is not the time to get greedy on profits. It's not fun to be on the wrong side of a altcoin price correction. I have included my other thoughts in chart labels.
STELLAR LUMENS (STR/BTC|XLM/BTC) LONG TERM MOVETechnicals:
Weekly EMAs are crossing and momentum is shifting towards the bulls
Monthly BBands are squeezed tight and significant accumulation has taken place over the past couple of months and the BBands are ready to expand for a parabolic move
Descending wedge repeating fractal pattern
Inverse H&S pattern formed on the daily period (same at the start of the previous 2017 cycle)
BTC Ratio Targets:
TP1 = +- 0.00002100
TP2 = +- 0.00002800
TP3 = +- 0.00003500
TP4 = +- 0.00004600
TP5 = +- 0.00006200
