Xlmbtclong

XLMUSDT - Enjoy 🚀🚀🚀 (1H Signal) Follow me, its good IDEA :)
Now XLM is very interesting for a little time frame scalping. (1,5,15m)
for a long position we need hard confirmation for a trend.
Please share your opinion in the comments
This is not financial advice !!!

$XLM Stellar looks up higher! Stellar Lumen $XLM
Stellar’s cryptocurrency, the Stellar Lumen (XLM), powers the Stellar payment network. Stellar aims to connect banks, payment systems, and individuals quickly and reliably.
In range now and good to add to your portfolio IMO.
Let me know what you think!
DYOR and take profits.

XLMWe could get an impulsive 5 up soon, XLM has broken out of the triangle and appears to be done correcting. As long as BTC plays nice we should get 5 up back to ATH soon.

XLMit appears that bottom is either already in or maybe another retest of the lows from last night EST USA

Stellar XLM to 0.56$ ?XLM in daily candles are showing us a cup and handle pattern, where their target is at approximately $ 0.56 which represents a 61.80% fibo of the corrective trend.
If Bitcoin stays bullish, it can give the market the push it needs for XLM to hit $ 0.80 again.

xlmusd daily scaleCurrently, it can experience growth up to 0.47 if the 4-hour downtrend ceiling breaks, but depending on the chart behavior, it can experience a downtrend in the range of 0.2 to 0.22, and if the downtrend continues, the next support range 0.094 to 0.103.
To rise in price and get rid of the resistance areas ahead, it must have a strong and successful break above the 0.48 limit to be able to reach the $ 1.1 range and then move to higher numbers in the medium term.
Time analysis targets are also indicated in the image.


XLMTrying to count XLM is increasingly complex b c I would dare to say (probably b c I love XLM) that if XLM was a stock it would give BTC the middle finger and just pump now. But because the market is under such pressure I imagine that wont be the case, so I present 2 possible scenarios .


XLMBTC Technical AnalysisThe price is in an uptrend and has been making HLs. it seems that it's at the pullback area now and it's expected to go higher from here at least up to 0.00001481
SL @ 0.00000953 or at Support Breakout
TP1 @ @ 0.00001481
TP2 @ 0.00002015

XLM/BTC 1H BUYAlso set some Buy orders near the Trendline
Remember no more than 5% of the deposit in one trade
SL: next sell signal

#XLMUSDT #STELLAR - Re-Entering the Path of Glory: Targeting 60%#XLM #Stellar
Targeting
60% @0.83
and 117% @1.10
SL @ 0.51

Stellar XLMUSD - Potential Bullish ScenarioThings to Note:
1. Bullish Market Structure- Printing HH and HL
2. Price forming an Ascending triangle pattern
3. Following a rough uptrend line
4. Volume is low atm but it should expand at the BO
P.S: This is NOT investment advice. This chart is meant for learning purposes only and is a part of my personal journal. Invest your capital at your own risk


XLM/BTC has a big decision aheadXLM/BTC ratio is either going to break out largely to the upside or remain stubbornly low in the low level megaphone pattern.
Large asymmetric trade here, especially if the bitcoin price remains as high as it is.

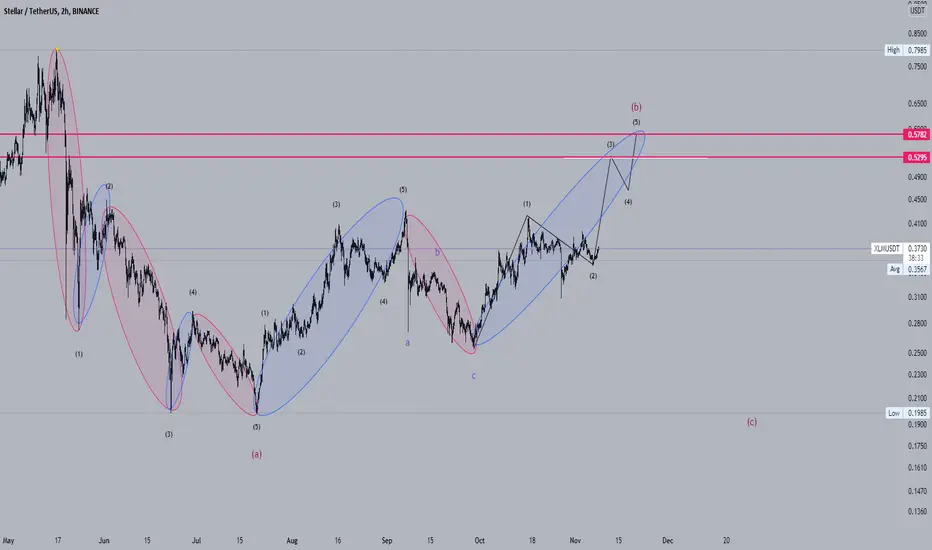
XLM 2HRSStellar tested his support floor And now we have to see Stellar rise from the floor to the canal !


XLM FOR TARGET 0,75 - Shows huge increase trend comign timeHello trading friends,
XLM shows a great increase next time - and our target for XML are 0,75
we expecting to see this target. we choice always the best coins for increase trend.
Follow us for more Targets.
