XLMETH
C & H XLMBTC ; Short to mid to long Another parabolic upswing for the optimum entry making it poised for an ideal shortsell position
Essentially this is also a viable Long position and TP target for short and Long are both presentable As entry points indicated by the lines drawn on earth he chart you see above.
Short @ 838s
Trade safely and invest wisely. Peace & love.
@a1mtarabichiShort to mid to low
Valari Bot Feedback XLM/ETH BUY ON 04/07/19Hello everyone,
The second trade the bot has active is XLM/ETH.
At this point, XLM is testing lows so it might take another 30-60 days to exit this position, considering the fact that this account was supposed to be a long term long I im really bothered right now.
P.S XLM is going to 0, don't long it unless you have a tight stop 2% max.
All the best
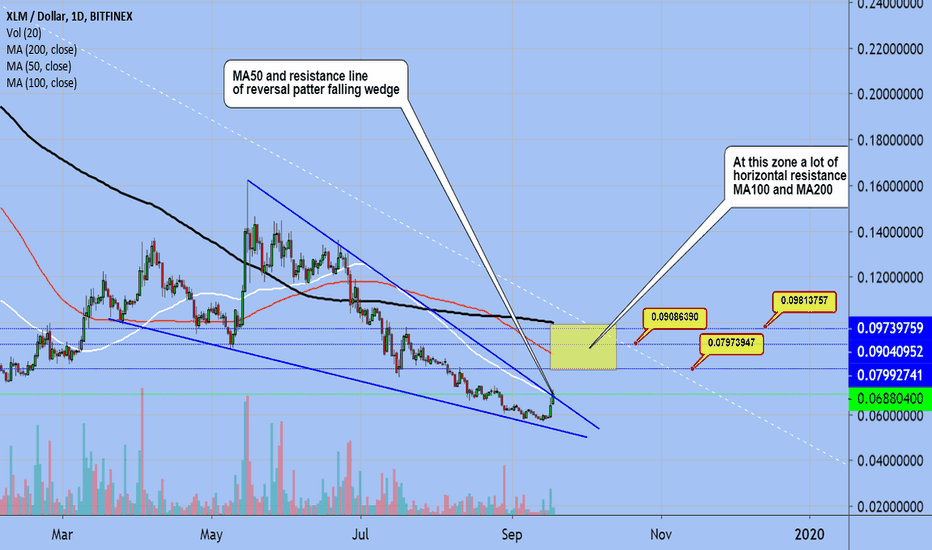
XLM - Indicators are BullishXLM has been selling off like it has the plague. This may however set up a nice short-term trade. It's daily RSI is 17 which is really oversold. The price action is in a falling wedge and has hit strong support. I think the bears may be exhausted and it could give the bulls an opportunity to seize the moment as long as BTC remains stable. Bullish divergence can be seen on the MACD as well. Keep on eye on Stellar for a price reversal. The signs are there.
XLM: Stellar Next Wave 30% !!XLM on the Channel Bottom if you are trade XLM then you can pick around 3600-3700 Set StopLoss 3400 and Target 4500.
Let See What Will be Next Move ..
I hope that Next Wave will be Move to our Target.
if you are doing Trade XLM then ,
you can also Set Stop Loss own RR Ratio.
Warning- I m Not a Financial Advisor this idea Only For Educational Purpose Only.
Thank You !!
XLM : STELLAR Head & Shoulder Pattern Trade Carefully !!XLM Are Trying to Make Head & Shoulder Pattern if NeckLine Breakout then We can See Trend Reversal Bullish to Bearish Trend Because Head & Shoulder is a Trend Reversal pattern, So Trade Care Fully.
if You Satisfied Then Dont Forgot To Hit Like.
Warning- I m Not a Financial Advisor this idea Only For Educational Purpose Only.
Thank You !!
XLMETH - Swap soonMarket dropped as expected from my views on Crypto. Now what's next for Holders?
During this kind of market, holders should swap to a better coin comparing to main coins that they are holding, for example ETH holders should consider to swap to XLM 0.00% (then swap back in a better time) because this XLM/ETH likely continues its uptrend as my analysis on the chart.
So, it's time to do something instead of sitting and enjoy the damage.
Leave your LIKES/COMMENTS to support. Thanks!
XLMETH - Swap soon Market dropped as expected from my views on Crypto. Now what's next for Holders?
During this kind of market, holders should swap to a better coin comparing to main coins that they are holding, for example ETH holders should consider to swap to XLM (then swap back in a better time) because this XLM/ETH likely continues its uptrend as my analysis on the chart.
So, it's time to do something instead of sitting and enjoy the damage.
Leave your LIKES/COMMENTS to support. Thanks!
Stellar (XLM) Next Move 70% !!XLM Are making Triangle and also following a Strong Trend line Some Rumors are Coming that COINBASE may be Listed if Listed then Price can Pumped otherwise Technically is also Good XLM Coin For Mid Term and Long Terms.
3600 is Good Buying Zone if Cross 4500 resistance levels then we can See Positive Movement upto 70% or More.
Let See........!!
Share Your Opinion in Comment Box.
if You Satisfied With My idea Then Dont Forgot To Like .
Warning- I m Not a Financial Advisor this idea Only For Educational Purpose Only.
ThankYou........!!
Trade XLM / STELLAR easily with 1 indicatorBuy Green
Sell Red
//
it's mainly for swing trading, i use the 3 day / 15 day / monthly charts with it and it works perfectly,
//
it works good for stocks and cryptocurrency.
//
you will use heiken ashi chart style and turn on the EMA DOTS indicator.
once the indicator is on you will hide the heiken ashi so you only see the dots.
//
when a green dot -7.44% appears you buy, if a green dot -7.44% appears after that green dot -7.44% you hold your investment.
if a red dot appears you sell your position. easy as that.
//
the standard dots setting will be set to 10 - use this for any chart above 3 days
change the dots setting to 6 for 3day charts and below
//
shorter time frames will be choppy.
//
larger time frames will be smooth.
//
*Daytrading smaller timeframes is possible but not recommended.


