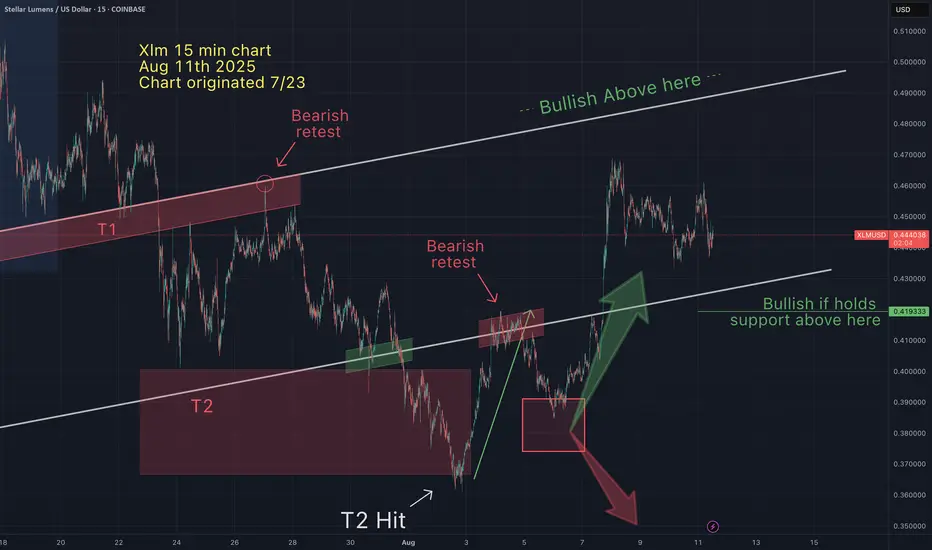
How did I know that Xlm would retrace...then bounce off $0.38?On Aug 5th I suggested that Xlm was apporaching an "inflection point", indicated by my green and red arrows converging at $0.38. See chart below from Aug 5th.
In mathematics an "inflection point" is a point in the curve at which a change in the direction of curvature occurs. These price charts are merely graphs, with coordinates and reoccuring patterns. Anticipating inflection points allow me to determine directionality. Knowing where direction may change allows me to either make quick profitable decisions and/or where to set appropriate stops (invalidation).
TA works!
Xlmshort
Stellar (XLM) Rejected Hard—Brace for $0.25 Next?On the daily chart of XLM/USDT, price has made a steep, parabolic rise, pushing directly into a well-established resistance zone around $0.5155. This level has historically capped price moves, evident from several prior swing highs clustering near this area. The rally itself unfolded rapidly, without significant consolidation, leaving a series of untested supports in its wake.
This combination—a near-vertical climb into resistance—often signals buyer exhaustion. Indeed, the rejection candle formed right at the $0.5155 ceiling, which strengthens the bearish argument.
Below the current price action, there is a broad support zone between $0.3347 and $0.3504. This area previously acted as resistance earlier in the year and is likely to attract some buying interest if price pulls back decisively. Beneath it lie deeper supports around $0.2500, $0.2268, and $0.2000—levels that remain untested during this move up.
While the chart does not display volume bars, the sheer steepness of the final leg suggests momentum was likely unsustainable. Often, such aggressive spikes without healthy consolidation result in a retracement of 30–50% or more.
One critical factor to watch is whether price manages to reclaim and hold above $0.5155. Failure to do so implies that sellers remain in control, raising the probability of a broader pullback toward the mid-$0.30s or lower.
________________________________________
📉 Why This Setup Leans Bearish
This chart structure supports a bearish thesis because:
• Price is reacting strongly to historical resistance.
• The rally was parabolic, making it prone to sharp corrections.
• There is no clear consolidation base above the breakout point.
• Several untested support levels remain below current price, which the market may revisit.
If this move is indeed an exhaustion spike, the next phase is typically a retest of the last major consolidation area around $0.3504–$0.3347.
________________________________________
📊 Potential Bearish Trading Setup
Here is a structured trading idea to consider:
Short Entry Zone:
• Retest of the $0.5155–$0.5200 resistance area.
• Look for confirmation by way of bearish candlestick patterns (shooting star, bearish engulfing, or consecutive rejection wicks).
Stop Loss:
• Conservative stop above $0.6374 to allow for volatility.
• Alternatively, a tighter stop just above $0.5200 if using smaller size.
Targets:
• First target: $0.3504 (major support).
• Second target: $0.2500.
• Third target: $0.2000–$0.2268 (deeper retracement zone).

#XLM/USD - SHORTI won't specify the timing and goals here, but I think it's enough to take precautions and avoid becoming food.
At this stage, there is a hidden bearish divergence and a global extended bearish divergence, and neither of them has even started to develop.
At this stage, the decline is caused by approximately 7 factors, one of which is the Gartley butterfly pattern.
I'm sure no one on the Internet has noticed that the asset has no bullish factors for growth, but there are many bearish factors.
The ratio is:
11 bears vs 0 bulls.
(I have provided 2 out of 11)
If anyone has any bullish factors that they have heard of or know about, please let me know in the comments, but please avoid using hamster triangles or anything similar, as it does not make sense in this game.
(Not an investment recommendation).

XLM/USDT Breakdown: Structure Shift & Bearish Retracement Setup🚀 XLM/USDT Trade Outlook 🔎
I've been reviewing the XLM/USDT pair, and it's showing a very familiar setup compared to other majors. 🔁 On the daily timeframe, we've seen a notable shift in structure, with a clear break to the downside. 🧱📉 Dropping into the 4-hour chart, that structural break is even more apparent, adding confidence to a bearish bias. 🔍
Currently, the pair is extended away from value—and I’m anticipating a pullback into the fair value zone, where I’ll be watching closely for a potential short setup. 📐💼
🎯 In the breakdown video, we cover:
The prevailing trend context 🌊
How market structure is unfolding across timeframes 🔂
Price action cues to validate the setup 🎥📈
Key support and resistance areas for both entry and target planning 🎯
For risk management, I’m positioning the stop above the retracement high, using roughly 2x ATR for calculated protection 🛑⚙️. A potential reward could extend to 5–6x ATR, depending on how price reacts around prior structure levels on the left. ⬅️📊
As always, I’m cross-checking with my Fibonacci levels for extra confluence—and the alignment here is looking solid. 🔢🧲
Remember, this is not financial advice. Always do your own due diligence. ⚠️💡📉

Stellar can give a Stellar Performance?Stellar is ideally going to the buys on the point of attraction where green line is shown, unless small ups, its better to big long to the position marked or short when comes to yellow box, breaks above the red line of the yellow box will defy whats made.

XLM SHORT Stellar Lumens 5-15min Chart:It appears to me there will be a shorting, so I am looking at a short-term scalp short on XLM 5min chart. Tradingview would not let me publish 5min so I am publishing on a 15min chart.

XLMUSDT Short Idea - Struggling to Maintain Bullish MomentumXLMUSDT has had a strong run up to ~$0.63, as have many other alts, but is now struggling to maintain that bullish momentum.
Looking at a fib retracement view of the bullish push, we can see that the price action has been oscillating between the 0.5 and 0.618 fib levels and has once again been rejected off the bottom of the 0.5 level.
This chart shows a lower timeframe snapshot of that price action rejection off the bottom of the 0.5 fib.
From a bearish push fib retracement view, we can see that there is confluence between the 0.5 bullish fib level and the 0.618 bearish fib retracement region. We can see this level holding well and a potential rejection back down towards another bearish move.
The target for this short idea is a combination of the supply order block level sitting around 0.26, and the -0.618 fib extension level of the bearish fib retracement fib. Stop placement is above the order block flip zone indicated by the yellow box. For lower timeframe traders, a tighter stop could be attempted if you watch the price action closely following a breakdown below the last point of support at 0.38.

XLM/USD: Signs of Overextension and Impending CorrectionStellar (XLM) experienced a dramatic surge, skyrocketing from $0.09 on November 7 to a local high of $0.63 on November 24. This rapid rise of over 600% in just a few weeks indicates clear overextension in the market. Such sharp upward movements are often unsustainable without periods of consolidation or correction.
Current Market Context:
Current Price: $0.48
Recent High: $0.63
Key Support Levels: $0.36, $0.25
After hitting $0.63, XLM has pulled back to $0.48, a strong signal that the market may need a correction to stabilize. This retracement reflects profit-taking and waning momentum, both common after such parabolic moves.
Possible Correction Scenarios:
Moderate Pullback to $0.36:
The first likely scenario involves a pullback to $0.36, a key support level that aligns with previous consolidation zones. This would allow for healthy price action and create a foundation for future bullish attempts.
Deeper Correction to $0.25:
If selling pressure intensifies, XLM could retreat to $0.25, representing a more substantial correction. This level is critical for maintaining a broader bullish structure and could attract buyers looking for value.
Market Indicators:
The RSI (Relative Strength Index) shows signs of overbought conditions, suggesting further downside pressure.
Volume has also declined since the peak, indicating weakening buying interest.
In summary, the overextension from $0.09 to $0.63 signals a market that may need to cool down. The current decline to $0.48 underscores the likelihood of a correction, with key support levels at $0.36 and $0.25 in focus. A healthy pullback could reset the market for a more sustainable rally in the future.

#XLM/USDT#XLM
The price is moving in a descending channel on the 1-hour frame and is holding it tightly and is about to break out to the upside
We have a bounce from the lower limit of the channel at 0.0900
We have a bearish trend of the RSI that is about to break out, which supports the upside
We have a trend to stabilize above the 100 moving average
Entry price 0.900
First target 0.0920
Second target 0.0988
Third target 0.1031

XLM/USDT 1DAY UPDATE BY CRYPTOSANDERS !!Hello, welcome to this XLM/USDT update by CRYPTO SANDERS.
CHART ANALYSIS:- Stellar (XLM) was also in the green in today’s session, after two consecutive days of price declines.
XLM/USD peaked at 0.1154 earlier in the day, which comes less than 24 hours after falling to a low of 0.1122.
As a result of the decline, bulls continued to push the token away from a recent floor at 0.1100, and back on course toward resistance at 0.1320.
Today’s rebound was helped by the RSI reaching a floor of its own at 37.00, and it is now tracking at 39.87.
A ceiling at 44.00 now awaits bulls and could be the main hurdle preventing further gains this weekend.
I have tried to bring the best possible outcome to this chart.
Hit the like button if you like it and share your charts in the comments section.
Thank you.

XLM/USDT 1DAY UPDATE BY CRYPTOSANDERS !!hello, welcome to this XLM/USDT update by CRYPTO SANDERS.
CHART ANALYSIS:- On the other side of the spectrum was stellar (XLM), which dropped by over 8% in today’s session.
XLM/USD bottomed out at 0.1195 on Wednesday, less than 24 hours after residing at a high of 0.1318.
This drop in price saw the token fall for a third consecutive day, falling below a floor of 0.1200 in the process.
It appears that today’s sell-off coincided with the RSI failing to remain above a point of support at 49.00.
Price strength is now tracking at 44.53, with the next visible zone of stability around the 37.00 region.
In the event that this level is reached, XLM will likely be trading under 0.1100.
I have tried to bring the best possible outcome to this chart.
Hit the like button if you like it and share your charts in the comments section.
Thank you

XLM/USDT 1DAY UPDATE BY CRYPTO SANDERS !!hello, welcome to this XLM/USDT update by CRYPTO SANDERS.
CHART ANALYSIS:- Stellar (XLM) also hovered in the green, as the price remained near a resistance level of 0.1300.
XLM/USD rose to a peak of 0.1243 earlier in the day, which comes following a low of 0.1178 the day prior.
The move comes as the 10-day (red) moving average approaches an upward crossover with its 25-day (blue) counterpart.
the RSI is on the cusp of breaking out of a key resistance level of 50.00, which has been held for close to a month.
Bulls will potentially aim to penetrate this point in the coming days, taking the price near a ceiling of $0.1400.
I have tried to bring the best possible outcome to this chart.
Hit the like button if you like it and share your charts in the comments section.
Thank you

XLM/USDT 1DAY UPDATE BY CRYPTO SANDERS !!hello, welcome to this XLM/USDT update by CRYPTO SANDERS.
CHART ANALYSIS:- XLM was one of the biggest movers, as the cryptocurrency rose by as much as 7% in today’s session.
After trading at a low of 0.1147 on Sunday, XLM/USD moved to an intraday peak of 0.126 earlier in the day.
This surge sees a stellar climb higher for a second consecutive day, following a rebound from a floor of 0.110.
Earlier gains have already begun to ease, which comes due to the relative strength index (RSI) colliding with a ceiling of 49.00.
the index is now tracking at 49.48, with the next point of resistance around 54.00.
Overall, bulls seem to have set their sights on the 0.135 level.
I have tried to bring the best possible outcome to this chart.
Hit the like button if you like it and share your charts in the comments section.
Thank you

XLM/USDT 1DAY UPDATE BY CRYPTO SANDERS !!hello, welcome to this XLM/USDT update by CRYPTO SANDERS.
CHART ANALYSIS:- Stellar (XLM) rose higher on Saturday, following a recent six-day losing streak which pushed the price to a multi-month low.
XLM/USD climbed to an intraday peak at 0.12 earlier in today’s session, which comes following a low of 0.1115 the day prior.
The move comes as Stellar continued to move away from a support point at 0.110, which was hit on Thursday.
This was the first time the price collided with this floor since mid-June and comes as the relative strength index (RSI) hit its own floor at 30.00.
the index has also rebounded and is now tracking at 34.84, which is marginally below a ceiling of 36.00.
Should it push past this point, the next likely price target will be around a ceiling of $0.1340.
I have tried to bring the best possible outcome to this chart.
Hit the like button if you like it and share your charts in the comments section.
Thank you

XLM/USD 1DAY UPDATE BY CRYPTO SANDERS !!hello, welcome to this XLM/USDT update by CRYPTO SANDERS.
CHART ANALYSIS:- Additionally, Stellar (XLM) was another token in the green on Monday, as it continued to move away from a floor of 0.1345.
Following a low at 0.1380 on Sunday, XLM/USD rallied to an intraday high of 0.1431 earlier in the day.
This is the third straight session that Stellar has traded higher and comes despite a recent downward crossover of moving averages (MA).
the 10-day (red) MA moved below its 25-day (blue) counterpart, which is typically a bearish signal.
Even though momentum has shown signs of weakness, XLM bulls will likely continue to target exits at a ceiling of 0.1600.
I have tried to bring the best possible outcome to this chart.
Hit the like button if you like it and share your charts in the comments section.
Thank you

XLM STELLAR SHORT SETUP 2hXLMUSDT (#STELLAR) seems is prepared for correction along with BTC. So, I think we can short it after a small recovery. DYOR. NFA. Lets see what happens.

#XLMUSD - Drop to Recent Support, or Further?After a very healthy 15% gains from a recent #Lumen Long trade with Crypto Tipster v2 we've now been shown a Sell signal after testing and getting rejected by strong descending resistance.
We do have a reasonably close level of support with #XLM, how strong this support turns out to be is the question (isn't it always!) We'd set a TP1 level on this support with TP2 at the obviously strong level underneath this.
If you enjoyed or agree with this idea - drop us a comment, like & follow! :)

XLM USDT Double Top 👏here is XLM analysis where you can get an idea 🚀
XRP shows Double Top lets hit the target 💥
Stoploss is Must

XLM UP AND DOWNThere is potential for XLM to rise to the marked red zone and then correct. Set stops for your positions.

XLM not looking goodXLM picked up no steam on ETH pump, ETH sentiment looks bad now XLM could drop to .07 from here, as sad as it is this is the time to be selling, ill be selling ATLEAST half of my positions on this small supportive bounce, I think this support will be invalidated and we could test lower to levels of .09 first then to .065. A move above the supportive red line would invalidate the bearish scenario
XLM TO $0.03 (£0.025)- XLM is in a downtrend as you can see.
- It will most likely reach £0.025
- The first target where I will personally take some small profits is at the 4.618 level at $4 (£3.30) - 132 X RETURN
- MY second target would be around $30 (£24) - 960 x RETURN
- So if you was to invest £1,000 at £0.025 you could turn that into £132,000
- If you was to invest £1,000 at £0.0.25 you could turn that into £960,000 this could take around 5-8 years!
- NOT FINANCIAL ADVICE!!!
