XLM/USDTesting/tracking elliot wave theory. Please do not trade off idea without S/L. Not financial advice.
The bottom looks like it's in. I can still see another leg down tho (C) wave shows another leg down to 0.05 area. This scenario is not likely to come, but never say never.
How I would trade this: Buying now and adding on the way down if it goes. We call this method laddering down or dollar cost averaging.
Once again, not financial advice.
Risk/Reward: 17.5
People say never go in on trades if RR ratio is not around 3...
This is huge.
XLMUSD

ARIASWAVE MARKET UPDATE - Turns Take Time, patience required.In this video I take you through some simple cycle analysis to add credence to my wave counts.
Things becomes a bit clearer when you take a step back and look at the bigger picture.
What exactly do people expect will happen to the markets?
Since when did the main stream media warn me that a crash is coming in time to save my capital?
If I relied on the mainstream media I would already be completely broke because the move down started months and months ago.
I am not buying their good Samaritan warnings. I am doing the opposite.
I am not just a contrarian but I also have AriasWave to guide me through these types of corrections.
Remember to use Disciplined Money Management Principles to ensure longevity as a trader.
If you don't know the long term pattern shouldn't you be doing your research instead of just following the crowd?
Just remember: I am not a financial adviser, I suggest using this only as a guide. Always do your own research.

XLM TO $0.03 (£0.025)- XLM is in a downtrend as you can see.
- It will most likely reach £0.025
- The first target where I will personally take some small profits is at the 4.618 level at $4 (£3.30) - 132 X RETURN
- MY second target would be around $30 (£24) - 960 x RETURN
- So if you was to invest £1,000 at £0.025 you could turn that into £132,000
- If you was to invest £1,000 at £0.0.25 you could turn that into £960,000 this could take around 5-8 years!
- NOT FINANCIAL ADVICE!!!

ARIASWAVE - XLM STELLAR LUMENS - PRICE ACTION UPDATEIn this update I highlight how XLM has been taking a very clear path towards the target to complete the final 5-Wave Move to the downside.
So far nothing suggests that XLM will continue to plummet after this move is over but rather it should begin to form a base in the coming days and weeks.
Once we complete the move it is my assertion that we see a move back up above where this pattern began in order to confirm that the whole correction is over.
Don't be surprised if the broader markets also start to see signs of life.
Remember to use Disciplined Money Management Principles to ensure longevity as a trader.
If you don't know the long term pattern shouldn't you be doing your research instead of just following the crowd?
Just remember: I am not a financial adviser, I suggest using this only as a guide. Always do your own research.

ARIASWAVE - XLM STELLAR LUMENS - PRICE ACTION UPDATEIn this video I cover the latest price action update for XLM Stellar - Lumens.
This Wave E is moving slow which indicates that the bear market has already weakened substantially.
To be honest not much has changed which is why I have delayed this update until now.
If you do not have a relatively accurate way of observing price action then chances are that you spend
a significant potion of your valuable time trying to figure out what is happening.
Nothing could be more painful than observing such negativity in the media and trying to find a good entry point.
That is exactly why I ignore everything I read and hear from the mainstream media that relates to the economy.
Treat the media as entertainment because that is all it is good for, if that.
My goal is to help you understand what is happening using ARIASWAVE.
Once we start this new bull market I believe it will become clear how effective this methodology really is.
Me myself I am just dollar cost averaging into this because it's likely that we will never see these prices again.
Remember to use Disciplined Money Management Principles to ensure longevity as a trader.
If you don't know the long term pattern shouldn't you be doing your research instead of just following the crowd?
Just remember: I am not a financial adviser, I suggest using this only as a guide. Always do your own research.

XLMUSD - 1W - Wait for the end of this falling wedgeHi guys,
on the weelky timeframe we can notice Stellar (XLM) is in a giant falling wedge pattern. This is usually a pattern leading to an upside move.
We can't ignore the red path as bitcoin and macro are not at their best at the moment. Bitcoin still on the edge of further downside.
However, if things can get better for crypto, we can imagine (and pray) for the green path.
then first target would be the 0,47$ (strong resistance and ichimoku level on the monthly / daily)
then second target is the top of the falling wedge which is also the previous ATH (weekly close) at 0,70$.
This could form a giant cup and handle. If and only if we have a strong break to the upside with a strong candle close :)
if this cup and handle is confirmed the targets will be awesome.
But dont get excited too quickly there are still many targets to achieve first.
If you agree, please feel free to like this idea :)
Bye guys
NFA

ARIASWAVE - XLM STELLAR LUMENS - PRICE ACTION UPDATEIn this quick update I go over the latest XLM STELLAR LUMENS ARIASWAVE count for what could possibly be that last wave in this entire correction since May 2021.
This is in line with the count in the Euro Dollar chart video which I recently posted.
This is also in line with the long term count for the Dow Jones.
The bears are quickly running out of steam and this whole thing could change direction very quickly.
If these counts are accurate then we could possibly be about see huge reversals take place within the coming days and weeks.
A lot of the fraudulent BS crypto projects have already been flushed out and exposed as phony.
It is time for the phoenix to rise out of the ashes.
All time highs will be obliterated in the coming bull run but make sure you make informed decisions along the way.
Remember to use Disciplined Money Management Principles to ensure longevity as a trader.
If you don't know the long term pattern shouldn't you be doing your research instead of just following the crowd?
Just remember: I am not a financial adviser, I suggest using this only as a guide. Always do your own research.

ARIASWAVE MARKET UPDATE - These Corrections Are Almost Over.In this video I start off by talking about some XLM price action at the small degree.
After that I head over to the Dow Jones chart and talk about the current mild correction and the main structure.
I also touch on the Bitcoin chart and make comparisons between the two and theorize on the potential reason behind these pullbacks.
In a nut shell resistance becomes support especially when there is a breakout after a correction completes.
No one entity controls the markets, the waves are the sum total of the collective behavior of all market participants.
Who doesn't love a good conspiracy theory but just remember none of it makes a difference to what the waves will do.
Afterall, human behavior is still human behavior no matter how you look at it and humans are very predictable over the long term.
Remember to use Disciplined Money Management Principles to ensure longevity as a trader.
If you don't know the long term pattern shouldn't you be doing your research instead of just following the crowd?
Just remember: I am not a financial adviser, I suggest using this only as a guide. Always do your own research.

XLMUSD is about to pop after hitting absorptionTesting out some new things and Wanted to document this. I think by the end of the blue line at the bottom price should pop signifying it has hit absorption. Pull back into 7 for the final dip into liquidity and then pop again right at the vertical line after 7. This will be its move out side of this box it has created with the price action and the move for profits.
by iCantw84it
05.28.22

XLMUSTD SUPPORT AND RESISTANCE LINEThe strategy of breaking the support lines and resistance of the trader. when the green line (11.78) broken and Confirmed by candle in pool back we can buy it with RR2
on the other hand if red line (10.43) broken and confirmed by candle we can sell it with RR2

ARIASWAVE - XLM STELLAR LUMENS - Let's Look At This Logically...In this video I go into some in-depth thinking about the current state of markets.
XLM is just another example of why you should ignore the media and other crappy sources of info.
Using logic, the waves and listening to smart people it's much easier to understand why it's good to be greedy when others are fearful.
Buy when there is blood on the streets, even if it's your blood.
Let's put this all together in the most bullish way possible whilst others are licking their wounds.
Remember to use Disciplined Money Management Principles to ensure longevity as a trader.
If you don't know the long term pattern shouldn't you be doing your research instead of just following the crowd?
Just remember: I am not a financial adviser, I suggest using this only as a guide. Always do your own research.

XLMUSD: Double BottomXLM could see a 50% rally up to a previous support level where it might then test it as new resistance if the rally proves weak. One may want to wait until after the FOMC before putting full size on this trade just incase there is any negative volatility during the meeting.

XLMUSD ❕ Stellar above the liquidity zoneStellar broke above the liquidity zone.
The 50MA broke up the 100MA on the 30m Timeframe.
XLM has fixed above the 100MA on the 30m Timeframe.
I expect the coin to break out of the downward channel in the near future, and if it fixes above the resistance level, the price may continue to rise.

ARIASWAVE MARKET UPDATE - Don't Believe the FUD - Time for BullsIn this video I give you a recap of the previous weeks price action and where we can expect to go from here.
As long as we meet the criteria outlined in this video then we should prepare for positive news.
At the moment there is too much bearishness in the media and sentiment seems to be low.
Just ignore all of that and use the waves to determine future price action.
All it takes is the correct wave count for me to turn from a bear to a bull.
I don't listen to friends or colleagues or even agree with them if they sound right.
I just follow the waves based on ARIASWAVE to make my decisions.
Remember to use Disciplined Money Management Principles to ensure longevity as a trader.
If you don't know the long term pattern shouldn't you be doing your research instead of just following the crowd?
Just remember: I am not a financial adviser, I suggest using this only as a guide. Always do your own research.

ARIASWAVE - XLM STELLAR LUMENS - PRICE ACTION UPDATEThe previous count was invalidated but it doesn't really change much given what is happening in the stock market.
Bitcoin and Ethereum are taking a beating by comparison but then again they haven't been correcting since May 2021 like other coins.
It's their turn to correct.
I still maintain my long-term bullish view because I still believe that March 2020 was the start of a mega bull trend that will last years.
I shall keep dollar cost averaging into this throughout this whole period and I will be bullish until the trend is no longer my friend.
Remember to use Disciplined Money Management Principles to ensure longevity as a trader.
If you don't know the long term pattern shouldn't you be doing your research instead of just following the crowd?
Just remember: I am not a financial adviser, I suggest using this only as a guide. Always do your own research.

Stellar (XLM)- June 14hello?
Traders, welcome.
If you "follow", you can always get new information quickly.
Please also click "Like".
Have a good day.
-------------------------------------
(XLMUSD 1W Chart)
Below 0.124080 is likely to be a mid- to long-term investment area.
Therefore, the key issue is whether it can rise above 0.124080 to receive support.
(1D chart)
In the short-term and medium-term perspective, it needs to rise above the 0.124080-0.132063 section and find support to turn into an uptrend.
However, since a volume profile section is formed around 0.164204, it can be said that it is completely converted to an upward trend only when it rises above this point.
------------------------------------------------------------ -----------------------------------------------------
** All indicators are lagging indicators.
Therefore, it is important to be aware that the indicator will move accordingly as price and volume move.
However, for convenience, we are talking in reverse for the interpretation of the indicator.
** The MRHAB-T indicator used in the chart is an indicator of our channel that has not been released yet.
** The OBV indicator was re-created by applying a formula to the DepthHouse Trading indicator, an indicator disclosed by oh92. (Thanks for this.)
** Support or resistance is based on the closing price of the 1D chart.
** All descriptions are for reference only and do not guarantee a profit or loss in investment.
(Short-term Stop Loss can be said to be a point where profit and loss can be preserved or additional entry can be made through split trading. It is a short-term investment perspective.)
---------------------------------

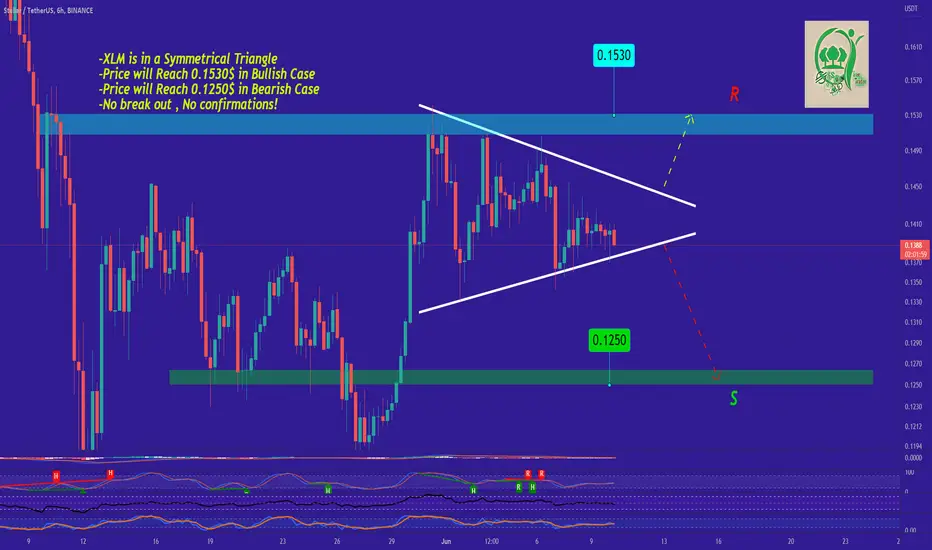
XLM Expected Movement ExplainedStellar is in a Symmetrical Triangle which means the Price can Do a Bullish and a Bearish Movement Depending on the Break out which is gonna Happen Pretty soon.If the Price does a Bullish Break out , We can Expect the Price to Reach 0.1530$ But If the Bearish Break out Happens, The Expected Price after Completing The Movement is around 0.1250$.
-XLM is in a Symmetrical Triangle
-Price will Reach 0.1530$ in Bullish Case
-Price will Reach 0.1250$ in Bearish Case
-No break out , No confirmations!
_ _ _ _ _ _ _ _ _ _ _ _ _ _ _ _ _ _ _ _ _ _ _ _ _ _ _ _ _ _ _ _ _
Thank you for seeing idea .
Have a nice day and Good luck
ARIASWAVE - XLM STELLAR LUMENS - PRICE ACTION UPDATEIn this XLM price action update I now revert the count to another common pattern which is called a Type-1 Weak 5-Wave Move.
I still believe this is going much higher however the first leg up will likely take a little longer due to extreme bearish sentiment plaquing the markets lately.
These fractal patterns can change in their appearance but still point to one potential outcome.
At these prices it would be wise to accumulate because we may never see them this low again.
Always focus on the bigger picture.
These small degree moves just allow me to practice wave identification using AriasWave.
Check out the previous related ideas below.
Remember to use Disciplined Money Management Principles to ensure longevity as a trader.
If you don't know the long term pattern shouldn't you be doing your research instead of just following the crowd?
Just remember: I am not a financial adviser, I suggest using this only as a guide. Always do your own research.

ARIASWAVE - XLM STELLAR LUMENS - PRICE ACTION UPDATEThe price action seen at the small degree still fits in line with what I would expect to see for a Wave ii correction.
Nothing here is telling me that we should expect lower prices.
I also outline the latest count for the larger correction since May 2021.
As I mentioned in the video I will linked the video below where I outline why I believe this is the begging of a very large trend to the upside.
The reason for this is because Cryptos are very closely correlated with the stock market.
Sometime the beginning of large trends can start off choppy but they eventually get stronger and even go parabolic.
Remember to use Disciplined Money Management Principles to ensure longevity as a trader.
If you don't know the long term pattern shouldn't you be doing your research instead of just following the crowd?
Just remember: I am not a financial adviser, I suggest using this only as a guide. Always do your own research.

ARIASWAVE MARKET UPDATE - THIS CHANGES EVERYTHING!Nothing can prepare you for this analysis revelation.
For too long now I have been passing the move up since the GFC as a 5-Wave Move.
Nothing about even resembles a 5-Wave Move.
It has been bothering me for the longest time until I finally woke up and realized.
This isn't over yet. In fact it's just the beginning.
Yes I used the word fact because I have never been sure of anything else like this.
This makes sense. This is where inflation and high interest rates will take the economy.
There are so many more updates that relate to this content coming soon so be ready.
Remember to use Disciplined Money Management Principles to ensure longevity as a trader.
If you don't know the long term pattern shouldn't you be doing your research instead of just following the crowd?
Just remember: I am not a financial adviser, I suggest using this only as a guide. Always do your own research.

ARIASWAVE - XLM STELLAR LUMENS - PRICE ACTION UPDATEIn this video we will be discussing what happened a couple of hours ago on the STRUSDT chart.
I think it is interesting to see these types of moves happen especially when they line up with the waves.
The only thing that is strange is that it didn't happen on the XLMUSD chart but still gives us a taste of what's ahead.
Now that things are getting interesting is when I start to increase the frequency of my updates.
Whatever is coming will be extreme and will likely catch a lot of people off guard.
Especially those that have already lost money in this bear market.
Market sentiment is roughly at the same level as it was in March 2020.
You make up your mind, what do you think will happen next?
Remember to use Disciplined Money Management Principles to ensure longevity as a trader.
If you don't know the long term pattern shouldn't you be doing your research instead of just following the crowd?
Just remember: I am not a financial adviser, I suggest using this only as a guide. Always do your own research.

ARIASWAVE - XLM STELLAR LUMENS - PRICE ACTION UPDATETake a look at this move that just happened on the STRUSDT chart.
Here is a good example of how Wave D can make people think that it's the continuation of the trend.
That was a 70%+ pump in a matter of moments.
Just another example of how ARIASWAVE price action is readable on every degree of trend.
Now it appears more likely that we will see a bounce shortly because this can be none other than the beginning of a Wave iii to the upside.
This relates to the idea linked down below, see how this move was anticipated using ARIASWAVE before it happened.
Remember to use Disciplined Money Management Principles to ensure longevity as a trader.
If you don't know the long term pattern shouldn't you be doing your research instead of just following the crowd?
Just remember: I am not a financial advisor, I suggest using this only as a guide. Always do your own research.

Subsequent downtrend continues...For the upcoming inflation report, a further drop in the cryptocurrency may well be...
