XLM/USDT - mid term investment idea - 140%+Hello, traders!
XLM price has returned to the values of late May/June of this year. The MA100 on the daily timeframe acts as support.
Cluster and Volume analysis show growing interest in the asset from the buyers
It is possible to seek purchases in the medium and long term in case of a correction in the following ranges:
The first part of the position: $0.314 - $0.363
Second part of position: $0.241 - $0.287.
Stop-loss in case of fixing under the $0.210 price level.
It is possible to fix profit in parts in the following ranges
$0,437 - $0,470
$0,655 - $0,690
$0,740 - $0,780
The ratio of risk to profit above 4.00 👌
P.S This is an educational analysis that shall not be considered a financial advice
XLMUSD

New ATH coming
Dear traders:
It is the result of my efforts to offer a useful (I hope) presentation.
Bullish Flag Pattern.
Pump coming.
What Is Stellar (XLM)?
Jed McCaleb founded Stellar with the lawyer Joyce Kim after leaving Ripple in 2013.
Stellar is unique because every transaction costs just 0.00001 XLM.

Crypto Stellar XLMUSDT (CBDC Play is here?)View on Crypto XLMUSDT (13 Aug 2021)
XLM is back with the BANG and it does have more reason to climb IMO.
XLM has better connections with government bodies and they may be rolling CBDC coins soon.
Now, $0.275 has proven to be strong support and sooner or later, it shall touch $0.40 region soon.
Let's see.
DYODD, all the best and read the disclaimer too.
Feel Free to "Follow", press "LIKE" "Comment".
Thank You!
Legal Risk Disclosure:
Trading foreign exchange or CFD on margin carries a high level of risk, and may not be suitable for all investors.
The high degree of leverage can work against you as well as for you. Before deciding to trade foreign exchange you should carefully consider your investment objectives, level of experience and risk appetite.
The possibility exists that you could sustain a loss of some or all of your initial investment and therefore you should not invest money that you cannot afford to lose.
You should be aware of all the risks associated with foreign exchange trading,
and seek advice from an independent financial advisor.
DISCLAIMER:
Any opinions, news, research, analyses, prices or other information discussed in this presentation or linked to from this presentation are provided as general market commentary and do not constitute investment advice.
Sonicr Mastery Team does not accept liability for any loss or damage, including without limitation to, any loss of profit, which may arise directly or indirectly from use of or reliance on such information.

XLMUSD - 1W - Stellar in a huge channelHi guys,
Short review of Stellar (XLM) with a weelky TF.
We can notice Stellar is still evolving in his big ascending channel (blue).
We had several points of contact both at the top and at the bottom of the channel.
I'll be watching this one.
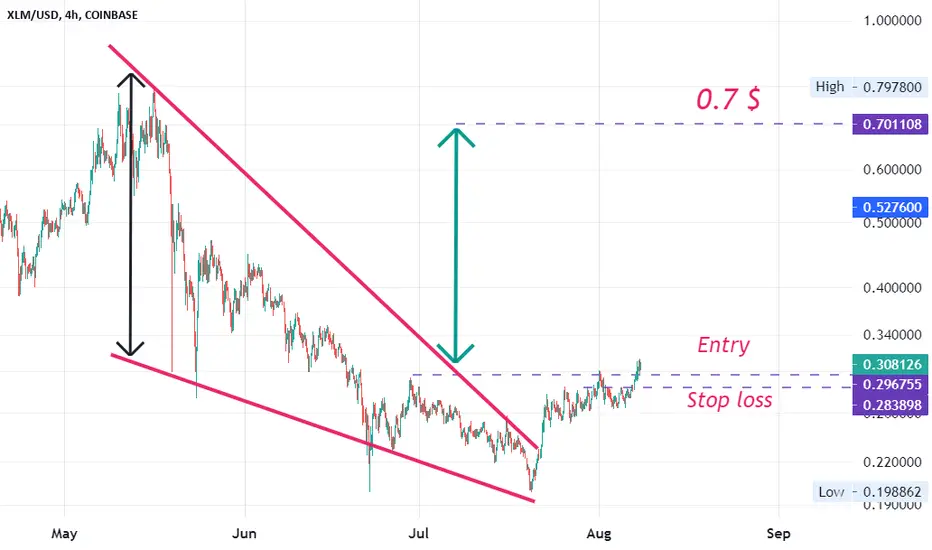
If BTC remains "calm" we can expect a further growth inside the channel.
First stop will be the former "double top" at 0.71$
After, i'll be watching for the top of the channel (red area ... depending on the time to achieve it)
Those are two zones of TP but if we broke the previous top, we could also see a kind of massive cup and handle that could send price to the moon.
Finally, RSI made a lower low while price made a higher low.
Like if you share this pov
NFA

Stellar Support at 0.33, Short Term Target of 0.4 Trend Analysis
The main view of this trade idea is on the 15-Min Chart. The Cryptocurrency Stellar (XLM) just recently broke the short term downtrend after holding support around the 0.33 price level. Expectations are for a change in trend from lower to higher, with a target of 0.40. A negation of this view will be determined if XLM were to break below 0.33.
Technical Indicators
XLM recently broke above its short (25-MA), medium (75-MA) and long (200-MA) fractal moving averages. Also the RSI is above the 50 level and has not hit overbought conditions. The KST is in a positive mode. Moreover, over multiple timeframes XLM is displaying buy signals at the time of publishing.
Recommendation
The recommendation will be to go long at market. Stop loss will be set around the 0.33 price level and a target of 0.4. This produces a risk-reward ratio of 2.12.
Disclaimer
The views expressed are mine and do not represent the views of my employers and business partners. Persons acting on these recommendations are doing so at their own risk. These recommendations are not a solicitation to buy or to sell but are for purely discussion purposes. At the time publishing, I have a position in Stellar.

GBPJPY and XLMUSDAnalysis on XLM and GJ
Entering both now. Scale in properly for those of you traders out there!

XLMUSDT (Stellar) 1D TFAs we can see, after breaking its downward trend, the price is gathering strength to start a strong climb.
In order to buy, the SL (stop loss) and capital management must be observed.
All resistances and TPs (take profits) are marked on the chart.
(DYOR)

XLM UPDATE - Corrective Patterns Repeat Time and Time Again!In this video update I explain the current price action in XLM.
If you have been following my work across the different platforms you will see how this all fits together.
Currently Wave (C) is getting ready to move higher in a third-of-a-third wave.
Once you grasp these concepts which are unique to the AriasWave methodology it will give you peace of mind.
Patience is only possible when you learn the waves otherwise it's just hope and wishful thinking.
Check out some previous related ideas linked below.
Remember to use Disciplined Money Management Principles to ensure longevity as a trader.
If you don't know the long term pattern shouldn't you be doing your research instead of just following the crowd?
Just remember: I am not a financial advisor, I suggest using this only as a guide. Always do your own research.


Just my idea about XLMThis is my view!
Lines tell everything!
I think we will move to the next resistance line, which is ~ $0.64, and after a small correction, it is possible to move to the moon!

Up Up and Away?!?!? XLMUSDHello Trading View Community,
One thing to note is RSI going into overbought zone and although XLMUSD is over the 0.236 Fib Level, it still needs to clear the rest of the local resistance zone.
Thank you guys for checking out this idea on XLMUSD. If you find this analysis useful, support with a simple "Like" or "Follow".
Trade carefully and remember these are just ideas, not trading advise

0.56 $ coming!
Hi,
Bullish,
Good, but not good enough! :)
its ( XLM ) intrinsic value is equal to 0.56 $ (in comparison with Bitcoin 28k to 45k (70% ATH ( 64k )), think it!
Just hold.

$XLM INCREASING VOLATILITYgiven the speed of the recent macd movements
there is a possibility of greater fluctuations to price moving forward
who knows where the tops will actually land
not financial advice

XLM USD LONG TERM TRIALI know this is little complicated :))
Note: Above idea is for educational purpose only.

XLM Parabolic Curve to $0.37 + ?Parabolic curves have a high probability of success, and BTC has already used one to climb up to 42K +(see attached idea of prediction)
As the graph shows, XLM seems to be forming a parabolic curve pattern which would lead Stellar Lumens to $0.37

Falling Wedge Pattern
Dear traders:
1- A Falling Wedge is a Bullish pattern.
2- A Falling Wedge is a reversal pattern.
3- In a Falling Wedge Pattern, the price target is equal to the height of the back of the wedge.
What else is new?
1- Entry Time.
2- knowing how to make money out of the different patterns.
see attached Idea.
XLM/USDT LONG OPPORTUNITYfor XLM/USDT I prefer long positions for now,
because I see there is a double bottom pattern and it has already broken out the confirmation line,
not financial advice just my opinion,
trade on your own risk

XLMUSD - The Jesus Cup Trade - I'm All The Way Up!This is an idea long time coming and more recently from my YT livestream dubbed the Jesus Cup Trade.
This is the first of 4 Trades that will yield in some pretty decent gains especially if you have been long since the lows.
In this scenario we are taking a conservative approach with these parameters:
Entry: 0.31102
Stop: 0.27849
Target: 0.79371
Risk\Reward: 15.0
Remember to use Disciplined Money Management Principles to ensure longevity as a trader.
If you don't know the long term pattern shouldn't you be doing your research instead of just following the crowd?
Just remember: I am not a financial advisor, I suggest using this only as a guide. Always do your own research.

Cup and handle long entry $XLMAnother cup and handle xlm rising back up I think by end of September we will claim back the May level 0.80 and with Flare launch and money gram purchase can see stellar Lumens above 20$

Xlm - trade for Quick 23% gains Xlm bull flag is about to breakout.
Look for quick 23% gains incoming.

Let me tell you buddy
The high price of Stellar in 2017 was $1 and this would be the 2021 target.
For more details see attached idea.
XLM vs XRP:
Now, XLM is cheaper and faster than XRP.
Jan 2021 XLM was 0.435 $ (Bitcoin was 35000 $):
Jan 2021 XRP was 0.356 $:

XLMUSD - Some Explanation Leading Into The NFP's - ARIASWAVE 101In this video I talk about waves, what's new?
The waves are the only important thing you should be observing on a chart!
Aside from the waves what else would you be looking at?
A higher high? A lower low? Indicator? Oscillator, Alligator, News, Planet Alignment, troll comments?
They are all useless.
So far no one has any good argument against proper wave analysis which you can only find here.
By the way this is just the beginning, I have only just begun to get my feet wet here.
Stay tuned.
See related ideas linked below.
Remember to use Disciplined Money Management Principles to ensure longevity as a trader.
Just remember: I am not a financial advisor, I suggest using this only as a guide. Always do your own research.
If you don't know the long term pattern shouldn't you be doing your research instead of just following the crowd?
Each video idea I post builds on the previous idea as I use AriasWave to try and navigate the waves in Crypto Markets.
