Xlmusdt

XLM forming Cup and HandleXLM is forming classic Cup and Handle pattern,so expecting bullish momentum from here.

XLMUSD forming traingle pattern, wait for a breakoutXLMUSD
price is forming a triangle like structure, if price manages to break above the triangle and if price holds above the structure, I expect the price to move higher towards next resistance. if price breaks below the support area the the setup will be invalidated
Trade Wisely
*The content on this analysis is subject to change at any time without notice, and is provided for the sole purpose of assisting traders to make independent investment decisions.

XLMUSD Near a Breakout? Stellar has poised itself like in the past above this diagonal green line
Comparable points in blue
Price may act as a falling wedge
I have seen this falling wedge on other charts for example EOS. Link to this EOS chart below

Stellar XLM - Huge dump is incoming! Falling wedge + triangle
On the daily/3D chart, we have a pretty strong bearish downtrend. We just hit a brand new low a few days ago, so it's really not looking good at all.
We can spot a triple bottom, which is usually a sign of a descending triangle pattern or a rectangle continuation pattern. There is a lot of liquidity below this level and the market usually comes for the stop losses.
The chart is printing a falling wedge and a local descending triangle. Both of them have a bearish bias until we break these patterns.
We deeply need to go down for the final fifth impulse wave to complete this ABC correction. Because otherwise, if we pump now, then this structure was an impulse and it's going to be a dead cat bounce rally, followed by another bear market below 0.026 USDT.
XLM is a great coin and I believe we will have a massive pump in 2023-2024, but for now it's still bearish and we need more confirmation to buy this altcoin.
For more analysis, hit "Like" and "Follow"!

#Stellar is down 80% from All-Time Highs; Is the Bear Run Over?Past Performance of Stellar
Stellar is firm, recovering, and up roughly five percent in the past 24 hours. At spot rates, the coin is bouncing from around 2022 lows. Specifically, XLM buyers are building on gains of September 7, rejecting bear calls. Still, despite the welcomed expansion, prices are within a bear formation.
#Stellar Technical Analysis
The August 19 bear candlestick is conspicuous in the daily chart and defines the current trend. Since the wide-ranging bar was printed, XLM prices have maintained a strong downtrend. Presently, prices have found support at around 2022 lows with hints of slowing downsides considering the series of higher highs relative to the lower BB. While bears are firm, the tide may swing to favor XLM buyers if prices close above the 20-day moving average and $0.11. The breakout would signal the end of the 10-month correction; thus, the leg up ought to be with rising trading volumes. If this pans out, XLM may rally towards $0.13. Conversely, sharp losses below July 2022 lows at $0.097 will reaffirm bears, forcing XLM towards $0.069 in a bear continuation pattern.
What to Expect from #XLM?
The coin is down 80 percent from May 2021 highs. After such heavy losses, XLM buyers may find relief if prices expand above $0.11 in alignment with the gains of September 7. However, should bears continue to dig in, XLM could slump to new multi-month lows.
Resistance level to watch out for: $0.11
Support level to watch out for: $0.097
Disclaimer: Opinions expressed are not investment advice. Do your research.

XLM quick profit long possition I like to buy now (not the best entry, should have purchased it way lower a few days ago) at or under 0,104$ with SL close set at 0,1$ and a TP at 1,12$. NFA


stellar xlm price prediction 2022my stellar xlm price prediction 2022, i am long but after a long range

XLMA strong downtrend, then a stop, without a significant pullback, a descending rectangle was formed.
The tool will go below. Two entry points, a rebound from the level of 0.13 or a breakdown of 0.1, then a retest of this level and down, the potential of the move is 30%.

XLM PRICE ACTION - The Update You Have Been Waiting For!!!This video is the result of hours of analysis conducted by myself and one of my members mentioned in the video.
I performed a training session which not only helped him immensely but it also helped me identify the flaws in my analysis.
I think this is a great way to improve by helping others at the same time. It's a win win.
So it appears as though the pain has only just begun for the markets and we are unlikely to see any new all-time-highs until this large corrective wave is over.
There is absolutely no way of knowing how high the rest of this small degree correction will bounce but I can and will be tracking this extensively.
I believe there will soon be a perfect time to short sell XLM and other Cryptos.
This is an amazing turn of events for what started off as sharing my thoughts and ideas to now taking advantage of networking with other people to improve analysis and profits.
Remember to use Disciplined Money Management Principles to ensure longevity as a trader.
If you don't know the long term pattern shouldn't you be doing your research instead of just following the crowd?
Just remember: I am not a financial adviser, I suggest using this only as a guide. Always do your own research.

GOLD 6H TA; TrendLine PullBackIn gold analysis, according to the chart, after breaking the trend line, we are correcting and pulling back to this trend line. If the pullback is completed, we expect the price correction to the support areas, and otherwise, with the return of the high price.
Its not Buy or Sell SIGNAL
DYOR
BY : Mohamad Teriz - @AtonicShark


XLMUSDT 1W Complete trading history for 8 years and what next?Before you is the longest trading history of XLMUSDT
Someone may think that this review is timed to the hype news that Robinhood can be listing XLM on its site.
But no, this review is timed to the 8th anniversary of the trading of the XLMUSD pair.
It was at the beginning of August 2014 trading of the XLMUSD pair started, or on some crypto exchanges they marked STRUSD (only those who have been on the crypto market for many years know about this, now you know too :)
Now many users are expecting a shot of the XLM price
But we would be careful with expectations of super growth, because the reality may be different.
Yes, now the XLMUSDT price can break up to $0.165-0.17. Further, adjust to $0.12 and if the price is firmly fixed above $0.12 - then strong long. But you have to understand that it can be a long-term investment.
But you have to be careful, it's more about us, because the chance that the XLMUSDT price can still fall to $0.075 is quite high, and buying there would be a very profitable deal.
Summarizing:
- If you have already bought Stellar, then you can expect growth to $0.17, maximum to $0.2 and further correction. Also keep a short stop on the position.
- Safe entry into the long XLMUSDT position after fixing the price above $0.12. Growth targets are $0.2 and $0.35
- A very conservative entry into the position is to place a buy order XLMUSDT at $0.075 and wait for a lucky price spill
_______________________________
Since 2016, we have been analyzing and trading the cryptocurrency market.
We transform our knowledge, trading moods and experience into ideas. Each "like under the idea" boosts the level of our happiness by 0.05%. If we help you to be calmer and richer — help us to be happier :)

XLM/USDT 4H chartXLM/USDT 4H chart
wait for pullback till 0.108 dollar and wait for rejection then it can continue his but run

Stellar Lumens waiting for a pullbackAfter breaking through a diagonal resistance line, the price is testing another diagonal mini resistance.
I would expect a return on the support in red for a good entry, unless it gives indications that it won't go back there anymore.

what do you think about my position???hello guys
i got this position last few days ago, and free risk it now but i have a long tp zone about 0.085
what do you think about my reward zone? it is too much?

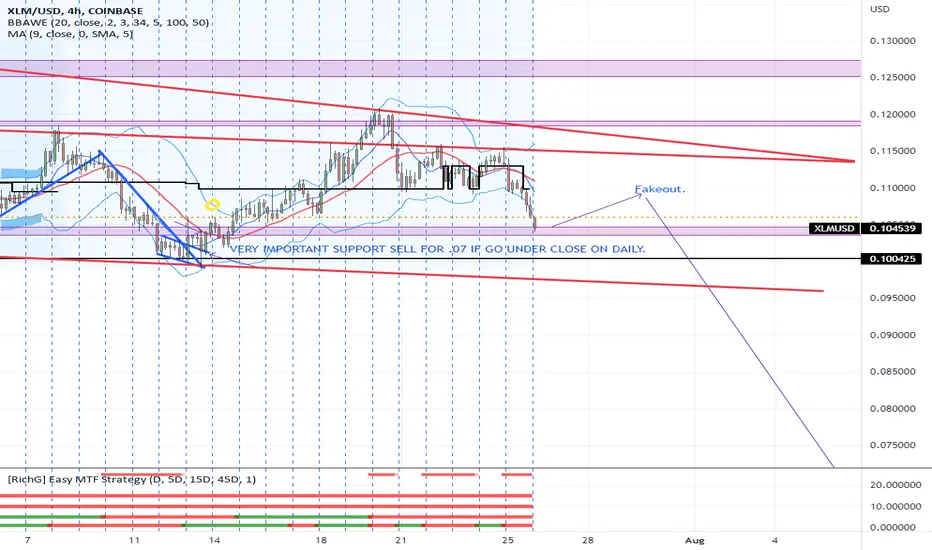
XLM not looking goodXLM picked up no steam on ETH pump, ETH sentiment looks bad now XLM could drop to .07 from here, as sad as it is this is the time to be selling, ill be selling ATLEAST half of my positions on this small supportive bounce, I think this support will be invalidated and we could test lower to levels of .09 first then to .065. A move above the supportive red line would invalidate the bearish scenario
XLMUSDT Short-term upward movementHello guys
This currency has stop-hunt that level and confirmed a possibility of a short upward movement to the bearish trend line, but as you can see in the weekly timeframe image, it needs to downward to the price range of 5.7-8.5 cents, and that area has potential to start the growth of this currency.
In the future, this analysis will be updated.
follow me please and like this post.
thanks for your attention!

Stellar XLM short Entry Range, Take Profits and Stop LossXLM/USDT short
Entry Range: $0.110 - 120
Price Target 1: $0.098
Price Target 2: $0.0.092
Price Target 3: $0.080
Stop Loss: $0.129
previews short

Stellar Bulls Surging, XLM Prices May Retest $0.13Past Performance of Stellar Lumens
Stellar Lumens prices are rallying and syncing with the broader market. The coin is stable on the last trading day but trending above a multi-month resistance trend line traced to April 2022. As the XLM prices bottom up, traders may find opportunities to ramp up in lower time frames.
#Stellar Lumens Technical Analysis
XLM prices plunged 88 percent after peaking at $0.75 in May 2021. Currently, the coin is up 16 percent from 2022 lows, and buyers are in control, reading from the candlestick arrangement in the daily chart. As price action takes shape to favor buyers and prices break higher above the critical resistance level, traders may search for entries on dips, targeting $0.13 in the medium term. This preview, however, is only valid if prices are steady above $0.10. Any breach below this reaction point may force XLM towards $0.09 or worse in a bear continuation formation.
What to Expect from #XLM?
The bounce to spot rates is refreshing for token holders and may find the base for another leg up towards $0.17 and Q1 2022 lows. Still, the rapidity of the uptrend will highly depend on if there is confirmation of July 18 gains and the level of trader participation. Any expansion in trading volumes with rising prices could signal strength and buyers taking charge after months of lower lows.
Resistance level to watch out for: $0.13
Support level to watch out for: $0.10
Disclaimer: Opinions expressed are not investment advice. Do your research.

XLM: Expecting good bounce after the breakout!!Hi guys, This is CryptoMojo, One of the most active trading view authors and fastest-growing communities.
Do consider following me for the latest updates and Long /Short calls on almost every exchange.
I post short mid and long-term trade setups too.
Let’s get to the chart!
I have tried my best to bring the best possible outcome in this chart, Do not consider it as financial advice.
BUY XLM/USDT ON SPOT
XLM is making this falling wedge pattern
If you average- use below 5x
Entry range:-$0.093to $0.1
Target:- 50%
SL:- If any candle close below the lower support of this wedge pattern
This chart is likely to help you in making better trade decisions if it did consider upvoting this chart.
Would also love to know your charts and views in the comment section.
Thank you

Xlmusdt looking for longs.....If this setup unfolds I will be going in for nice longs....1:2.83R which becomes 1:4R on scale-in.
Like and Subscribe.
