XLM/USDTesting/tracking elliot wave theory. Please do not trade off idea without S/L. Not financial advice.
The bottom looks like it's in. I can still see another leg down tho (C) wave shows another leg down to 0.05 area. This scenario is not likely to come, but never say never.
How I would trade this: Buying now and adding on the way down if it goes. We call this method laddering down or dollar cost averaging.
Once again, not financial advice.
Risk/Reward: 17.5
People say never go in on trades if RR ratio is not around 3...
This is huge.
Xlmusdt

#Stellar Lumens Bearish, XLM Primary Support at $0.10Past Performance of Stellar Lumens
Like the rest of the crypto market, Stellar Lumens remains within a bear trend. Despite recent gains, there are clear lower lows in the daily chart. At spot rates, XLM is down roughly five percent as bears reverse last week's gains.
#Stellar Lumens Technical Analysis
The XLM coin is bearish at spot rates, with upsides limited at $0.13, last week's highs. Notably, prices are below the June 23 and 24 trade range with rising trading volumes over the past few days suggesting increasing liquidation pressure. Still, XLM bulls are optimistic about recovery if prices are above $0.10, June's 2022 lows. Risk-averse traders can wait for a clean, high volume breakout above $0.13 to load on dips targeting $0.15. Conversely, deep losses below $0.10 may see XLM slide deeper towards $0.09, a February 2020 reaction point.
What to Expect from #XLM?
At spot rates, XLM is retesting Q3 2022 highs, and price action is skewed for sellers. If bears take charge, further losses below $0.10 may see the coin slip to print multi-month lows.
Resistance level to watch out for: $0.13
Support level to watch out for: $0.10
Disclaimer: Opinions expressed are not investment advice. Do your research.

XLMUSDTHello Crypto Lovers,
Mars Signals team wishes you high profits.
This is a one-day-time frame analysis for XLMUSDT
Obviously in our chart, There is R2 area which used to be a support area and the support of the price at several points is clear in it. R1 is a resistance line and resembles the disability of the price to rise. And S1 and S2 are our support areas which express the support of the price at some points. Now we can see the fluctuation of the price on R1 and due to the weakness of the trend, we expect the price to fall to S1. By reaching this point, our expectation would be a rising trend to R1 and in case it fixes over R1, we will predict more rise for it toward R2. But if it loses the support and moves below S1, it will have more decline down to S2.
Warning: This is just a suggestion and we do not guarantee profits. We advise you to analyze the chart before opening any positions.
Wish you luck

Stellar vs Tether Long-Term (538% To All-Time High)Hello my fellow cryptocurrency trader, let's look at Stellar today long-term.
First, let's review the past...
Stellar vs Tether, XLMUSDT, went through a very strong bull market from March 2020 to May 2021.
Through this date, XLMUSDT went to print a massive 2965% of growth.
That is from the March 2020 All-Time Low/bottom, to the May 2021 All-Time High.
After the ATH, we've had over 400 days of bear market/correction.
Last week XLMUSDT closed with a reversal candle and a new multi-year low.
Hitting its lowest level since November 2020.
With the RSI oversold; sitting at its lowest ever since 2018, we can expect a reversal to start taking place and a bullish wave to come next.
We are mapping 125% short-term.
Over 535% long-term to the All-Time High.
And much more on the next Altcoins market bull-run.
Namaste.

XLMUSDT TECHNICAL ANALYSIS The Stellar Development Foundation (SDF) has launched a $30 million matching fund for early-stage companies building on the Stellar blockchain.
The fund is a branch of SDF's Enterprise Fund, the firm's venture arm investing in startups within the Stellar ecosystem. It plans to match investments up to $500,000 from the lead funding source. The idea is to boost funding to early-stage companies in jurisdictions that could benefit from blockchain-powered solutions.
"The Stellar ecosystem is working to address challenges like inflation, affordable remittances, and the high cost of capital — and we’re investing in solutions to these problems through the Matching Fund," said Senior Director of Investments Andrea Lo in a statement. (March 15th, 2022)
This was the fundamental analysis. How about technical analysis?
Stellar has been lost value approximately 90% since May 2021. Is it time to buy?
We have received BUY 2 signals from our robo advisor @EngineeringRobo and our Risk/Reward Ratio is 1. The candle already breakout down trendline and if current candle open close above to down trendline, it may an opportunity for buy. MA 20&50 hasn’t changed direction yet in daily time frame. When MA 20&50 change direction, we will have one more opportunity to for buy. Also, If candles breakout MA 50 line and next candle open close above to MA 50 line, it will be another opportunity for buy.
Let’s follow our chart together and don’t forget to follow me.
“NFA”

XLMUSD - 1W - Wait for the end of this falling wedgeHi guys,
on the weelky timeframe we can notice Stellar (XLM) is in a giant falling wedge pattern. This is usually a pattern leading to an upside move.
We can't ignore the red path as bitcoin and macro are not at their best at the moment. Bitcoin still on the edge of further downside.
However, if things can get better for crypto, we can imagine (and pray) for the green path.
then first target would be the 0,47$ (strong resistance and ichimoku level on the monthly / daily)
then second target is the top of the falling wedge which is also the previous ATH (weekly close) at 0,70$.
This could form a giant cup and handle. If and only if we have a strong break to the upside with a strong candle close :)
if this cup and handle is confirmed the targets will be awesome.
But dont get excited too quickly there are still many targets to achieve first.
If you agree, please feel free to like this idea :)
Bye guys
NFA

Stellar Goes Bullish Long-Term (100% to 190% Potential Targets) Notice the blue down-trendline on this pair, XLMBTC.
We can see prices moving above this trendline this week, breaking a major downtrend.
We have a long-term higher low (since December 2020).
A very strong RSI (55-Weekly).
The MACD going bullish.
We can also appreciate prices moving above EMA10 and EMA50.
The blue square at the bottom is our support.
This is where we set our stop-loss.
More details on the chart (targets).
Namaste.

XLMUSD is about to pop after hitting absorptionTesting out some new things and Wanted to document this. I think by the end of the blue line at the bottom price should pop signifying it has hit absorption. Pull back into 7 for the final dip into liquidity and then pop again right at the vertical line after 7. This will be its move out side of this box it has created with the price action and the move for profits.
by iCantw84it
05.28.22

Stellar (XLM)- June 14hello?
Traders, welcome.
If you "follow", you can always get new information quickly.
Please also click "Like".
Have a good day.
-------------------------------------
(XLMUSD 1W Chart)
Below 0.124080 is likely to be a mid- to long-term investment area.
Therefore, the key issue is whether it can rise above 0.124080 to receive support.
(1D chart)
In the short-term and medium-term perspective, it needs to rise above the 0.124080-0.132063 section and find support to turn into an uptrend.
However, since a volume profile section is formed around 0.164204, it can be said that it is completely converted to an upward trend only when it rises above this point.
------------------------------------------------------------ -----------------------------------------------------
** All indicators are lagging indicators.
Therefore, it is important to be aware that the indicator will move accordingly as price and volume move.
However, for convenience, we are talking in reverse for the interpretation of the indicator.
** The MRHAB-T indicator used in the chart is an indicator of our channel that has not been released yet.
** The OBV indicator was re-created by applying a formula to the DepthHouse Trading indicator, an indicator disclosed by oh92. (Thanks for this.)
** Support or resistance is based on the closing price of the 1D chart.
** All descriptions are for reference only and do not guarantee a profit or loss in investment.
(Short-term Stop Loss can be said to be a point where profit and loss can be preserved or additional entry can be made through split trading. It is a short-term investment perspective.)
---------------------------------

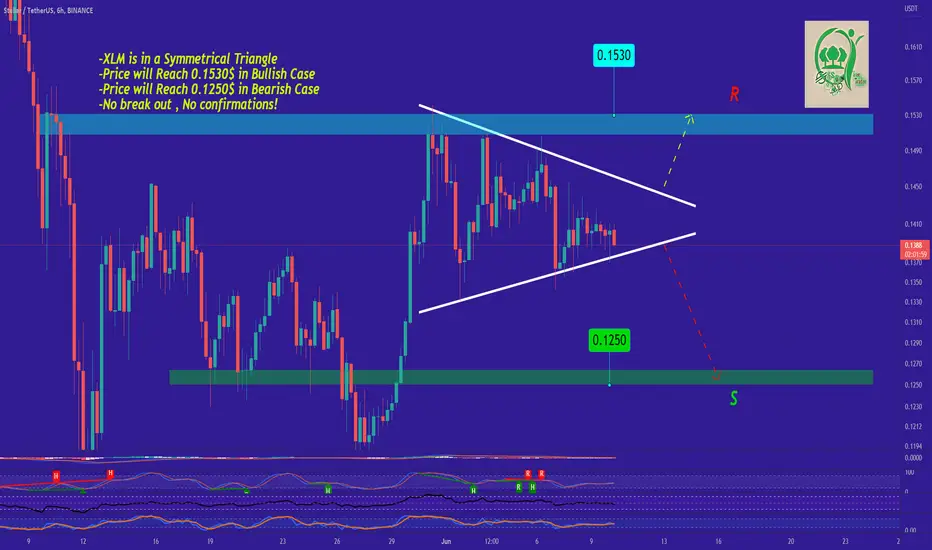
XLM Expected Movement ExplainedStellar is in a Symmetrical Triangle which means the Price can Do a Bullish and a Bearish Movement Depending on the Break out which is gonna Happen Pretty soon.If the Price does a Bullish Break out , We can Expect the Price to Reach 0.1530$ But If the Bearish Break out Happens, The Expected Price after Completing The Movement is around 0.1250$.
-XLM is in a Symmetrical Triangle
-Price will Reach 0.1530$ in Bullish Case
-Price will Reach 0.1250$ in Bearish Case
-No break out , No confirmations!
_ _ _ _ _ _ _ _ _ _ _ _ _ _ _ _ _ _ _ _ _ _ _ _ _ _ _ _ _ _ _ _ _
Thank you for seeing idea .
Have a nice day and Good luck
Subsequent downtrend continues...For the upcoming inflation report, a further drop in the cryptocurrency may well be...

Stellar Lumens XLM Is Using The Support Of Previous TriangleHi friends, and welcome to the new update on Stellar.
Big wedge and key support:
On a weekly time frame, XLM has bounced from the key support of $0.12 and the support of a big falling wedge pattern. This move can also be seen on a monthly time frame.
After breaking out this wedge the next move can be up to $0.75, which is the top of this wedge. Before this XLM had already broken out a big channel as well.
Symmetrical triangle and external supports:
On a 4-hr time frame, Stellar has broken down a symmetrical triangle. But it has still a down trendline support and the previous triangle's support is also still in play. Therefore,
there is a probability, that XLM will breakout the resistance of the triangle using these supports. After the breakout XLM can also break out the next resistance of $0.154.
Conclusion:
Even though Stellar has broken down the triangle but some external supports are in play therefore, there is a possibility that stellar will breakout the same triangle whcih is broken down.

XLM - Target ReachedWelcome Back,
As we discussed XLM trade setup earlier, Target - 1 has been triggered. Start booking profits and also adjust your stop loss. And don't forget that from target-1 to final target in this range manage your trade actively and reduce your position accordingly.
New StopLoss : 0.14458 ( around breakeven point )
Conclusion : Observing current market condition yea it's perfect trade. But currently many oscillators like RSI show undervalue so i think there might be small upward moment before going to final target and not a trend change for sure but keep on reading market everything changes within no time. Be active.
Disclaimer : Anything Provided here is not a financial advice

XLMUSDT Failing to break the 1D MA50.*** ***
For this particular analysis on STELLAR we are using the XLMUSDT symbol on the Phemex exchange.
*** ***
The idea is on the 1D time-frame where Stellar Lumen has been consolidating since its May 31 short-term High, which is still a Lower High within the Channel Down pattern that started in November 2021 and more importantly having failed to break above the 1D MA50 (blue trend-line), which is technically the short-term Resistance.
This is familiar ground for Stellar inside this pattern as every time the RSI entered the 55.00 - 60.00 Zone, the price got rejected on the 1D MA50. As a result, until proven otherwise and a 1D candle closes above the 1D MA50, the price remains bearish within the Channel Down towards the the 0.10400 Low and in extension (upon 1D candle closing below) the -0.382 Fibonacci extension level.
On the other hand, if Stellar does close a candle above the 1D MA50, we can take a short-term break-out buy trade targeting the 1D MA100 (green trend-line). A buying extension on the long-term can only be sustainable if the 0.786 Fibonacci retracement level breaks (0.2017 currently), which within the Channel Down has never been broken during a Lower Highs rebound. If that happens this time, then it would mean a price break-out above the 1D MA200 (orange trend-line) too, which is unbroken for the whole 2022.
--------------------------------------------------------------------------------------------------------
** Please support this idea with your likes and comments, it is the best way to keep it relevant and support me. **
--------------------------------------------------------------------------------------------------------

XLM Short Setup2 Scenario For Short Position with 3TPs
Max Lev. 5x So you will Have a chance of +40% Profit or -15% Loss (R/R ~ 3 which is great)
So Stick to the plan and Put Your Entry Levels Equal to Each Other (1 or 2% of your total Budget)

Pattern trade setup - XLMWelcome Back,
New day - New trade setup , After a huge downward rally cryptocurrencies are up on an average 4% to 5% today , something like a relief rally !! Ok but here I'm gonna share my trade setup for XLMUSDTPERP , It's forming symmetrical triangle pattern which is also a continuation pattern , no one know in which direction the breakout occurs but according to current market sentiment it is likely to break upwards. I'm gonna enter once it test the breakout successfully.
Key Levels to watch :
Upward Breakout
entry range : 0.14945 - 0.15029
Target - 1 : 0.15598
Final Target : 0.16948 ( consider below this level )
Profit booking range : 0.15598 - 0.16948
For Downward breakout I'll update if the current scenario changes.
Disclaimer : Any information provided here is not a financial advice, trade at your own risk!

#XLM/USDT 30M CHART UPDATE !!Welcome to this quick XLM/USDT analysis.
I have tried my best to bring the best possible outcome in this chart.
Reason for trade:- XLM is trying to break the major resistance of the $0.15-$0.155 area. The support is $0.140-$0.142 area and we see a retest of this area. You can try to add some XLM near the support area with tight stop loss.
Remember:-This is not a piece of financial advice. All investment made by me is at my own risk and I am held responsible for my own profit and losses. So, do your own research before investing in this trade.
Sorry for my English it is not my native language.
Do hit the like button if you like it and share your charts in the comments section.
Thank you...

Stellar XLM short Entry Range, Take Profits and Stop Loss XLM/USDT short
Entry Range: $0.13 - 0.16
Price Target 1: $0.11
Price Target 2: $0.0.08
Price Target 3: $0.06
Stop Loss: $0.17

Stellar (XLM) formed bullish Gartley for upto 2460% rallyHi dear patrons, hope you are well and welcome to the new trade setup of XLM.
On a monthly time frame, XLM has formed bullish Gartley pattern.
Note: Above idea is for educational purpose only. It is advised to diversify and strictly follow the stop loss, and don't get stuck with trade

XLM situation Right nowXLM is in a Symmetrical Triangle and we can Be Sure of Big Movements Soon. Since No Break out Has Accrued Yet. we can Not Determine The Price Movement Yet. But It will happen soon because The chart is in Small Timeframe(4h) So we can Come To a Conclusion Pretty Soon. In Bearish Case Price Will Reach 0.115. In Bullish Case Price will reach 0.15$.
-XLM is in a Symmetrical Triangle
-No Break out
-(4h Time Frame)
-Bearish=0.115$
-Bullish=0.15$

#XLM/USDT BEST ENTRY GREEN ZONE AND 35% PUMP AND STF !! !Welcome to this quick XLM/USDT analysis.
I have tried my best to bring the best possible outcome in this chart.
Reason of trade:-XLM/USDT symmetrical triangle pattern conforms and break the upper trend line and retest buy the green zone.
Entry:-$0.13280,$0.13575
Traget:- 35%
Stoploss:- $0.12830
with laverage 5x to 10x
Remember:-This is not a piece of financial advice. All investment made by me is at my own risk and I am held responsible for my own profit and losses. So, do your own research before investing in this trade.
Sorry for my English it is not my native language.
Do hit the like button if you like it and share your charts in the comments section.
Thank you...

#XLM/USDT 1DAY UPDATE BY CRYPTOSANDERS !Welcome to this quick XLM/USDT analysis.
I have tried my best to bring the best possible outcome in this chart.
Reason of trade:- XLM//USDT PARALLEL CHANNEL brake the green and trandline and buy the retest green zone. PARALLEL CHANNEL green zone. (SPOT CALL)
Entry:-$0.11000,$0.12745
Traget:- 70%
Stoploss:- $0.09924
Remember:-This is not a piece of financial advice. All investment made by me is at my own risk and I am held responsible for my own profit and losses. So, do your own research before investing in this trade.
Sorry for my English it is not my native language.
Do hit the like button if you like it and share your charts in the comments section.
Thank you...

XLMUSD Updated View 5/22/22We can view two periods of upward movement in the first bull market
This can be correlated to the current market state of a retreat from the 'first up move'
Following this up move as per the prior bull run another bull run comes 'second up move'
We just haven't seen enough growth as of yet to call the bull run completely over
