Xlmusdt
XLM the sweetest optionXLM
So if we are doing this mid October 17 fractal area idea and move it over to XLM it looks like this. And funnily enough it looks pretty bloody similar overall.
If ol Jed pulls this one off. Sheesh. I wouldnt underestimate him or the dynamic duo that is xrp/xlm. but xlm is xrp without the shady shit. plus Jed has been harvesting all those unlimited xrp gains for the last bloody 10 years or whatever it is now. Dude is low key able to buy whole countries at this point.
I am loaded in case this happens. I've been wrong twice now on this one. 3rd times a charm baby.
x


XLM: do something alreadyA few days ago i’ve posted an imverse HnS on IOTX, today it skyrocketed.
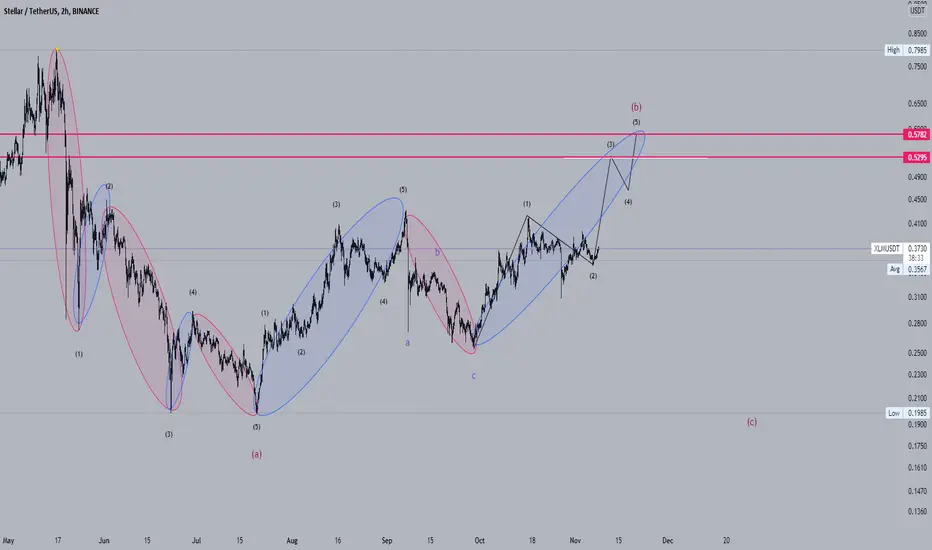
I’m gonna leave this here just in case

Stellar Future Expected. As you know, Stellar, one of Europe's major crypto projects, crashed with the hard fall of bitcoin. We will hear positive news soon. Confidence was restored with bitcoin breaking records. What I want to tell you is that nothing stays cheap.
The population continues to increase.
Inflation continues to rise.
Central banks continue to print money.
Technology continues to evolve.
The internet continues to age.
Most importantly, X,Y,Z, and subsequent generations support crypto full-time.
Gold is still a safe haven.
But Crypto is a Fast port. It is active 24/7.
It does not need any bank.
There are low commission fees.
Not investment advice.

XLM - Future Projection SeriesIf you’ve read any of my previous “Future Projection” posts, skip down to the conclusion as these paragraphs are the same.
During the downturns in the market I spent time learning more about utilizing the charting functions in TradingView. I also watch a lot of youtube vids about crypto and charting concepts. I came across a good chunk of info on using the “log” function and what it could possible show me.
At this point in the crypto cycle, even though I feel we are nearing a parabolic stage, it is beyond the point to expect 50X or more from me or any basic Joe who “dabbles” in crypto investing. Think long term. What can I realistically (if that even exists in Crypto) expect a coin to perform in the next bull run. Well the log function gives me a level playing field to do just that.
Using the log function, I utilize a common start date as the beginning of my parallel channel. That date is the big drop Mar/20. The parallel channel runs from the bottom of the Mar/20 drop forward in time along the bottom dips. The top of the channel is the highpoint in the cycle.
The first future projection is created using the green trend lines, the first from the top of the cycle peak to the bottom, and another from that lowest point up forward in time to what I estimate as the timeframe for top cycle which approximates end of Q4, and my birthday Jan/7 so thats the future date for all graphs in this series.
The second future projection takes ratio’d growth into consideration. This is done using the blue trend line which starts at the first peak after the Mar/20 drop, using the top of arcs as the guidance. I carry this line forward to Jan/7.
Conclusion; At the time I drew this one the price was $0.38
First Projection $2.28
2.28 / 0.38 = 6 X
Second Projection $8.18
8.18 / 0.38 = 21.5 X
Now for a regular old fellow such as myself, a 6 to maybe 21 X on my money within the next few months is a good investment. It literally involves 2 trades. Timing is not a great big deal as long as you get in near 0.38 otherwise the X factors changes a lot. Timing to get out is the top of the curve. This is a day time factor. It’ll be “at the top” for days or a week. You’re not chasing a pump or a knife here, its a month(s) trade. Or a parabolic week so watch close.
I’ve done this for a lot of coins now and the results are sometimes very interesting in that, a popular coin just doesn’t have the numbers or that it really has good numbers. I found as an average I like results in the 5 or above range for the first projection and 15 or above for the second projection. If I utilize this investment concept and choose coins with similar numbers I can reasonably expect a 10-15 X overall. I’ll post a few others I find interesting for this bull run in the coming posts.
My thoughts, not advice Oklah. Cheers

XMLUSDTI am waiting for confirmation of Uptrend.
I put the limit order at 0.4330, and my target is OB at 0.64 with a stop at 0.3.

$XLM Stellar looks up higher! Stellar Lumen $XLM
Stellar’s cryptocurrency, the Stellar Lumen (XLM), powers the Stellar payment network. Stellar aims to connect banks, payment systems, and individuals quickly and reliably.
In range now and good to add to your portfolio IMO.
Let me know what you think!
DYOR and take profits.

XLMBTC NEAR BREAKOUTOnly when this pattern breaks to the upside will we truly see the real XLM run! Comment your thoughts!

XLMUSDTHello Crypto Lovers,
Mars Signals team wishes you high profits.
We are in a 4-hour time frame.
As you can see, the price has started to move up after hitting the support line that we had drawn, and now the price is fluctuating on the resistance line.
We expect that after breaking and stabilizing above the resistance line, it will be able to move towards the target we have identified.
Warning: This is just a suggestion and we do not guarantee profits. We advise you analyze the chart before opening any position.
Wish you luck

XLM UPDATESXLM price has been trading under a stiff resistance barrier for roughly nearly three months. However, the recent run-up suggests that Stellar is ready to take on this barrier. Doing so will catalyze a massive bull run, propelling the altcoin higher.


XLM INVERSE HAED AND SHOULDERS DAILYInverse Head and Shoulders playing out in the last couple of months, price target is at 0.60. I suspect a parabolic move once that level is breached! Share and comment your thoughts!

XLM UPDATEXLM price is resuming the recovery momentum from two-week troughs of $0.309, snapping Saturday’s brief pullback.
Stellar price is higher by 6% on the day, currently trading at $0.3640, shrugging off the mixed performance across the crypto market.

XLM silence before the storm?XLM is a very quiet project, it continues its calm trend, despite great fluctuations in the market, it shows remarkable resistance to the influence of BTC. As you can see, XLM needs more time to show a strong uptrend


XLMWe could get an impulsive 5 up soon, XLM has broken out of the triangle and appears to be done correcting. As long as BTC plays nice we should get 5 up back to ATH soon.

ascending wedge on 1H timeframe for XLMUSD chartHi Everyone! Short term trade detected. Despite on global bullish picture on senior timeframe for xlmusd , i think price can test dynamic descending trendline which was broken out couple weeks ago (yellow on the chart) or global ascending trendline (red) if bears will be more aggressive. We see on 1H timeframe ascending wedge pattern which signals about local bearish sentiment. But it can be also another bear trap and a lot depends on the movement of the bitcoin price, so don't forget about risk management.
For longterm i'm very bullish about xlm .
Entry: after breaking out support line. TP 1: 0,3150. TP 2: 0,2970.

Waiting for an bullish movement in LTCAfter a lateralization of the currency, XLM is leaving setup after retesting the local poc. We can expect an explosive move in the short term if we manage to overcome the marked area of the previous triangle.

XLM OBSERVATIONStellar price is testing the green ascending trend line that acted as backbone for the uptrend since the beginning of October.
XLM price looks to be making a false breakout, a bear trap, that could see large buy-side volume resulting in a bullish recovery and breakout.
Expect a quick break above $0.41 towards $0.46.

XLM breakoutStellar broke up this triangle 📐 and I think there is chance for run to 0.943 and even higher. Just bought this local range breakout. XLM let's go!🚀
ENTRY : local high @ 0.370
SL : local low @ 0.319
TARGETS : 0.519, 0.610, 0.943
RRR : 2.9 TP1, 4.7 TP2, 11.3 TP3
INVALIDATION : when SL level hit
Check my other stuff in related ideas.
Please like👍, comment🗣️, follow me✒️, enjoy📺!
⚠️Disclaimer: I'm not financial advisor. This is not a financial advice. Do your own due dilingence.

XLM Daily Price ChartThe daily chart shows the XLM price is above the 50 DMA at $0.34 and the 100 at $0.33. However, Stellar is glued to the longer-term 200-day average at $0.36. Furthermore, the Relative Strength Index (RSI) is rolling over which suggests bearish momentum is growing. Taking that into consideration, it’s likely that XLM will lose the support of the 200 DMA and slide to the concise averages below. As long as the price holds above the 100-day it’s in with a chance of recovery. However, below $0.327 a trip to $0.255 looks probable. On the other hand, a bullish scenario emerges if the price clears the September high at $0.439. In that event, a run to $0.500 is likely. For now, it’s unclear which scenario will play out. On that basis, I maintain a neutral stance until the technicals provide a clear sign.
Feel free to get in touch for daily trade signals and alerts

Stellar Lumens vs Tether Chart Analysis (XLMUSDT #10)Here we go again and now you will understand why I didn't chart USDT pairs in the past.
XLMUSDT (Stellar Lumens) has the same chart as LINKUSDT and TRXUSDT, these two were just published in my profile minutes ago.
In fact, the XLMUSDT is also the same chart as OMGUSDT the only difference is that OMGUSDT is more advanced, moving ahead.
Since the entire market is linked/connected, the rest are very, very likely to follow and thus we are bullish on all these coins.
To proof my point (last time I promise):
We have the strong drop 7-Sept.
Notice the correction from May to July and the bullish wave that followed.
Right now prices are above MA200 (black line on the chart), just a little more consolidation and it can go into bullish continuation.
If prices break below the colored lines (EMAs), the bearish gain some strength but the bulls are still in control since we are trading within higher lows.
If the last low breaks, we can say the bears are back on top.
Any other trading, retraces/corrections/price swings, aren't really important in the long run.
My view is that we will grow for years.
The Altcoins will be growing for years... If you go further back, you can see what I mean by higher lows:
Remember to hit LIKE.
Remember to bless me with your FOLLOW.
Comment also.
Thanks a lot for your continued support.
Namaste.
