Xlmusdt

XLMUSDT LONG Entry positionsBINANCE:XLMUSDT
On march 28 Stellar presented a volume candle which was obvious on H1 and H4 time frames.
after that price was gained momentum and broke the 0.43000 level with a sharp shift candle .
As this idea publishes, we are looking for a long entry at 0.44000 pullback level or 0.47000 shift candle breakout.


XLm/USDT Again booked huge profit guys and congrats#XLM/USDT profit update:-
Entry:- $0.4 ✅
TP1:- $0.416 ✅
TP2:- $0.425 ✅
TP3:- $0.435 ✅
All Targets hit.
Congrats for profit.
Now another good entry.
Entry:- $0.436-$0.44 ✅
TP1:- $0.4460 ✅
TP2:- $0.46 ✅
TP3:- $0.47
Congrats guys all Trade is successful.
We booked profit two time in $XLM/USDT
Please click LIKE button and Appreciate my hard work.
Must follow me for latest crypto reap time updates.
Thank you.
I booked profit guys.

XLMUSD - 1D - Stellar close to something big ?Stellar has been quiet since mid february.
It seems to be in a huge falling wedge on a daily TF.
The wedge is (at the moment) close the his end
+ We are touching the bottom of the ascending channel
+ Bollinger bands getting really tight.
+ Volume is really low.
Expecting a move soon.
If this breaks upward, target is @ about 1.10$. Just buy the breakout with good volume for a 187% gain in days / weeks
If BTC keeps bleeding... well this is not good
DYOR

XLM/USDT All Targets hit and Now ready for another new entry#XLM/USDT profit update:-
Entry:- $0.4 ✅
TP1:- $0.416 ✅
TP2:- $0.425 ✅
TP3:- $0.435 ✅
All Targets hit.
Congrats for profit.
Now another good entry.
Entry:- $0.436-$0.44
TP1:- $0.4460
TP2:- $0.46
TP3:- $0.47
Stop Loss:- I will update if exit
Please click LIKE button and Appreciate my hard work.
Must follow me for latest crypto reap time updates.
Thank you.


Stellar is breaking resistance xlm 4hrsStellar needs to keep 0.41 the price To continue the uptrend
After maintaining the price of 0.41, target 44 will be activated ...
If the price breaks 0.44, the targets will be activated 0.46, 0.50, 0.52, 0.60 and 0.70, respectively I expect to touch the price of 0.70 channel ceiling

XLM/USDT Scalping TA Update LTF#XLM/USDT TA Update:-
$XLM currently trading at $0.411 and strong support at $0.4
So I am buying some $XLM here.
Entry:- $0.4-$0.41
Targets:- $0.416/$0.425/$0.435
SL:- $0.402
Please click LIKE button and Appreciate my hard work.
Must follow me for latest crypto real time updates.
Thank you.

XLM/BTC Ready for take off...moon mission#XLM/BTC TA Update :-
#XLM/BTC currently trading at 690 Satoshi
And I am buying here some #XLM
Because TA looks bullish.
Entry:- 680-695 Satoshi
Targets:-
TP1:- 794 Satoshi
TP2:- 878 Satoshi
TP3:- 993 satoshi
Stop Loss:- 650 satoshi
Please click LIKe button and Appreciate my hard work.
Must follow me for latest crypto real time updates.
Thank you.

XLM/USDTXLM broke the triangle but has a lot of resistance at 0,413.
if xlm doesn't cross the line soon we can pull back to 0,38.

XLMUSDT Here is my idea for XLM.
Seems like XLM is about to repeat same jump.
Not a financial advice.
Thanks for comments!


Stellar dancing with the devil 5For me it was tough to trade the XLM this month as there were false triangle breakouts during this long chop, but patience is the key and here we go again. Will Stellar finally meet the devil @ 0.666? If we break this HUGE triangle up, I think there is chance for run to 0.69.
SL is local low.
Target is height of the triangle projected from midpoint of the local range (BUY STOP-LIMIT - SL).
RRR 7.85
Invalidated when SL level hit (even if BUY STOP-LIMIT not filled before).

Stellar Too Stuck It's Time To BurstThere was a very good retest. Ready to blown. My targets are on the chart.

Interesting⚡️Good day, wolves🔥
There is one more interesting idea for you.
Ascending triangle on XLMUSDT.
According to Elliott Waves theory the price is heading to Wave D.
The price is in a strong bullish sentiment on a bigger frame, so it may be a good signal to buy.
However do not rush the trade and look for the clear breakout.
_____________________________________________________
If you enjoy my FREE Technical Analysis , support the idea with a big LIKE👍 and don't forget to SUBSCRIBE my channel, you won't miss anything!
Feel free to leave comments✉️
And always remember: "we don't predict, we react".

XLM Buy the dip.XLMUSDT - Intraday - We look to Buy at 0.3816 (stop at 0.3649)
Daily signals are mildly bullish.
Pivot support is at 0.3800.
Dips continue to attract buyers.
We look to buy dips.
A lower correction is expected.
Our profit targets will be 0.4328 and 0.4654
Resistance: 0.4150 / 0.4400 / 0.4700
Support: 0.3900 / 0.3800 / 0.3500

XLM/USD - It's time to PUMP. Visa adopts USDC which is on XLM! What happened in February to Stellar? Do you remember?
USDC (the most trusted/certified/compliant centralized stablecoin) was added on the Stellar network... meaning people can send and received USDC using the Stellar network for nearly 0 fees and instantly...
What happened today?
Visa announced integration/adoption of USDC on its massive network... How many people use a Visa card? 3.3 billion. Do you see where I'm going?
Link:
www.coindesk.com
Soon, maybe even this year, billions of people will be able to access USDC and other cryptos and TRANSACT using the Stellar network via Visa... how is this good for XLM? Well... XLM is the native token of Stellar network and with billions of transactions and huge new demand... XLM will pump, hard. Just a matter of time.
Where is XLM going, $10 - $20 are good targets once global adoption kicks in!
Until then, what does this chart tell us? We are bullish. MACD crossed on the positive side on daily, price action is bullish. We just need to pass $0.41 cents and then we're going fast to $0.46 and $0.60.
Both TA and FA are bullish, especially long term. XLM is a sound investment and still cheap today.
Like and follow if you liked this idea! Also join my crypto community to stay in touch!

Stellar (XLM) - March 29Hello?
Dear traders, nice to meet you.
By "following" you can always get new information quickly.
Please also click "Like".
Have a nice day.
-------------------------------------------------- -----
We have to see if we can get support in the 0.39184-0.41581 range.
If it falls, we need to see if it can rise along the uptrend line.
If it falls between 0.29909-0.31991, Stop Loss is required to preserve profit and loss.
--------------------------------------
(XLMUSDT 1D chart)
It remains to be seen if it can move above the 0.40587 point as it breaks off the downtrend line.
If it falls from the 0.30368 point, a Stop Loss is required to preserve profit and loss.
------------------------------------
(XLMBTC 1D chart)
We have to see if we can go up along the uptrend line.
If it falls, it remains to be seen if it gains support at 690 Satoshi.
In order to turn to an uptrend, it must rise above 782 Satoshi and be supported.
-------------------------------------------------- -------------------------------------------
** All indicators are lagging indicators.
So, it's important to be aware that the indicator moves accordingly with the movement of price and volume.
Just for convenience, we are talking upside down for interpretation of the indicators.
** The wRSI_SR indicator is an indicator created by adding settings and options from the existing Stochastic RSI indicator.
Hence, the interpretation is the same as the traditional Stochastic RSI indicator. (K, D line -> R, S line)
** The OBV indicator was re-created by applying a formula to the DepthHouse Trading indicator, an indicator that oh92 disclosed. (Thank you for this.)
** Check support, resistance, and abbreviation points.
** Support or resistance is based on the closing price of the 1D chart.
** All explanations are for reference only and do not guarantee profit or loss on investment.
Explanation of abbreviations displayed on the chart
R: A point or section of resistance that requires a response to preserve profits
S-L: Stop Loss point or section
S: A point or segment that can be bought for profit generation as a support point or segment
(Short-term Stop Loss can be said to be a point where profits and losses can be preserved or additionally entered through installment transactions. It is a short-term investment perspective.)
GAP refers to the difference in prices that occurred when the stock market, CME, and BAKKT exchanges were closed because they do not trade 24 hours a day.
G1: Closing price when closed
G2: Cigar at the time of opening
(Example) Gap (G1-G2)

XLM 2HRSFor Stellar, I expect a range between 0.35 and 0.43 ! This operation will be repeated until the resistance is broken
Stellar above the range of 44 is completely bullish and the first target is 0.70

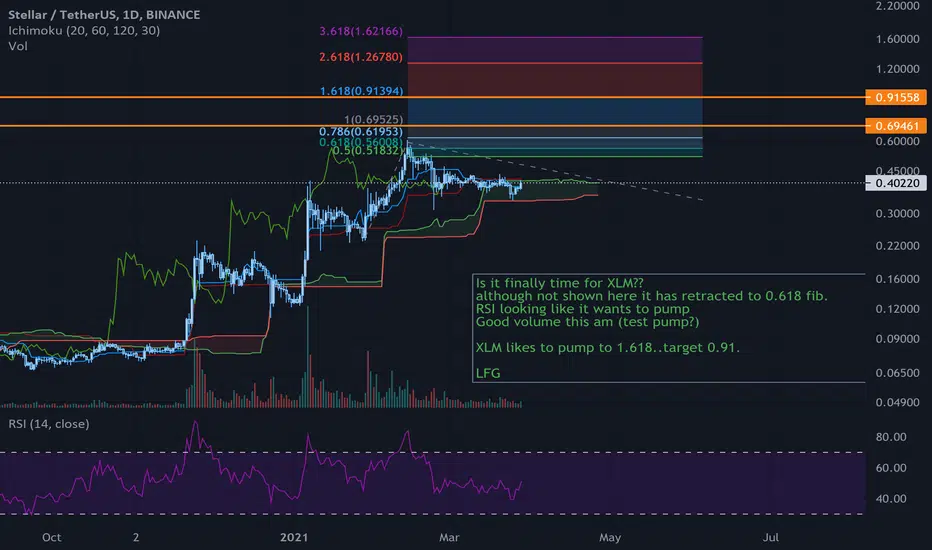
XLMIs it time for XLM? The Content is for informational and entertainment purposes only, you should not construe any such information or other material as legal, tax, investment, financial, or other advice. This is not financial advice nor am I a financial adviser. :)