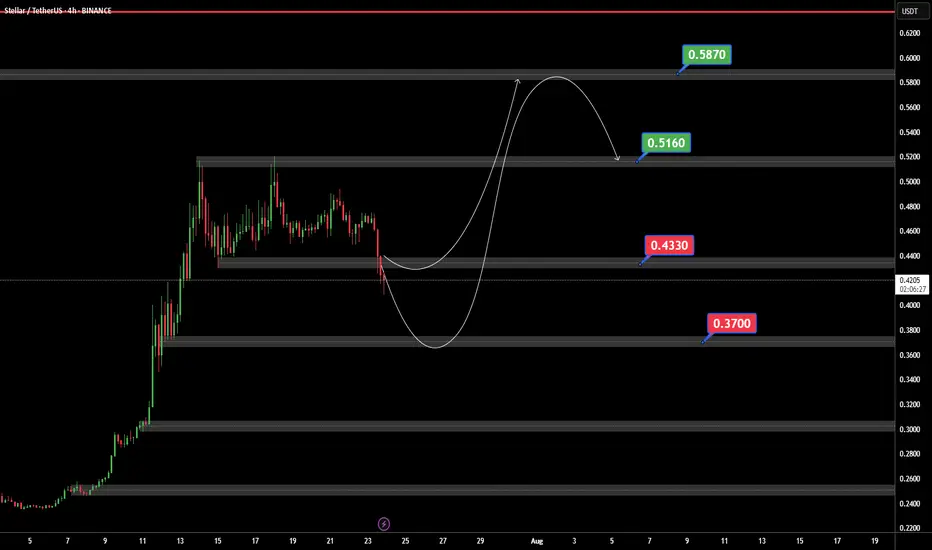
XLMUSDTIf BINANCE:XLMUSDT can support 0.4430 $ ready for jump to 0.5160 and best target in 0.5873 $.
But if XLM can price breaked 0.4330$ support we ready for a bear trend.
Xlmusdtlong
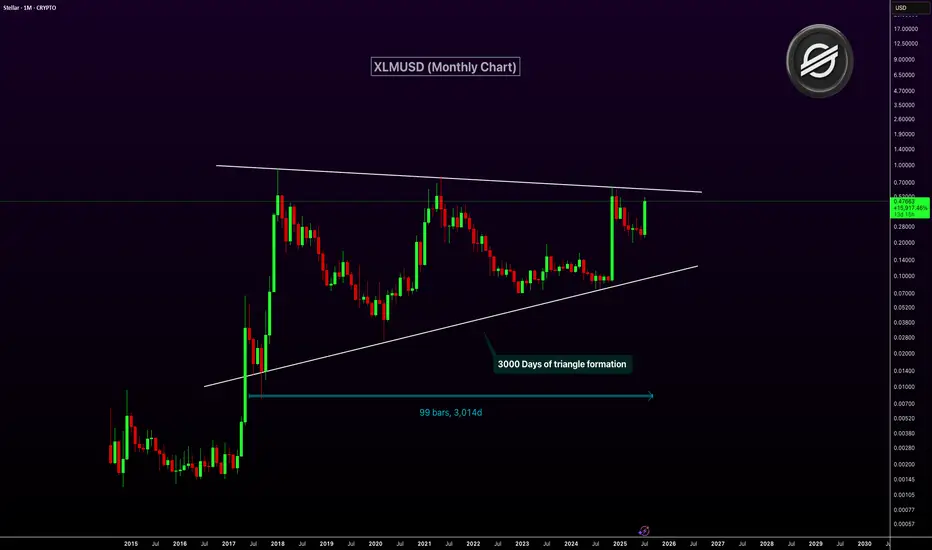
XLMUSD Nearing Breakout After 3,000-Day Triangle FormationXLM has been consolidating inside a massive symmetrical triangle for over 3,000 days. This long-term pattern on the monthly chart dates back to 2017. The price is now approaching the upper resistance trendline of the triangle. A breakout from this structure could ignite a major bullish rally.
The current monthly candle shows strong momentum with over 100% gains. A confirmed breakout above resistance could mark the start of a macro uptrend. This triangle is one of the most significant technical setups in XLM’s history.
Target 1: $1.00
Target 2: $2.50
Target 3: $5.00
From Resistance to Support: XLM Sets the StageXLM had been consolidating under a descending trendline since early 2025. But today, we saw a strong breakout backed by solid momentum.
What’s even better?
It flipped a key resistance zone into support — classic breakout, retest setup.
If bulls hold this level, the next leg up could be explosive.
DYOR, NFA

XLM Breakout Alert – Hidden Gem About to Explode?XLM/USDT is showing signs of a potential breakout from a long-term descending trendline that has been in play since November 2024. Price recently rebounded from a key demand zone (highlighted in yellow), suggesting strong buying interest at lower levels.
📉 Descending Trendline Resistance
The pair has consistently respected a strong downward trendline, rejecting all breakout attempts—until now. Price action is tightening near the apex, increasing the probability of an upward breakout.
🟨 Key Demand Zone
The $0.2150 - $0.2410 area has proven to be a strong accumulation zone, providing a solid foundation for a potential reversal. Price has shown multiple bullish reactions from this area.
📈 Upside Targets Upon Breakout Confirmation: If a confirmed breakout occurs, the following resistance levels can serve as potential profit-taking targets:
$0.2573 (breakout confirmation zone)
$0.3040
$0.3512
$0.4903
$0.5603
📌 Ideal Scenario:
Potential long entry after a confirmed breakout and retest of the trendline (~$0.25 - $0.26)
Stop loss below the demand zone (~$0.2150)
Attractive risk-to-reward setup with minimum 30% upside potential.
⚠️ Note: Wait for confirmation before entering the trade. Be cautious of false breakouts, especially under high market volatility conditions.

XLMUSDT, 1HrPattern is looking Good , If BTC is Sustaining Above 1,06,834 this level then , This XLM pattern will Give a Good Breakout ,
Enter only When Upper Trendline is Breakout
Take Your Own Risk According to your Capital .
Follow for More Ideas Like This

XLMUSDT 1D AnalysisXLM ~ 1D Analysis
#XLM Buy gradually from here if you still have confidence in this coin with a short term target of at least 10%+ from here.

XLMUSDT 1D AnalysisXLM ~ 1D Analysis
#XLM Buy on retesting this support block or buy after successfully breaking the resistance line on this pattern with a short term target of at least 10%+.

XLMUSDT 1D AnalysisXLM ~ 1D Analysis
#XLM Buy after successfully penetrating this resistant line with a short -term target of at least 10%+ from here.

XLMUSDT 1DXLM ~ 1D Analysis
#XLM Coin dinosaur 🦖 , Buy in this pattern, with a short -term target of at least 10%.

#XLMUSDT is showing signs of growth📈 Long BYBIT:XLMUSDT.P from $0.26325
🛡 Stop loss $0.25955
🕒 1H Timeframe
⚡️ Overview:
➡️ The main POC (Point of Control) is at 0.25511, indicating the area with the highest trading volume.
➡️ The 0.25955 level acts as a local support, as the price previously bounced from this zone.
➡️ The volume and market profile highlight areas of high trader activity, especially in the 0.24984 – 0.26325 range.
➡️ The chart shows a forming bullish structure, confirming the potential for further upward movement.
🎯 TP Targets:
💎 TP 1: $0.26630
💎 TP 2: $0.26930
💎 TP 3: $0.27240
📢 Monitor key levels before entering the trade!
📢 If 0.25955 is broken downward, the trade may be invalidated.
📢 If the price holds above 0.26325 and continues rising, the bullish momentum remains intact.
BYBIT:XLMUSDT.P is showing signs of growth—expecting further upside movement!

XLMUSDT Weekly LONG This is a weekly technical analysis for educational purposes on XLMUSDT. I believe that Stellar will find new higher high levels in the middle of the 2025 Bull Season.
As I mentioned before on my ALGOUSDT Weekly Analysis ;
"Considering the global economic crisis, the technical recession in the United States, the suppression of gold and other commodities, the real estate and unemployment crisis in China, and the European Union countries' struggle with inflation, I believe that market makers (the bulls) may create a false FOMO (Fear of Missing Out) during the 2024 BTC halving period, potentially driving BTC to levels of perhaps 50K+ before ending the year 2024 around the 20-25K range. When we consider the global effects, the real bull season is likely to occur between 2025 and 2026.
Reaching 100K in Bitcoin by 2024 wouldn't make much sense if most people don't have the financial means. It's important to remember that patient wealthy individuals often capitalize on the impatience of those with fewer resources. (let's say poors with high dreams) Those with limited means may not have the capital to participate in the market for couple of years.
This is not "clever riches profit from the idiot riches game". Never was. I believe.
I may be wrong, :)
Regards,

XLMUSDT 1DXLM ~ 1D Analysis
#XLM The Bullish flag was formed on the 1D time frame. Buy gradually in this support block with a minimum target of 10%++.

XLM/USD "Stellar Lumen vs US Dollar" Crypto Market Heist Plan🌟Hi! Hola! Ola! Bonjour! Hallo!🌟
Dear Money Makers & Robbers, 🤑💰🐱👤
Based on 🔥Thief Trading style technical and fundamental analysis🔥, here is our master plan to heist the XLM/USD "Stellar Lumen vs US Dollar" Crypto market. Please adhere to the strategy I've outlined in the chart, which emphasizes long entry and short entry. 🏆💸Be wealthy and safe trade.💪🏆🎉
Entry 📈 :
"The loot's within reach! Wait for the breakout, then grab your share - whether you're a Bullish thief or a Bearish bandit!"
Buy entry above 0.3400
Sell Entry below 0.30500
However, I recommended to place buy stop for bullish side and sell stop for bearish side.
Stop Loss 🛑:
Thief SL placed at 0.3100 (swing Trade Basis) for Bullish Trade
Thief SL placed at 0.34000 (swing Trade Basis) for Bearish Trade
Using the 2H period, the recent / nearest low or high level.
SL is based on your risk of the trade, lot size and how many multiple orders you have to take.
Target 🎯:
-Bullish Robbers TP 1st target - 0.3850 / Last target - 0.4800 (or) Escape Before the Target
-Bearish Robbers TP 0.23000 (or) Escape Before the Target
📰🗞️Fundamental, Macro, COT, Sentimental Outlook:
XLM/USD "Stellar Lumen vs US Dollar" Crypto market is currently experiencing a Neutral trend (there is a higher chance for Bullishness)., driven by several key factors.
💱 Fundamental Analysis: Bullish
- Stellar's fundamentals are strong, with a growing ecosystem and increasing adoption of its
blockchain technology.
- Partnerships with major companies like IBM and Deloitte are driving growth.
💱 Macro Economics: Neutral
- The global economic outlook is uncertain, but Stellar's decentralized nature makes it less
susceptible to traditional economic factors.
- Increasing institutional investment in cryptocurrencies is a positive macroeconomic factor.
💱 COT Report:
- Non-Commercial Traders (Speculators): 35% Long, 65% Short
- Commercial Traders: 40% Long, 60% Short
- Non-Reportable Traders: 25% Long, 75% Short
💱 Sentimental Market Analysis: Bullish
- The overall market sentiment for XLM/USD is bullish, with many traders expecting a price
increase.
- This sentiment is driven by Stellar's strong fundamentals and increasing adoption.
💱 Positioning:
- Institutional Traders: 40% Bullish, 30% Bearish, 30% Neutral
- Banks: 35% Bullish, 35% Bearish, 30% Neutral
- Hedge Funds: 45% Bullish, 25% Bearish, 30% Neutral
- Corporate Traders: 30% Bullish, 40% Bearish, 30% Neutral
- Retail Traders: 50% Bullish, 20% Bearish, 30% Neutral
💱 Price Prediction:
- Short-term (next 30 days): $0.15-$0.25
- Medium-term (next 3 months): $0.20-$0.35
- Long-term (next 6 months): $0.30-$0.50
💱 Overall Outlook: Bullish
- The overall outlook for XLM/USD is bullish, driven by Stellar's strong fundamentals, increasing adoption, and positive market sentiment.
⚠️Trading Alert : News Releases and Position Management 📰 🗞️ 🚫🚏
As a reminder, news releases can have a significant impact on market prices and volatility. To minimize potential losses and protect your running positions,
we recommend the following:
Avoid taking new trades during news releases
Use trailing stop-loss orders to protect your running positions and lock in profits
📌Please note that this is a general analysis and not personalized investment advice. It's essential to consider your own risk tolerance and market analysis before making any investment decisions.
📌Keep in mind that these factors can change rapidly, and it's essential to stay up-to-date with market developments and adjust your analysis accordingly.
💖Supporting our robbery plan will enable us to effortlessly make and steal money 💰💵 Tell your friends, Colleagues and family to follow, like, and share. Boost the strength of our robbery team. Every day in this market make money with ease by using the Thief Trading Style.🏆💪🤝❤️🎉🚀
I'll see you soon with another heist plan, so stay tuned 🤑🐱👤🤗🤩

XLMUSDT 1DXLM ~ 1D
#XLM At Time Frame 1D Forms a bullish Flag. Buy after breaking through the resistance of this pattern. Minimum target 20%++

#XLM/USDT Ready to go higher#XLM
The price is moving in a descending channel on the 1-hour frame and sticking to it well
We have a bounce from the lower limit of the descending channel, this support is at 0.4300
We have a downtrend on the RSI indicator that is about to be broken, which supports the rise
We have a trend to stabilize above the moving average 100
Entry price 0.4434
First target 0.4590
Second target 0.4746
Third target 0.4927

xlm long!"🌟 Welcome to Golden Candle! 🌟
We're a team of 📈 passionate traders 📉 who love sharing our 🔍 technical analysis insights 🔎 with the TradingView community. 🌎
Our goal is to provide 💡 valuable perspectives 💡 on market trends and patterns, but 🚫 please note that our analyses are not intended as buy or sell recommendations. 🚫
Instead, they reflect our own 💭 personal attitudes and thoughts. 💭
Follow along and 📚 learn 📚 from our analyses! 📊💡"

#XLM/USDT Ready to Soar!$XLM/USDT Long Setup
Pattern: XLM is forming a bullish pennant pattern after a strong upward move, with consolidation narrowing between support and resistance. The 200 EMA is acting as dynamic support, suggesting bullish momentum.
Entry Range: Current price ($0.4896). Entries can be considered between $0.4800 and $0.5000.
Targets:
T1: $0.6400
T2: $0.8000
T3: $0.9400
Stop Loss (SL): Place a stop loss below the pennant's lower boundary at $0.4520 to reduce risk.
DYOR, NFA

#XLM/USDT#XLM
The price moves in an inverted head and shoulders pattern
The right shoulder is now complete
Wall is expected for the upper border of the shoulder
We have a higher stability moving average of 100
We have bullish momentum on the RSI and an uptrend
We have a current breakout of the channel to the upside
Entry price is 0.2500
The first target is 0.3000
The second target is 0.3500
The third goal is 0.4000

#XLM/USDT#XLM
The price is moving in a descending channel on the 1-hour frame and is holding it tightly and is about to break out to the upside
We have a bounce from the lower limit of the channel at 0.0900
We have a bearish trend of the RSI that is about to break out, which supports the upside
We have a trend to stabilize above the 100 moving average
Entry price 0.900
First target 0.0920
Second target 0.0988
Third target 0.1031

Stellar Long Setup Setting / Risky but Why not?BINANCE:XLMUSDT
COINBASE:XLMUSDT
📈Which side you pick?
Bull or Bear
SL1 ---> Low-risk status: 3x-4x Leverage
SL2 ---> Mid-risk status: 5x-8x Leverage
(If there is just one SL on the chart, I suggest, low risk status)
👾Note: The setup is active but expect the uncertain phase as well. also movement lines drawn to predict future price reactions are relative and approximate.
➡️Entry Area:
Yellow zone: 0.0914-0.0942
⚡️TP:
0.0955
0.0968
0.0985
🔴SL:
0.0892
🧐The Alternate scenario:
If the price stabilize against the direction of the position, below or above the trigger zone, the setup will be canceled.

Long Position on XLMUSDT / Volume ProjectionBINANCE:XLMUSDT
COINBASE:XLMUSD
SL2 ---> Mid-risk status: 5x-8x Leverage
SL1 ---> Low-risk status: 3x-4x Leverage
👾The setup is active but expect the uncertain phase as well.
⚡️TP:
0.1045
0.1055
0.1070
0.1085
0.1100
0.01112(In Optimistic Scenario)
➡️SL:
0.0977
0.0955
🧐 The Alternate scenario:
🔴If the price stabilizes below the trigger zone, the setup will be cancelled.

XLMUSDT Elliott Waves Analysis (Longterm)Hello friends.
Please support my work by clicking the LIKE button👍(If you liked). Also i will appreciate for ur activity. Thank you!
Everything on the chart.
Entry: market and lower
Targets: 0.25 - 0.4 - 0.7 - 1$
SL: w/o stop
risk is justified
Good luck everyone!
Follow me on TRADINGView, if you don't want to miss my next analysis or signals.
It's not financial advice.
DYOR!

XLMUSDT Elliott Waves (Local Setup)Hello friends.
Please support my work by clicking the LIKE button👍(If you liked). Also i will appreciate for ur activity. Thank you!
Everything on the chart.
Entry: market and lower (im in pos from 0.135)
Targets: 0.16 and 0.18
after first target reached move ur stop to breakeven
Stop: ~0.113 (depending of ur risk). ALWAYS follow ur RM .
risk is justified
Good luck everyone!
Follow me on TRADINGView, if you don't want to miss my next analysis or signals.
It's not financial advice.
DYOR!
