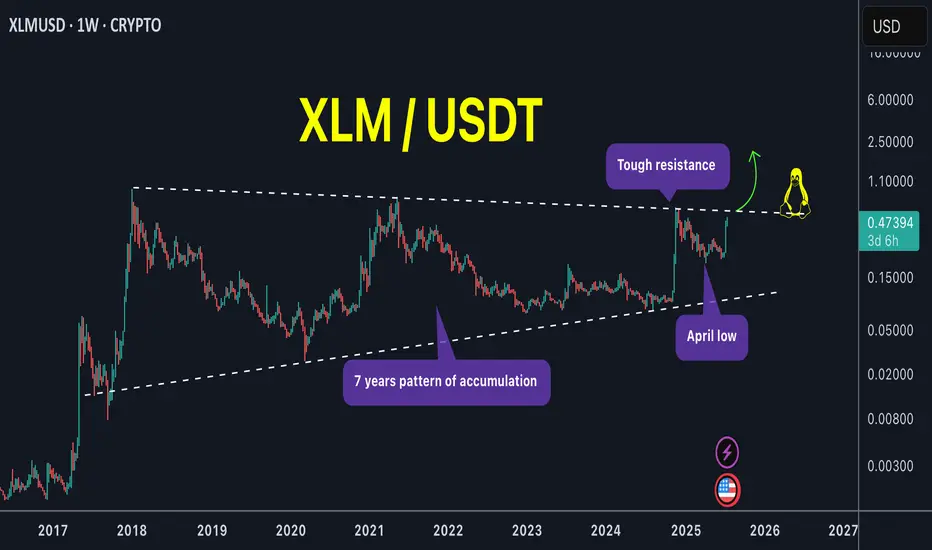
XLM is the pump over or just getting started !XLM / USDT
What a huge weekly candle! We catched its strong move very early around 0.29$ a week ago (75% profits locked in spot)
With a zoom out chart we can see price is setting up nicely with several tests of pattern boundary. Next test of the upper boundary can lead to huge breakout of this mega pattern !
NOTE: Price must not close below april low and should close above upper boundary unless that its just a range
Keep an eye on it closely !
Xlmusdtrade
XLM Breakout Alert – Hidden Gem About to Explode?XLM/USDT is showing signs of a potential breakout from a long-term descending trendline that has been in play since November 2024. Price recently rebounded from a key demand zone (highlighted in yellow), suggesting strong buying interest at lower levels.
📉 Descending Trendline Resistance
The pair has consistently respected a strong downward trendline, rejecting all breakout attempts—until now. Price action is tightening near the apex, increasing the probability of an upward breakout.
🟨 Key Demand Zone
The $0.2150 - $0.2410 area has proven to be a strong accumulation zone, providing a solid foundation for a potential reversal. Price has shown multiple bullish reactions from this area.
📈 Upside Targets Upon Breakout Confirmation: If a confirmed breakout occurs, the following resistance levels can serve as potential profit-taking targets:
$0.2573 (breakout confirmation zone)
$0.3040
$0.3512
$0.4903
$0.5603
📌 Ideal Scenario:
Potential long entry after a confirmed breakout and retest of the trendline (~$0.25 - $0.26)
Stop loss below the demand zone (~$0.2150)
Attractive risk-to-reward setup with minimum 30% upside potential.
⚠️ Note: Wait for confirmation before entering the trade. Be cautious of false breakouts, especially under high market volatility conditions.

XLMUSDT 1D AnalysisXLM ~ 1D Analysis
#XLM Buy gradually from here if you still have confidence in this coin with a short term target of at least 10%+ from here.

XLM/USD Stellar Heist: Snag the Bullish Breakout Loot!🚀XLM/USD Stellar Surge Strategy🚀
Hello, Wealth Warriors & Market Mavericks! 💸 Ready to conquer the Stellar vs. Tether (XLM/USD) crypto battlefield? 📊 This *Cosmic Trading Blueprint* fuses razor-sharp technicals with real-time market pulse to chase a bullish breakout. Follow this strategy, ride the wave, and exit before the Danger Zone strikes. Let’s bag those profits as a squad! 🤝🎯
📈 **Strategy Snapshot: XLM/USD Stellar**
- **Market**: XLM/USDT (Crypto) 🌍
- **Bias**: Bullish Breakout ✨
- **Timeframe**: 6h (Swing Trade) ⏳
**Entry Points** 📡
- **Breakout Entry (Entry 1)**: Spot the breakout above the 50-period MA at 0.33500 and dive in—stellar gains await! 🚀
*Smart Tip*: Place buy stop orders above the MA or buy limit orders at the latest 15/30-min swing low for pullback entries. 🔔 Set a TradingView alert for the 0.33500 breakout to stay ahead of the game!
- **Pullback Entry (Entry 2)**: Wait for a dip near 0.32500, confirmed by bullish price action, for a safer entry. 📉
**Stop Loss** 🛡️
- **Breakout Traders**: After breakout confirmation, set Stop Loss below the recent 1D swing low at 0.28000 to guard against reversals. ⚠️
- **Pullback Traders**: Adjust Stop Loss based on risk tolerance (e.g., 1-2% of account), factoring in lot size and multiple entries. 📏
- **Risk Note**: This trade’s high-energy! Keep position sizing disciplined to protect your capital. 🔥
**Target** 🎯
- Aim for 0.45000, near the Danger Zone (overbought area prone to consolidation or reversal). 🏁
- **Exit Strategy**: Take profits early if bearish signals (e.g., high volume, reversal patterns) emerge near 0.45000. 💰
**Scalpers** 👀
- Target quick long-side scalps with tight trailing stops. Pair with swing traders for the full strategy or snag fast profits if capital allows. 💵
📊 **Why This Trade Shines (May 18, 2025)**
XLM/USDT is poised for action, driven by:
- **Technicals**: Breakout above the 50-day MA (~0.33500) with higher lows on the 4h chart signals strong momentum. 📈
- **Sentiment Analysis (May 18, 2025)**: Web sentiment shows 70% positive buzz for XLM, with altcoin hype growing. Fear & Greed Index at 74 (Greed), urging caution near overbought levels. 😎
- **Fundamentals**: CFTC’s COT report (May 16, 2025) indicates a 10% WoW increase in institutional long positions in crypto futures, reflecting big-player optimism. 📰
- **Seasonal Advantage**: Q2 historically boosts altcoins, aligning with this setup. 📅
- **Market Dynamics**: USD weakness (DXY down 0.9% this week) and altcoin strength fuel XLM’s upside. 🌎
⚠️ **Risk Management: Secure Your Gains**
- **News Caution**: Avoid new trades during high-impact events (e.g., CPI, FOMC) to dodge volatility spikes. 🗞️
- **Trailing Stops**: Activate trailing Stop Loss as price approaches 0.42000 to lock in profits. 🔒
- **Position Sizing**: Limit risk to 1-2% per trade for a steady strategy. 🚨
💥 **Launch the Surge!** 💥
Join the *Cosmic Trading Blueprint* crew—like, comment, and follow for more dynamic trade setups! 🚀 Your engagement fuels our market quests, driving precision wins. Let’s crush XLM/USDT together! 🤝🏆🎉
**Stay Ready**: Another stellar plan is in the works. Keep your charts primed, traders! 🐱🚀😎
📡 **Real-Time Data (May 18, 2025, UTC+1)**
- **XLM/USDT Price**: ~0.33200 (aggregated exchange data).
- **COT Report (May 16, 2025)**: Institutional long positions in crypto futures up 10% WoW, per CFTC.
- **Sentiment**: 70% positive, Fear & Greed Index at 74 (Greed).
- **USD Index (DXY)**: Down 0.9% WoW, supporting altcoin momentum.

XLMUSDT 1D AnalysisXLM ~ 1D Analysis
#XLM Buy on retesting this support block or buy after successfully breaking the resistance line on this pattern with a short term target of at least 10%+.

XLM/USDT Breakdown: Structure Shift & Bearish Retracement Setup🚀 XLM/USDT Trade Outlook 🔎
I've been reviewing the XLM/USDT pair, and it's showing a very familiar setup compared to other majors. 🔁 On the daily timeframe, we've seen a notable shift in structure, with a clear break to the downside. 🧱📉 Dropping into the 4-hour chart, that structural break is even more apparent, adding confidence to a bearish bias. 🔍
Currently, the pair is extended away from value—and I’m anticipating a pullback into the fair value zone, where I’ll be watching closely for a potential short setup. 📐💼
🎯 In the breakdown video, we cover:
The prevailing trend context 🌊
How market structure is unfolding across timeframes 🔂
Price action cues to validate the setup 🎥📈
Key support and resistance areas for both entry and target planning 🎯
For risk management, I’m positioning the stop above the retracement high, using roughly 2x ATR for calculated protection 🛑⚙️. A potential reward could extend to 5–6x ATR, depending on how price reacts around prior structure levels on the left. ⬅️📊
As always, I’m cross-checking with my Fibonacci levels for extra confluence—and the alignment here is looking solid. 🔢🧲
Remember, this is not financial advice. Always do your own due diligence. ⚠️💡📉

XLMUSDT 1D AnalysisXLM ~ 1D Analysis
#XLM Buy after successfully penetrating this resistant line with a short -term target of at least 10%+ from here.

"Stellar vs Tether" Crypto Market Heist Plan (Swing Trade)🌟Hi! Hola! Ola! Bonjour! Hallo! Marhaba!🌟
Dear Money Makers & Robbers, 🤑 💰💸✈️
Based on 🔥Thief Trading style technical and fundamental analysis🔥, here is our master plan to heist the XLM/USDT "Stellar vs Tether" Crypto Market. Please adhere to the strategy I've outlined in the chart, which emphasizes long entry. Our aim is the high-risk Red Zone. Risky level, overbought market, consolidation, trend reversal, trap at the level where traders and bearish robbers are stronger. 🏆💸"Take profit and treat yourself, traders. You deserve it!💪🏆🎉
Entry 📈 : "The heist is on! Wait for the MA breakout (0.2900) then make your move - Bullish profits await!"
however I advise to Place Buy stop orders above the Moving average (or) Place buy limit orders within a 15 or 30 minute timeframe most recent or swing, low or high level.
📌I strongly advise you to set an alert on your chart so you can see when the breakout entry occurs.
Stop Loss 🛑:
Thief SL placed at the recent/swing low level Using the 2H timeframe (0.2600) swing trade basis.
SL is based on your risk of the trade, lot size and how many multiple orders you have to take.
🏴☠️Target 🎯: 0.3400 (or) Escape Before the Target
🧲Scalpers, take note 👀 : only scalp on the Long side. If you have a lot of money, you can go straight away; if not, you can join swing traders and carry out the robbery plan. Use trailing SL to safeguard your money 💰.
XLM/USDT "Stellar vs Tether" Crypto Market Heist Plan (Swing Trade) is currently experiencing a bullishness,., driven by several key factors.
📰🗞️Get & Read the Fundamental, Macro, COT Report, On Chain Analysis, Sentimental Outlook, Intermarket Analysis, Future trend targets.. go ahead to check 👉👉👉
📌Keep in mind that these factors can change rapidly, and it's essential to stay up-to-date with market developments and adjust your analysis accordingly.
⚠️Trading Alert : News Releases and Position Management 📰 🗞️ 🚫🚏
As a reminder, news releases can have a significant impact on market prices and volatility. To minimize potential losses and protect your running positions,
we recommend the following:
Avoid taking new trades during news releases
Use trailing stop-loss orders to protect your running positions and lock in profits
💖Supporting our robbery plan 💥Hit the Boost Button💥 will enable us to effortlessly make and steal money 💰💵. Boost the strength of our robbery team. Every day in this market make money with ease by using the Thief Trading Style.🏆💪🤝❤️🎉🚀
I'll see you soon with another heist plan, so stay tuned 🤑🐱👤🤗🤩

XLMUSDT 1DXLM ~ 1D Analysis
#XLM Coin dinosaur 🦖 , Buy in this pattern, with a short -term target of at least 10%.

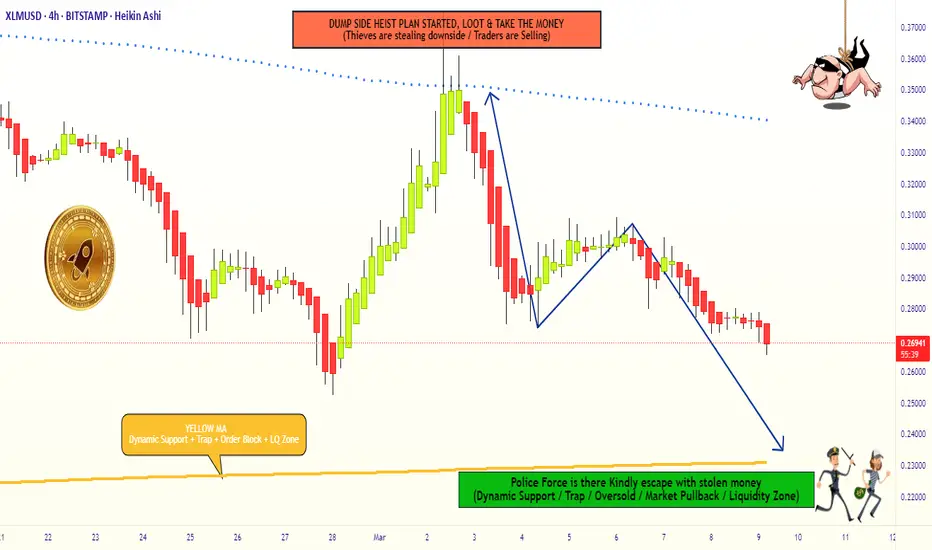
XLM/USD "Stellar vs US Dollar" Crypto Market Heist Plan🌟Hi! Hola! Ola! Bonjour! Hallo! Marhaba!🌟
Dear Money Makers & Robbers, 🤑💰✈️
Based on 🔥Thief Trading style technical and fundamental analysis🔥, here is our master plan to heist the XLM/USD "Stellar vs US Dollar" Crypto market. Please adhere to the strategy I've outlined in the chart, which emphasizes short entry. Our aim is the high-risk Green Zone. Risky level, oversold market, consolidation, trend reversal, trap at the level where traders and bullish robbers are stronger. 🏆💸Book Profits Be wealthy and safe trade.💪🏆🎉
Entry 📈 : "The vault is wide open! Swipe the Bearish loot at any price - the heist is on!
however I advise to Place buy limit orders within a 15 or 30 minute timeframe most recent or swing, low or high level. I Highly recommended you to put alert in your chart.
Stop Loss 🛑:
Thief SL placed at the recent / swing low level Using the 4H timeframe (0.30000) swing trade basis.
SL is based on your risk of the trade, lot size and how many multiple orders you have to take.
Target 🎯: 0.23000 (or) Escape Before the Target
🧲Scalpers, take note 👀 : only scalp on the Short side. If you have a lot of money, you can go straight away; if not, you can join swing traders and carry out the robbery plan. Use trailing SL to safeguard your money 💰.
XLM/USD "Stellar vs US Dollar" Crypto market is currently experiencing a Bearish Trend,., driven by several key factors. 📰🗞️Read Fundamental, Macro, COT Report, On Chain Analysis, Sentimental Outlook, Intermarket Analysis, Future Prediction:
📌Keep in mind that these Fundamental factors can change rapidly, and it's essential to stay up-to-date with market developments and adjust your analysis accordingly.
⚠️Trading Alert : News Releases and Position Management 📰 🗞️ 🚫🚏
As a reminder, news releases can have a significant impact on market prices and volatility. To minimize potential losses and protect your running positions,
we recommend the following:
Avoid taking new trades during news releases
Use trailing stop-loss orders to protect your running positions and lock in profits
💖Supporting our robbery plan 💥Hit the Boost Button💥 will enable us to effortlessly make and steal money 💰💵. Boost the strength of our robbery team. Every day in this market make money with ease by using the Thief Trading Style.🏆💪🤝❤️🎉🚀
I'll see you soon with another heist plan, so stay tuned 🤑🐱👤🤗🤩
#XLMUSDT is showing signs of growth📈 Long BYBIT:XLMUSDT.P from $0.26325
🛡 Stop loss $0.25955
🕒 1H Timeframe
⚡️ Overview:
➡️ The main POC (Point of Control) is at 0.25511, indicating the area with the highest trading volume.
➡️ The 0.25955 level acts as a local support, as the price previously bounced from this zone.
➡️ The volume and market profile highlight areas of high trader activity, especially in the 0.24984 – 0.26325 range.
➡️ The chart shows a forming bullish structure, confirming the potential for further upward movement.
🎯 TP Targets:
💎 TP 1: $0.26630
💎 TP 2: $0.26930
💎 TP 3: $0.27240
📢 Monitor key levels before entering the trade!
📢 If 0.25955 is broken downward, the trade may be invalidated.
📢 If the price holds above 0.26325 and continues rising, the bullish momentum remains intact.
BYBIT:XLMUSDT.P is showing signs of growth—expecting further upside movement!

XLM short termHello
this time I am posting a short term idea (few days to few weeks).
After explosion in Q4 of 2024 XLM has formed a downtrending channel which can potentially turn into a bull flag.
Currently XLM price is sitting at a bottom of this channel.
Short term traders can look to purchase some XLM now and wait till it comes towards the top of the channel to sell and get some profit. If it reaches top of the channel potential is 50% price increase.
If the market turns bullish in next few days to weeks XLM might even break upwards out of this bull flag but do not count on it just yet.
This idea is somewhat risky so proceed with extreme caution and with tight stop-loss below the channel.
Good luck.

XLMUSDT 1DXLM ~ 1D Analysis
#XLM The Bullish flag was formed on the 1D time frame. Buy gradually in this support block with a minimum target of 10%++.

XLM/USD "Stellar Lumen vs US Dollar" Crypto Market Heist Plan🌟Hi! Hola! Ola! Bonjour! Hallo!🌟
Dear Money Makers & Robbers, 🤑💰🐱👤
Based on 🔥Thief Trading style technical and fundamental analysis🔥, here is our master plan to heist the XLM/USD "Stellar Lumen vs US Dollar" Crypto market. Please adhere to the strategy I've outlined in the chart, which emphasizes long entry and short entry. 🏆💸Be wealthy and safe trade.💪🏆🎉
Entry 📈 :
"The loot's within reach! Wait for the breakout, then grab your share - whether you're a Bullish thief or a Bearish bandit!"
Buy entry above 0.3400
Sell Entry below 0.30500
However, I recommended to place buy stop for bullish side and sell stop for bearish side.
Stop Loss 🛑:
Thief SL placed at 0.3100 (swing Trade Basis) for Bullish Trade
Thief SL placed at 0.34000 (swing Trade Basis) for Bearish Trade
Using the 2H period, the recent / nearest low or high level.
SL is based on your risk of the trade, lot size and how many multiple orders you have to take.
Target 🎯:
-Bullish Robbers TP 1st target - 0.3850 / Last target - 0.4800 (or) Escape Before the Target
-Bearish Robbers TP 0.23000 (or) Escape Before the Target
📰🗞️Fundamental, Macro, COT, Sentimental Outlook:
XLM/USD "Stellar Lumen vs US Dollar" Crypto market is currently experiencing a Neutral trend (there is a higher chance for Bullishness)., driven by several key factors.
💱 Fundamental Analysis: Bullish
- Stellar's fundamentals are strong, with a growing ecosystem and increasing adoption of its
blockchain technology.
- Partnerships with major companies like IBM and Deloitte are driving growth.
💱 Macro Economics: Neutral
- The global economic outlook is uncertain, but Stellar's decentralized nature makes it less
susceptible to traditional economic factors.
- Increasing institutional investment in cryptocurrencies is a positive macroeconomic factor.
💱 COT Report:
- Non-Commercial Traders (Speculators): 35% Long, 65% Short
- Commercial Traders: 40% Long, 60% Short
- Non-Reportable Traders: 25% Long, 75% Short
💱 Sentimental Market Analysis: Bullish
- The overall market sentiment for XLM/USD is bullish, with many traders expecting a price
increase.
- This sentiment is driven by Stellar's strong fundamentals and increasing adoption.
💱 Positioning:
- Institutional Traders: 40% Bullish, 30% Bearish, 30% Neutral
- Banks: 35% Bullish, 35% Bearish, 30% Neutral
- Hedge Funds: 45% Bullish, 25% Bearish, 30% Neutral
- Corporate Traders: 30% Bullish, 40% Bearish, 30% Neutral
- Retail Traders: 50% Bullish, 20% Bearish, 30% Neutral
💱 Price Prediction:
- Short-term (next 30 days): $0.15-$0.25
- Medium-term (next 3 months): $0.20-$0.35
- Long-term (next 6 months): $0.30-$0.50
💱 Overall Outlook: Bullish
- The overall outlook for XLM/USD is bullish, driven by Stellar's strong fundamentals, increasing adoption, and positive market sentiment.
⚠️Trading Alert : News Releases and Position Management 📰 🗞️ 🚫🚏
As a reminder, news releases can have a significant impact on market prices and volatility. To minimize potential losses and protect your running positions,
we recommend the following:
Avoid taking new trades during news releases
Use trailing stop-loss orders to protect your running positions and lock in profits
📌Please note that this is a general analysis and not personalized investment advice. It's essential to consider your own risk tolerance and market analysis before making any investment decisions.
📌Keep in mind that these factors can change rapidly, and it's essential to stay up-to-date with market developments and adjust your analysis accordingly.
💖Supporting our robbery plan will enable us to effortlessly make and steal money 💰💵 Tell your friends, Colleagues and family to follow, like, and share. Boost the strength of our robbery team. Every day in this market make money with ease by using the Thief Trading Style.🏆💪🤝❤️🎉🚀
I'll see you soon with another heist plan, so stay tuned 🤑🐱👤🤗🤩

XLM/USD "Stellar vs US Dollar" Crypto Market Bearish Heist Plan🌟Hi! Hola! Ola! Bonjour! Hallo!🌟
Dear Money Makers & Robbers, 🤑 💰
Based on 🔥Thief Trading style technical and fundamental analysis🔥, here is our master plan to heist the XLM/USD "Stellar vs US Dollar" Crypto market. Please adhere to the strategy I've outlined in the chart, which emphasizes short entry. Our aim is the high-risk Green Zone. Risky level, oversold market, consolidation, trend reversal, trap at the level where traders and bullish robbers are stronger. 👀 Be wealthy and safe trade.💪🏆🎉
Entry 📉 : Traders & Thieves with New Entry A bull trade can be initiated at any price level.
however I advise placing sell limit orders within a 15 or 30 minute timeframe. Entry from the most recent or closest high level should be in retest.
Stop Loss 🛑: Using the 2h period, the recent / nearest high level.
Goal 🎯: 0.38666 (OR) Before escape in the bank
Scalpers, take note : only scalp on the Short side. If you have a lot of money, you can go straight away; if not, you can join swing traders and carry out the robbery plan. Use trailing SL to safeguard your money 💰.
Fundamental Outlook 📰🗞️
The XLM/USD (STELLAR vs U.S Dollar) market is expected to move in a bearish direction, driven by several key factors.
Fundamental Analysis
1. Decreasing Trading Volume: XLM's trading volume has been decreasing over the past few months, indicating a lack of interest from traders and investors.
2. Stagnant Price Action: XLM's price has been stuck in a narrow range for several months, failing to break out or show any significant upward momentum.
3. Low Network Activity: Stellar's network activity, such as transaction count and block creation, has been relatively low compared to other blockchain networks.
Macro Analysis
1. Competition from Other Cryptocurrencies: Stellar faces intense competition from other cryptocurrencies, such as Ripple, Bitcoin, and Ethereum, which have larger market capitalizations and more established ecosystems.
2. Regulatory Uncertainty: The regulatory environment for cryptocurrencies is still unclear in many countries, which can create uncertainty and hesitation among investors and users.
3. Lack of Institutional Investment: Despite some partnerships and collaborations, Stellar has yet to attract significant institutional investment, which is necessary for long-term growth and adoption.
Market Sentiment
1. Bearish Trader Sentiment: The sentiment among traders is currently bearish, with many expecting the price to decrease in the short term.
2. Low Retail Interest: Retail interest in XLM has been waning, with fewer investors and traders showing interest in the cryptocurrency.
3. Negative Social Media Sentiment: Social media sentiment towards XLM has been negative, with many users expressing disappointment and frustration with the cryptocurrency's performance.
Upcoming Events
1. Potential Regulatory Crackdown: There is a risk of a regulatory crackdown on cryptocurrencies, which could negatively impact XLM's price and adoption.
2. Competition from New Cryptocurrencies: New cryptocurrencies and blockchain projects are emerging, which could potentially compete with Stellar for users and investors.
3. Technical Challenges: Stellar's network has faced technical challenges in the past, such as congestion and scalability issues, which could impact its performance and adoption.
Sentiment Analysis:
Overall Sentiment:
Bearish (60%)
Sentiment Breakdown:
- Bearish: 60%
- Negative sentiment driven by decreasing trading volume, stagnant price action, and low network activity.
- Neutral: 25%
- Mixed sentiment due to uncertainty around regulatory environment and lack of institutional investment.
- Bullish: 15%
- Positive sentiment driven by potential for partnerships and collaborations, and optimism around Stellar's technology.
Market Sentiment Indicators
- Trader Sentiment: Bearish (55%)
- Retail Sentiment: Bearish (62%)
- Social Media Sentiment: Bearish (58%)
- News Sentiment: Neutral (50%)
Technical Analysis Indicators
- Moving Averages: Bearish (60%)
- Relative Strength Index (RSI): Neutral (50%)
- Bollinger Bands: Bearish (55%)
Trading Alert⚠️ : News Releases and Position Management 📰 🗞️ 🚫🚏
As a reminder, news releases can have a significant impact on market prices and volatility. To minimize potential losses and protect your running positions,
we recommend the following:
Avoid taking new trades during news releases
Use trailing stop-loss orders to protect your running positions and lock in profits
Please note that this is a general analysis and not personalized investment advice. It's essential to consider your own risk tolerance and market analysis before making any investment decisions.
Keep in mind that these factors can change rapidly, and it's essential to stay up-to-date with market developments and adjust your analysis accordingly.
💖Supporting our robbery plan will enable us to effortlessly make and steal money 💰💵 Tell your friends, Colleagues and family to follow, like, and share. Boost the strength of our robbery team. Every day in this market make money with ease by using the Thief Trading Style.🏆💪🤝❤️🎉🚀
I'll see you soon with another heist plan, so stay tuned 🫂

XLM/USD "Stellar vs U.S Dollar" Crypto Market Bullish Heist Plan🌟Hi! Hola! Ola! Bonjour! Hallo!🌟
Dear Money Makers & Robbers, 🤑 💰
Based on 🔥Thief Trading style technical and fundamental analysis🔥, here is our master plan to heist the XLM/USD "Stellar vs U.S Dollar" Crypto market. Please adhere to the strategy I've outlined in the chart, which emphasizes long entry. Our aim is the high-risk Red Zone. Risky level, overbought market, consolidation, trend reversal, trap at the level where traders and bearish robbers are stronger. Be wealthy and safe trade.💪🏆🎉
Entry 📈 : You can enter a Bull trade at anypoint,
however I advise placing Buy limit orders within a 15 or 30 minute timeframe. Entry from the most recent or closest low or high level should be in retest.
Stop Loss 🛑: Using the 2H period, the recent / nearest low or high level.
Goal 🎯: 0.55000 (or) Escape Before the Target
Scalpers, take note 👀 : only scalp on the Long side. If you have a lot of money, you can go straight away; if not, you can join swing traders and carry out the robbery plan. Use trailing SL to safeguard your money 💰.
Warning⚠️ : Our heist strategy is incompatible with Fundamental Analysis news 📰 🗞️. We'll wreck our plan by smashing the Stop Loss 🚫🚏. Avoid entering the market right after the news release.
Fundamental Outlook 📰🗞️
Considering these factors, the XLM/USD pair may experience a Bullish trend in the short-term, driven by:
Growing adoption and usage of XLM for cross-border payments and remittances.
Increasing demand for fast and low-cost digital payments, driven by growing global trade and commerce.
Favorable regulatory environment, driven by growing recognition of the benefits of cryptocurrencies and blockchain technology.
🐂Bullish Factors:
Growing adoption and usage of XLM for cross-border payments and remittances.
Increasing demand for fast and low-cost digital payments, driven by growing global trade and commerce.
Favorable regulatory environment, driven by growing recognition of the benefits of cryptocurrencies and blockchain technology.
Growing interest in blockchain technology and its applications, driven by its potential to increase efficiency and reduce costs.
Increasing investment in XLM and other cryptocurrencies, driven by their potential for long-term growth and returns.
Market Sentiment:
Bullish sentiment: 75%
Bearish sentiment: 25%
Neutral sentiment: 0%
Please note that this is a general analysis and not personalized investment advice. It's essential to consider your own risk tolerance and market analysis before making any investment decisions.
Take advantage of the target and get away 🎯 Swing Traders Please reserve the half amount of money and watch for the next dynamic level or order block breakout. Once it is resolved, we can go on to the next new target in our heist plan.
Keep in mind that these factors can change rapidly, and it's essential to stay up-to-date with market developments and adjust your analysis accordingly.
💖Supporting our robbery plan will enable us to effortlessly make and steal money 💰💵 Tell your friends, Colleagues and family to follow, like, and share. Boost the strength of our robbery team. Every day in this market make money with ease by using the Thief Trading Style.🏆💪🤝❤️🎉🚀
I'll see you soon with another heist plan, so stay tuned 🫂

XLMUSDT 1DXLM ~ 1D
#XLM At Time Frame 1D Forms a bullish Flag. Buy after breaking through the resistance of this pattern. Minimum target 20%++

XLM/USD: Signs of Overextension and Impending CorrectionStellar (XLM) experienced a dramatic surge, skyrocketing from $0.09 on November 7 to a local high of $0.63 on November 24. This rapid rise of over 600% in just a few weeks indicates clear overextension in the market. Such sharp upward movements are often unsustainable without periods of consolidation or correction.
Current Market Context:
Current Price: $0.48
Recent High: $0.63
Key Support Levels: $0.36, $0.25
After hitting $0.63, XLM has pulled back to $0.48, a strong signal that the market may need a correction to stabilize. This retracement reflects profit-taking and waning momentum, both common after such parabolic moves.
Possible Correction Scenarios:
Moderate Pullback to $0.36:
The first likely scenario involves a pullback to $0.36, a key support level that aligns with previous consolidation zones. This would allow for healthy price action and create a foundation for future bullish attempts.
Deeper Correction to $0.25:
If selling pressure intensifies, XLM could retreat to $0.25, representing a more substantial correction. This level is critical for maintaining a broader bullish structure and could attract buyers looking for value.
Market Indicators:
The RSI (Relative Strength Index) shows signs of overbought conditions, suggesting further downside pressure.
Volume has also declined since the peak, indicating weakening buying interest.
In summary, the overextension from $0.09 to $0.63 signals a market that may need to cool down. The current decline to $0.48 underscores the likelihood of a correction, with key support levels at $0.36 and $0.25 in focus. A healthy pullback could reset the market for a more sustainable rally in the future.

XLM and the potential 560 Risk to reward Opportunity Hi Everyone;
today we have one of the best risk to reward Investment opportunity
it is more than 560 times the risk and the chart is look very promising.
I expect breaking the previous bear market key point will clear the way to the final target

Be patient with XLMUSD, it's time will comeHello everyone,
today I choose to talk about XLM.
Many consider it a dead coin, since it did not make a new ATH in 2021. But I prefer trading with verified coins that have been around for long enough to establish patterns in their charts. And I trade based on these patterns.
This is a weekly chart of XLMUSD.
It is one of the sleepiest coins. But when it wakes up, it is a rocket.
How to read my chart:
- When XLM is in bull market, it respects 21 weekly EMA -> price action above it. (arrow up)
- When XLM is in bear market, it respects 21 weekly EMA -> price action below it.
- In accumulation, price action plays with 21 weekly EMA, goes above it then below, then again above it, and below... (rectangle)
Sure, this does not help, right. How could you know if we are still playing with 21 weekly EMA or is this cross above start of parabolic rise. Well, the answer lies in RSI.
XLM goes parabolic once weekly RSI crosses above 70 (circle). We are not there yet so I do not expect fireworks tomorrow. Remember, XLM is one of the last ALTs in the bull run to wake up, that is why its bull runs are so violent. Because once it wakes up it makes up for all the sleeping in matter of few weeks.
More info on XLM:
- XLM created its base (red line). It has respected it since 2018. It has touched it in 2023 and 2024.
- People think XLM slept through 2023 bull run and hence is dead. But the fact is that the 2023 bull run is still not over and XLM will mark the end of it with its parabolic run.
I have started to slopwly accumulate XLM with the money gained from BTC and other ALTs that have already surged.
XLM potential is from 5x to 15x. You choose and determine where you want to take profit. BUT MAKE SURE TO TAKE THE PROFIT!
And remember: If you buy low, you do not need coin to break ATH to make substantial amount of money. Buying price is much more important then selling price.
Good luck.
P.S. Check my other posts. If you find value in my ideas, boost and share them.
If you want to stay notified, follow me.

Ripple “protégé” - Stellar is also trying to rise in XLM priceWhile encouraging news is starting to circulate around #Ripple and the price of OKX:XRPUSDT is slowly getting off its knees, by the way, a month ago we came up with an idea for CRYPTOCAP:XRP 👇
The #Ripple “protégé” #Stellar is also trying to rise in price a bit.
For two years, the OKX:XLMUSDT price probably formed a Double Bottom pattern. And for the next 1.5 years, the #XLMUSD price will be able to work out the goals of the pattern:
1️⃣ target - the base of the Double Bottom - $0.195
2️⃣ target - growth in the region of $0.64-0.65 for CRYPTOCAP:XLM by the end of 2025.
But under the current conditions, we do not believe that CRYPTOCAP:XRP can cost $10, and CRYPTOCAP:XLM more than a dollar. Unless they arrange denomination in projects 10-100 times or something?)

XLM USDT#XLM on weekly time frame: After a successful breakout from a zone marked in green, we will see massive gains. We could take entry after 4 hours or Daily candle close above the marked zone. Always use stop-loss. Everything is on the chart.
Entry 0.1795
S.L 0.1450
T.P1 0.2418
T.P2 0.3504
T.P3 0.4358

XLMUSD descending triangle - SHORT (NEW)XLMUSD looks ugly , not different than other coins.
The price broke to the downside of the descending triangle pattern.
We already saw a successful bearish retest and previous support now is acting as a resistance. We're expecting 18- 20 % dump soon.
Target shown on the chart.
Good luck!
