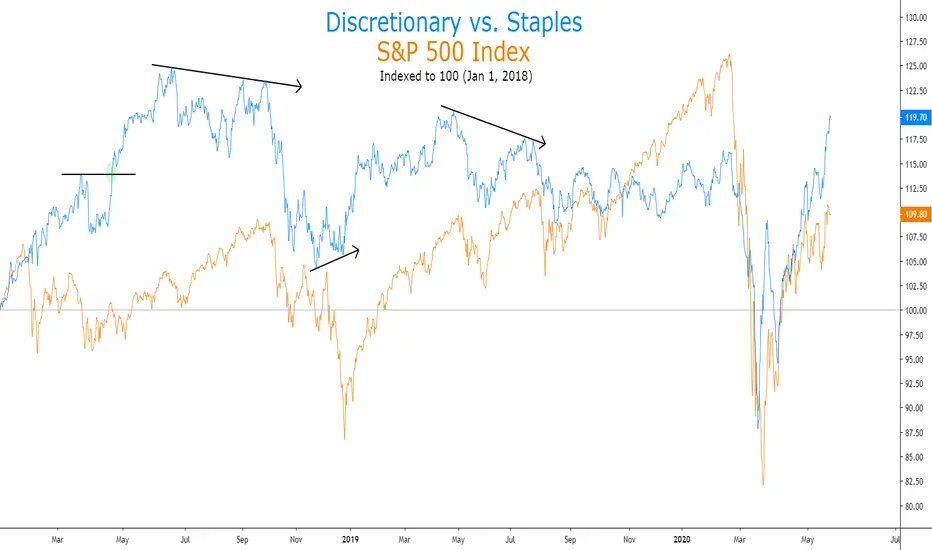
Is This Bullish or Bearish? Remember that narratives will be constructed every day in financial media based on emotions. The problem with this strategy is that they have already happened! It has already shown up on the chart. So today, we are going to look at one of the most important intermarket relationships. That is Consumer Discretionary vs Consumer Staples, or XLY/XLP. Let’s hop onto the chart.
So what are we seeing here? Well the first thing that should catch your eye is the all time high. We love all time highs! They are bullish. When XLY is outperforming XLP on a relative basis, this is a “risk on” environment. The other thing we see is the overall bullish trend of higher highs and higher lows.
Then we see the bearish divergence. Some people tend to think that a bearish divergence will cause a trend change, but when the overall trend is bullish, we have to remember that these usually just produce pullbacks and then the trend continues. So while this chart is bullish, we can wait and watch while the higher low forms. When the higher low forms, that is confirmation the "risk on" environment is alive and well.
Keep this relationship in you back pocket. It is a great one to help you navigate the narratives of “the consumer is in bad shape”. If XLY is outperforming, the market is telling you otherwise. We would rather listen to the market than someone on CNBC.
Happy Trading!
XLP

ridethepig | Banks vs Utilities It ought to be known by everyone that it is necessary in certain recessions for dead cat bounces and over a typical 5 quarter economic cycle down, it is not uncommon for 1 or 2 of those quarters to be bullish. I suspect that the strength around all the discounted earnings from August is mostly baked in now.
The concern, in the MT and LT, is the 2's 5's screaming recession is not over. Such a devastating blow that will have appeared too simple for many participants as Central Banks did not allow the manoeuvre to unfold yet. Here sellers should try to seize the lows; no matter how risk free the current environment may seem; confidence is damaged and civil unrest is in the game. I do hope my judgement of this is not over will be proven wrong, and that it really is different this time.
As usual thanks for keeping the feedback coming 👍 or 👎


Risk Gauge Reaches ResistanceConsumer Discretionary vs. Consumer Staples remains in "risk off" mode.

ridethepig | Consumer Staples (Chapter 2)The following diagram illustrates the breakup of a globalisation advance:
Since the retrace in VIX has found a hard floor into the 25 lows, we may characterise the advance as an endgame for our economic cycle purposes.
Now the erroneous nature of Volatility advancing can be seen. The effect of demobilising the consumer will weigh heavy on Equities, not to mention how companies position capital more defensively going forward.
Consumers are uncomfortable (at least from Q3/Q4 onwards) right on time for the stimulus to fade.
The following swing, which will also be quoted in the previous leg in DAX is another example. I will go over the flows briefly at this point:
Equities have now lost all sense of reality, the concussion in addition to Fed conceding far too much mobility; so this may rightfully be classified as the end of an economic cycle, or at least until capitalism returns from its sabbatical.

RatiosWith XLY vs. XLP on everyone's radar as it eyes new highs, what is Industrials vs. Staples saying about the strength of this risk on rally?

Online RetailCOVID-19 resulted in Online Retail ETFs reaching new all-time highs on a relative & absolute basis.
Online Retail/SPY has been known to move similarly to CD/CS.
We've seen CD/CS break diagonal resistance, but remains below its June 2018 ATH.
EW CD/ EW CS is still heavily lagging and well below its June 2018 high

Staples vs. DiscretionaryXLY vs. XLP
Trading above its March high, would like to see the diagonal trend line break to the upside in support of the bull case

OPENING (IRA): XLP JAN 17TH 52 SHORT PUT... for a .40 credit.
Notes: Another "not a penny more" short put with a resulting cost basis of 51.60/share if assigned. As with my XLU and HYG not a penny mores (See Posts Below), will look to roll "as is" for a credit on at least a quarterly basis until assigned or that's no longer productive. Current yield of 2.99%; $178 annualized on a one lot ... .
This trade kind of rounds out what was on the remainder of my IRA shopping list which has focused on dividend yielders like IYR, HYG, XLU, and XLP. I'm already in IYR covered calls and in HYG and XLU short put plays.


$SPY LONG-TERM OUTLOOK ... STILL (BEARISH!)Before we get started, I just wanna say that the method used here is an extension of an article written in 2015 on Stockcharts called "This Signal Is Bullish And Rarely Fails". Worth a read to better, it's a short article with more depth, but the forecast is outdated.
In short: Consumer sentiment always leads the Stock market.
Okay, so what's going on here? Someone once asked me about consumer spending "growing" that keeps getting reported in the news every day in relation with the GDP...
Well, the GDP "numbers" are always a lagging indicator to an economic down turn. As for the consumer spending, that is where this chart comes to play. The idea is that we're charting the orange line with XLY (Consumer Discretionary - Things you WANT (like an x-box)) / XLP(Consumer Staple - Things you NEED (like soap)). So if the slope of the line is positive (all the green lines) then people are spending on things they WANT and not just NEED, hence signaling a positive sentiment in the economy and therefore we should expect a stronger market. Well if that's the case, then the opposite is also true. Meaning, if we have a negative slope (black lines on the XLY/XLP chart) this is signaling that there is a weakness in the economy and therefore we should expect a weaker market. However, this sentiment doesn't always go hand-in-hand with the market and ends up creating DIVERGENCES (shown in the chart) all of which have been leading indicators to past recessions and nowadays we have another NEG DIVERGENCE looming around. And as you can see, the consumer sentiment always turns before the market bottoms or peaks.
Also, some people have argued that we've been in a recession that started late last year around the time SPY broke below the trend line from the 2009 lows.
Remember that this is only one of the many red flags out there (Feds cutting rate, QE4 (or whatever you wanna call), BREXIT, The Deal, Hong-Kong (it's still happening)) that have kept me bearish on the market for while and that this analysis in not trying to 'time' the market, only predict the direction. As always...
***Let's talk about it...***

Interesting divergence SPY/XLYI was messing around with my charts and noticed that SPY and XLY (Consumer Discretionary) are diverging. Looking back in time - with the exception of one littler divergence a couple years ago - I can't find anywhere else this has happened. Is this maybe a sign that the consumer is getting overly confident? When fear is turned off, things eventually get out of control.
The other thing I noticed is that XLP (Consumer Staples) is gapping away from SPY and XLY to the upside. Guess when the last time XLP gapped away from SPY and XLY?? Yep, you guessed it! It was last year right before the market tanked. This would also (maybe) be a sign that consumers are getting overly confident.

XLP 200MA Trade and Seasonal DefensiveXLP has bounced off the 200MA. The last two moves pushed slightly through it, like this one, and the subsequent ramp was at least to the previous high (Feb-Mar) if not higher (Jan). The 2018 price/action below the MA shows this stock does take that indicator into account.
The recovery looks to be finishing the final sub-wave of W3. March shows a slight pullback, so entering at 57 with a 1% stop (56.45) and a target of 59 (Jan 18 ATH) gives an RR of 3.64.
XLP is of course a seasonal defensive.

EPISODE 8/11: US CONSUMER STAPLES:WAVE+CHANNEL&INDICATOR TA(XLP)Episode 8/11 : US (SPX) Sectors Technical Analysis Series - 18th of July 2019
Brief Explanation of the chart:
XLP : Consumer Staples has relatively been one of the worst performing sectors since the last recession. However, recently due to the many uncertainties in the economy(US/CHINA Trade relations), staples have performed quite well (+18.1% for 2019 so far) .
Moreover, this newly found bullish strength can be observed in the Monthly breakout from the RSI/MACD divergence . The potential upside would be in the range of 65-75$ based on Wave 5 variations . There is one major structural support which is marked by the purple square( range of 48-51$) .
Key note from this technical analysis is the growing volume, which can be an indication of several factors. The most outstanding factor to me would be the recent growth in volume . This means that there is an increasing number of investors who are looking for "defensive" stocks that primarily constitute the staples sector. Obviously, this is not a good sign for the future of the economy.
This is just a brief "free" and very detailed analysis. Perhaps in the future I might form a premium group, to whose members I will provide all the details of my research.
>>I do not share my ideas for the likes or the views. This channel is only dedicated to well informed research and other noteworthy and interesting market stories.>>
However, if you'd like to support me and get informed in the greatest of details, every thumbs up or follow is greatly appreciated !
-Step_Ahead_ofthemarket-
Check my Previous episodes on the US Sectors:
EPISODE 7 : US CONSUMER DISCRETIONARY( XLY) :
EPISODE 6 : US MATERIALS ( XLB ):

Business cycle update - More outperformance of defensivesDefensives XLP, XLU, and IYR should continue to outperform

Sector rotation Cyclical to Defensive I heard some interesting commentary this week from the pros about watching for signs in the cyclical:defensive sector ratio.
I put together this chart using (XLK+XLI+XLB)/(XLP+XLU+XLV).
It is a composite of tech, industrials and materials indexes as a ratio to staples, utils and health sector indexes.
The chart ratio is about 1:1 right now.
In a late stage economy if earnings expectations plunge in the cyclicals the chart ratio should show the capital rotation into the defensive sectors.
Worth watching for a signal!

Quadruple bottom!!!!!!! What the ___ ? I don't think I've ever seen this. Either, BUY BUY BUY!!!
Place your stop accordingly

Why The Yield Curve Matters To Utilities & Other Bond ProxiesThis chart of the U.S. 10s/2s curve and the SPDR S&P Utilities Sector ETF (XLU) is interesting. A few days ago, I was reading a blurb by a well-known outlet about utilities getting "smoked" during the Q4 equity route. Like above, performance is relative to time frame. Additionally, you have to have a deeper understanding about what XLU is and what it can do.
It's not enough to just assume utilities as "defensive" thus it protects you from a broad equity sell-0ff. This also coincides with some questions I get from subscribers: why advocate holding XLU and TLT?
Yes, XLU is a bond proxy but it is not a bond. Its underlying is composed of equities. The TLT is composed of U.S. 7-10 year treasuries.
They both perform well under low interest rate environments when yields trend lower. However, keep in mind that the XLU is still equity-based and won't protect you fully.
Notice, XLU didn't blink until the 10s/2s began to steepen. It's been gung-ho since the curve flattened out. And if we went back through periods were the curve began to steepen, it effected other bond proxies much more dramatically like REITs.
Flattening of the curve isn't the issue unless you're financials. It's the massive steepening caused by the Fed cutting interest rates that kill markets.

Business cycle points to outperformance of XLP Relative performance of defensive sectors XLP, XLU and IYR vs SPY.
XLV performance did not follow a cyclical pattern
Best fit suggests outperformance of XLP vs SPY in coming months

Long Consumer StaplesSome new bullish signals for Consumer Staples sector:
Solid Price action over SMA(20d) and SMA(50d).
SMA(20) crossed the SMA(50) the last days of the past week (Golden Cross!).
A good strategy to go long is to wait for a correction around the SM(20d).

Not something bulls want to see!S&P 500 $SPY vs consumers staples $XLP falling off a cliff just isn't something bulls want to see.

Signs of Caution from Consumer ETFsConsumer Staples (usually a defensive investment) are taking precedence over Consumer Discretionary (usually aggressive posture, when all is well) in October. We are pressing lower and showing the largest drop in a while. This is potentially a leading indicator of some kind of slowdown coming.
