$RUT H&S (Bearish Reversal)It's worth remembering that all the economic data coming out (retail sales, payrolls, etc.) showing month-on-month rate of change looks pretty different on a year-on-year basis.
XLV


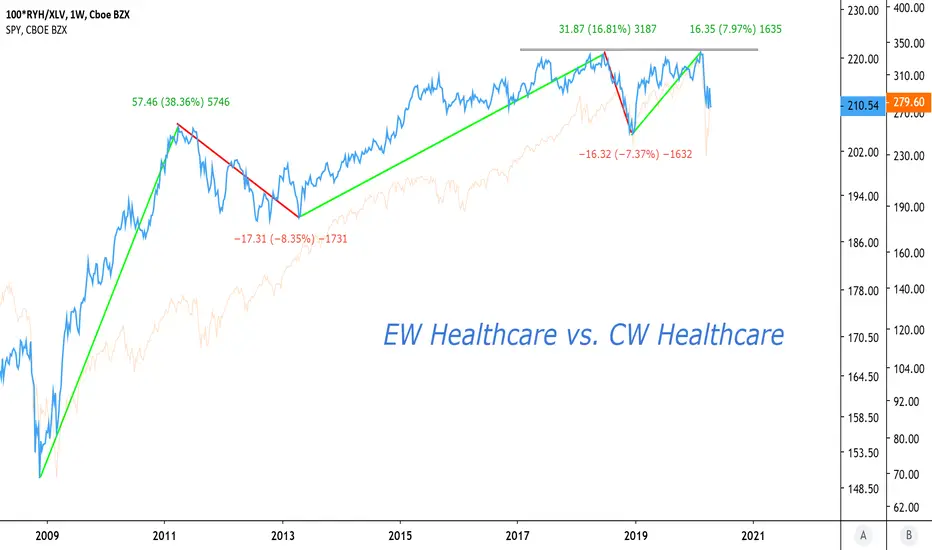
EW HealthcareLook how RYH (EW Healthcare) performed relative to XLV (CW Healthcare) after the market bottomed in 2009? Interesting, since inception the EW ETF is crushing its Cap weighted cohort
S&P Biotech vs. S&P PharmaceuticalsThe 2 strongest industries within HC - would like to see momentum confirm the move higher.

SPDR Healthcare Sector XLV: Retest of $79 for buying opportunityVideos posted below! Have a great day


Staying short the XLV Caught between the 100 and 200day SMAXLV likely continues downward price action with Bernie continuing his strength towards the democratic convention. Just my opinion.
XLV

XLV breakout? Watch retest, quite possibly a fakeout.Healthcare is mirroring 2015-2016's triangle breakout pattern here with an obvious move above the trendline. LOTS of people see this, and there are many people viewing this as a repeat of the post 2015 rebound. I'm not totally sold on that scenario however. 2015-2016's healthcare consolidation saw a lot of frauds busted and companies deflated. Currently, we do not really have that environment to rebound from aside from the pharma companies who are going to be taking hits for opioid litigation, and we're facing some major political headwinds. While I can see some recovery from opioid settlements, I don't think we're past that as a risk quite yet, and we're coming to face other risks from the political process.
With that said, I DO like healthcare. It tends to be less cyclical than other sectors, and unlike utilities & reit's, this defensive sector isn't going to kill you if we see a return to inflation / reflation at any point.
Watch the breakout for a retest, and keep an eye on what it does. Markets love to fake people out, especially when everyone and their mother is seeing a repeat of previous patterns in play.

Healthcare Defensive at limitNote the pullbacks are always around Dec-Jan as well. Strong candidate for shorting here, and tends to come off fast.
Sell 104, SL 106.50, TP 96, RR 3.2.

XLV - DAILY CHARTHi, today we are going to talk about Health Care Select Sector SPDR Fund ETF and its current landscape.
The opioid crisis has been plaguing the U.S at the most for nearly two years now. With scary numbers like the record of 47,600* overdose deaths caused by opioids in 2017 but the number seems to start slowdown since 2018 were the war against opioids gained some traction.
In the justice field, some companies have already faced some sort of rebuke for involvement and even a bit of responsibility for the opioid crisis. For example
*Jun 2019, Insys Therapeutics Inc. had to file for bankruptcy after being convicted for conspiring to bribe doctors to increase opioid sales, ending up in a deal with the federal government of $225 million.
* Aug 2019, Johnson & Johnson was obligated to pay $572 Million, as Oklahoma ruled that the company intentionally played down the dangers and oversold the benefits of opioids.
* Oct 2019, Johnson & Johnson was once more condemned by two counties of Ohio to pay $20.4 million, with the accusation of having helped the opioid crisis to spread.
Now, that several healthcare companies are under investigation by the Federal Prosecutors in Brooklyn, into whether the company intentionally permitted that flood of opioids on the community. For now the U.S. Attorney’s Office in the Eastern District of New York it's just issuing subpoenas, but if they case sticks we might see what the murders of Julius Caesar saw, a pile of fire and anger from the people, so big that like Caesar butchers that were cast out of the city, the companies involved on this process can be drowned in liabilities and fines with the risk to be so badly damaged that may have the same fate of Insys Therapeutics Inc.and might hit this ETF that holds great exposure in the sector. The war against opioids it's just poised to grow up as every justice department across the country and every candidate that it's next to run on elections its eager to hang this trophy on the wall.
*Source: Centers for Disease Control and Prevention (CDC)
Thank you for reading and leave your comments if you like.
To have access to our exclusive contents, join the Traders Heaven today! Link Below.
Disclaimer: All content of Golden Dragon has only educational and informational purposes, and never should be used or take it as financial advice.

Cardinal Health // Pre-Golden-cross
A golden cross criteria is met when the 50sma crosses the 200sma in an uptrend. We might see it happen on CAH soon.
We see a potential flag with $52 resistance up-top.
OBV sustaining the chart's price.
RRR is good @2.5
*Check chart for more details

Abbvie brakes 200SMA ABBV is currently breaking the 200sma, ending a 14 month downtrend.
On the next days I will be tracking the next tools:
OBV should trend higher to confirm this new uptrend. It still has not done that.
3 candlestick closes above the 200SMA would also be a confirmation signal.

Cigna to $165? Sentiment Change?Possible healthcare sentiment change, at least for the short term.
Long position into $165 area.
Good-luck. (Not trading advice, any decision you make is yours alone).
CI


EPISODE 4/11: US HEALTH CARE XLV SECTOR-TA(TREND ANALYSIS) 2019'EPISODE 4/11: US HEALTH CARE(XLV) SECTOR Technical Analysis - 16th of July 2019.
There is really not much to say. Profits in the health care sector are very reliable on the cycle. Since Trump took office, the cycle extended, and hence it formed a channel as noted in the analysis.
One major risk that has always affected the health care sector is regulation and political pressures . In the upcoming 2020 election, if the Democrats(pro-regulation) take office, there might be major implications to the health care sector.
In any case, 50 Quarterly/200 Monthly MA(Orange line) would be the Long-term Supports , in case the current bullish channel breaks. Structural supports are marked with Purple squares.
This is just a brief "free" and very detailed analysis. Perhaps in the future I might form a premium group, to whose members I will provide all the details of my research.
>> I do not share my ideas for the likes or the views. This channel is only dedicated to well informed research and other noteworthy and interesting market stories .>>
However, if you'd like to support me and learn more in the greatest of details , every thumbs up or follow is greatly appreciated !
-Step_Ahead_ofthemarket-
Check my previous episodes on the US Sectors in the links to related ideas down below .
EPISODE 3 : TECH
EPISODE 2 : ENERGY
* Full Disclosure: This is just an opinion, you decide what to do with your own money. For any further references- contact me.

$UNH Healthcare Breakout Go long healthcare if anything in this market. Clear breakout signal. UNH XLV CI

THE WEEK AHEAD: GDXJ, GLD, GDX, SLV, XLVEARNINGS
No options highly liquid underlyings announcing earnings this week.
BROAD MARKET
EEM (35/19)
QQQ (23/20)
IWM (21/18)
SPY (21/15)
EFA (15/12)
SECTOR EXCHANGE-TRADED FUNDS
There's gold premium to be had (in them there hills ... ), particularly in the miners:
Top 5 By Rank: GDXJ (86/36), GLD(86/16), GDX (63/30), SLV (62/20), XLV (60/15).
Pictured here is a delta neutral GDXJ short strangle in the August expiry, paying 1.28 (.64 at 50% max), break evens at 30.72/40.28, and delta/theta metrics of -2.5/2.9. For those of a defined risk bent, the August 16th 29/32/38/41 is paying .92, with break evens at 31.08/38.92, and delta/theta metrics of 1.08/1.02.
The XLV August 16th 88/97 short strangle is paying 3.10 at the mid, but the markets are so wide, I'm not sure how that'll price out in the New York session. Moreover, the background implied is about that of the broad market (15 versus SPY 15), so I'm unsure of whether that's worth pulling the trigger on even if markets tighten up, even though implied's in the top half of its 52-week range.
IRA TRADES
This has been a tough market if you're looking to acquire either broad market (e.g., SPY), bonds (e.g., EMB, HYG, JNK, TLT), or other divvy generating underlyings (e.g., IYR, XLU), with your basic options being to (a) wait for lower; (b) sell "not a penny more" puts and get paid to wait; or (c) throw some caution to the wind, take some risk, and sell closer to at-the-money and manage those trades reactively (i.e., rolling out for credit, duration, and cost basis reduction). I've opted for a few "not a penny mores," although the return on those isn't all that compelling even though it beats the basically 0% you get for staying in cash. (See, e.g., the HYG, SPY "Not a Penny More" Trades, below). Given my particular proximity to retirement, I'm not all that keen on acquiring a bunch of stuff at near all-time-highs, so I'm pickier and probably way more risk adverse than most, so naturally the "Not a Penny Mores" will not be for everyone since you're tying up quite a substantial piece of cash secured buying power to generate fairly mundane returns.*
But just because I've kind of thrown in the towel over acquiring stuff in the short to medium term doesn't mean I'm not managing what's already there. Inevitably, there's always a covered call that may need to be looked at and/or a hedge that might be sensible to erect to cut covered call net long delta that is inevitably there. (See, e.g., Overwriting Post, below).
* -- Although it's apparent that you can collect sufficient premium to emulate or exceed the dividend returns on some of these underlyings without actually being in the stock itself. It kind of begs the question: "Why be in stock at all?"

Example of a false golden crosstechincally 50 may cross above, with both MAs pointing downward. Large bear flag on the weekly chart. $XLV $STUDY

Sector rotation Cyclical to Defensive I heard some interesting commentary this week from the pros about watching for signs in the cyclical:defensive sector ratio.
I put together this chart using (XLK+XLI+XLB)/(XLP+XLU+XLV).
It is a composite of tech, industrials and materials indexes as a ratio to staples, utils and health sector indexes.
The chart ratio is about 1:1 right now.
In a late stage economy if earnings expectations plunge in the cyclicals the chart ratio should show the capital rotation into the defensive sectors.
Worth watching for a signal!

XLV recovering for SummerXLV pulled back sharply largely to do with a knee-jerk reaction to the Dems ‘Medicare for all’ (ie Europe-style government health service). Contrast this to the general Dec 2018 market collapse, and we see
- a 7.2% W1 rise
- a 50% W2 pullback
- a W3 repeating the move, and running to the 1.618 fib
The price carried on after December, but just anticipating a repeat of that move gives us an entry at 87.75 for 94.00. A 1.4% stop is comfortable (86.50) to give a 5:1 trade.
Healthcare is a typically strong summer defensive, and notably (on the daily chart), after the outlier of Dec 2018, kept in its long-term channel in the April collapse.

Time to Accumulate MylanShares of generic drug manufacturer Mylan has become very attractive, especially after today's overdone selloff.
While the company has some hurdles legally (what drug company doesn't?) and has some internal housekeeping to tend to, the shares are becoming too cheap to pass up. At the time of writing, shares are trading at $23.30, down about 17% on the heals of it's latest earnings report. I don't believe this sort of selling is warranted but it gives value investors an attractive entry point to begin accumulating shares.
It's blown thru supports, such as the 61.8% retracement (dark blue line) of a multi-year climb higher and some previous major resistance-turned-support levels (white dashed lines), which I've left on the chart for reference. The recent bounce gave some extensions to use, but today's selloff has pushed shares right past the first one, the 127.2% extension at $24.39. The next extension, the 141.4% at $21.75, is interesting because it coincides closely with the 78.6% retracement of the aforementioned multi-year swing higher at $20.63. Should those fail, we have one last extension to target, the 161.8% extension at $17.95.
In essence, I'm buying a starter position today and will be adding if it dips to the lower levels, which really should be viewed as a major support zone between $18 and $21.
With so many patents expiring for blockbuster drugs, Mylan will soon be able to pump out cheaper generics of them and they have an excellent track record of cranking out pills that are in demand.
It'll be important to watch the headlines on this one, as there are legitimate concerns, but with P/E's at 5.3x next years estimates and 5.0x 2020 estimates, this is just too cheap to ignore.
Be sure to have a game plan, including a stop loss appropriate to your risk tolerance (say, a back-to-back weekly close below $17.95, or a percentage you're comfortable with like -10%).
Once I see some sustained uptrend taking place, or a major change in my thesis, I'll let you know! Until then, happy trading!

UNH New "Temporary" Up Trend - Safety/Value Play-$250 ResistanceUNH and other healthcare stocks such as Anthem, Cigna, etc. could be a potential area that benefits from those flocking from higher volatility areas that have earnings this week that are looking for some high quality value that were once "growth" stocks. I think UNH at least goes back to $250 area within the next week or so. I'm holding call options. Good luck! UNH

#XLV Healthcare ETF-first out to activate it's head&shoulder?#XLV Healthcare ETF-first out to activate it's head&shoulder?
