XLV Day Trade SHORTWill health care be strong during the potential draw down in the markets?
Day traders would know what to do with this short opportunity. Longer term maybe a little down side..
It's out there so we will see..
Trade Safe
AMEX:XLV
XLV

Biotech name using fib extension and support/resistance levelsACAD
100% fib extension coincides with resistance level from ER gap down at the end of February.
Stock has not only weathered the recent market sell off but also printing a bull flag.
Anticipating a continuation of advance coupled with increased volume.

Confidence and A Conditional Reprieve Amid Oversold LowsAT40 = 11.7% of stocks are trading above their respective 40-day moving averages (DMAs) (hit an intraday low of 9.4%, oversold day #3)
AT200 = 32.3% of stocks are trading above their respective 200DMAs (intraday low of 30.0%)
VIX = 21.3 (a decrease of 14.7%)
Short-term Trading Call: bullish
Commentary
AT40 (T2108), the percentage of stocks trading above their respective 40-day moving averages (DMAs), fell as low as 9.4% on Friday. AT40 dropped as low as 8.6% intraday during the February swoon (February 9, 2018 to be exact). Since 1986, AT40 has closed below 9.4% only 92 trading days, and AT40 last closed below this level on January 21, 2016 at 8.3%. The day before that, AT40 closed at 7.4% and traded as low as 3.8%. AT40 obviously cannot trade much lower than these levels.
AT200, the percentage of stocks trading above their respective 200DMAs, is very important now as an oversold gauge. AT200 closed the week at 32.3%. In January, 2016, AT200 managed to get as low as 9.0%, a level last seen around the historic March, 2009 bottom. In other words, while AT40 suggests the market is set up for a sustained bounce, AT200 reminds me that these oversold extremes can get yet more extreme if panic gets a fresh heaping of fuel.
Trading action around important technical levels also remind me that the market could go lower. The S&P 500 (SPY) is essentially back to flat for the year but is still 7.2% above this year’s double bottom. A retest will be in play if the index fails to win what is perhaps the stock market’s most important battle: a test of 200DMA support. During the February swoon, the S&P 500 only ONCE closed below its 200DMA. The index closed below its 200DMA on Thursday and set up Friday’s drama. The index gapped up just above its 200DMA in an effort to clear out bearish sentiment. Sellers quickly closed the gap and then failed to take the index lower. Buyers fought off a test of the intraday low and managed to churn the index toward the day’s open for a 1.4% gain on the day. It was a messy way to demonstrate the importance of the 200DMA! If buyers can follow through early this coming week, the technical pattern will look like a (short-term) washout of the market’s most motivated and panicked sellers. I call this a conditional reprieve in the middle of oversold conditions because of the criticality of this 200DMA pivot.
{The S&P 500 (SPY) closed right on top of its 200DMA support after sellers almost ruined an opening gap up.}
The NASDAQ had a battle similar to the S&P 500’s; the main difference came with an intraday pullback that did not create a complete reversal of the gap up. The Invesco QQQ Trust (QQQ) did not fully reverse its gap above the 200DMA. Its 2.8% gain on the day has the look of a successful, and bullish, reversal of a 200DMA breakdown.
{The NASDAQ gained 2.3% with a gap up and then close just below its 200DMA.}
{The Invesco QQQ Trust (QQQ) made a convincing leap with the reversal of the opening gap up only touching 200DMA support. QQQ ended the day with a 2.8% gain.}
While the big indices fared well at the end of the day, other indices did not. Their poor performance underlined Friday’s conditional reprieve. Some of these sectors need to wake up to help the stock market mount a credible and sustainable bounce out of oversold conditions.
The faders managed to keep these indices plastered with bearish sentiment. The iShares Russell 2000 ETF (IWM) closed flat after sellers completely reversed the opening gap up. The Financial Select Sector SPDR ETF (XLF) suffered a similar fate. This disappointment was even more critical given the wake of bank earnings from the likes of JP Morgan Chase (JPM). The iShares US Home Construction ETF (ITB) held no pretense of recovery as its fade resulted in a 1.0% loss and fresh 17-month low. ITB has dropped 17 of the last 18 trading days in a sign of a near complete market retreat from home builders.
{The iShares Russell 2000 ETF (IWM) ended the day flat as it clings to the starting point of the big May breakout.}
{Bank earnings failed to save Financial Select Sector SPDR ETF (XLF). Sellers faded the opening gap up to a flat close on the day. At least buyers were able to bounce back from a fresh 2018 intraday low.}
{The iShares US Home Construction ETF (ITB) continued its epic slide with an 18th straight down day. The 1.0% loss closed ITB at a 17-month low.}
As suggested by the breadth indicators, the sell-off is causing broad damage. The Health Care Select Sector SPDR ETF (XLV) had a solid uptrend coming out of the February swoon. XLV even broke out to a new all-time high in late August. Last week, XLV broke down solidly below its 50DMA support and nearly reversed all its gains from the breakout.
{The Health Care Select Sector SPDR ETF (XLV) gained 1.5% in a return to the lower Bollinger Band. A 50DMA breakdown is not confirmed.}
The volatility index, the VIX, dropped 14.7% to 21.3. The intraday high failed to top Thursday’s intraday high: a small positive for volatility faders. Still, the VIX is still considered elevated given its perch above 20.
{The volatility index, the VIX, remains elevated despite a 14.7% pullback.}
The VIX typically serves as a gauge of fear on the high side and complacency on the low side. If we had an equivalent for government economic policies, say a “GIX”, the GIX might be at record lows. Confidence is of course half the battle of economic performance and confidence is tangibly oozing from D.C. (from one side anyway!). With consumer confidence at record levels, unemployment down to historic levels, and economic growth impressively strong, the rhetoric accompanying policymakers represents a euphoria perhaps only matched by the complacency of the “Great Moderation” when the Federal Reserve (mostly under Chair Alan Greenspan) was heralded for ushering in a time of lasting economic prosperity…just ahead of the Great Recession. If you knew nothing about economics, you might conclude this time around that the U.S. really has figured out how to repeal the laws of economic cycles.
In particular, Larry Kudlow, the leader of President Trump’s National Economic Council, is beating a steady drum of unapologetic and triumphant confidence. In a CNBC interview, Kudlow issued a sound bite that *I* am confident will one day in the not-so-distant future sound cringeworthy to those of us who follow economics. Kudlow declared: “We are in a hot economic boom. There’s no end in sight.”
Other key points from this interview…
Not worried about the Fed killing the economy. It has staying power. {Me: This message is consistent with Treasury Secretary Mnuchin’s reassurances about monetary policy. Contrast these claims with President Trump’s worries over rate hikes.}
Biggest blue collar employment boom since the 1980s.
In 2018, U.S. entered an economic boom that no one thought was possible.
Loves the skepticism. Proved the skeptics quite wrong. Don’t think that’s going to change.
I fully understand why Kudlow is blowing the trumpets and beating the drums. For example, the display is an “eye-for-an-eye” response to the shrill skeptics who denounced the policies that helped kicked the economy into a higher gear. However, as an investor and particularly as a trader, I cannot help but think about the contrary implications of important government officials claiming that the economic good times will continue as far as the eye can see. Such claims defy experience and the laws of economic/business cycles. Such claims help form a foundation of hubris which can lead to policy errors. My unavoidable wariness feels even more poignant when in parallel I stare at charts showing a stock market violently and sharply falling off its all-time highs. I am not worried about over-optimism today or this quarter, but it is something that makes me stand up and take notice. (At the end of the chart review, I include a link to a Bloomberg Politics video for more context on Kudlow’s economic triumphalism).
For now, I am keenly focused on my strategy for trading oversold market conditions. The stock market is on day #3 of oversold conditions. The average oversold period lasts about 5 days and the median is around 2 (50% below 2 and 50% above 2). At the current oversold depths, it could easily take another 2 or 3 days to climb out of trouble. The longer an overperiod lasts, the more bearish the implications. Similarly, the more frequently the market returns to oversold conditions, the more bearish the implications. The drama at the 200DMAs is extremely important context for these bearish implications. A stubbornly oversold market with an S&P 500 and NASDAQ below 200DMAs is a recipe for fading rallies.
{Mean and Median Duration Below Given T2108 Threshold}
The drama at the 200DMAs made me a little less aggressive. I sold my S&P 500 call options immediately after the open. I added to my Caterpillar (CAT) put options. I took profits in other bullish positions. I selected two small fades with a short on Roku (ROKU) which was up as much as 10% at one point, and I bought shares in Direxion Daily Russia Bear 3X ETF (RUSS). On the bullish side, I doubled down on put options on the ProShares Ultra VIX Short-Term Futures (UVXY) and opened a calendar call spread on Nvidia (NVDA). I become an aggressive buyer of SPY and QQQ call options on a combination of indices trading well below their lower Bollinger Bands (BB), volatility surging, and AT40/AT200 reaching toward historic oversold lows. Again, with earnings season coming up, I am leery of taking on a lot stock-specific risk as part of the oversold trading strategy.

GILD for a Long PlayShares of GILD have recently broken out above resistance around $74 and have since successfully tested and held it as support (dashed green line) on two different occasions.
They look destined to at least test the falling trend line (red line), and I think there's a good chance we break through that resistance to establish a new trend higher.
I'm a buyer via calls, specifically the November $80 calls because they will carry me through the next earnings report. That's not to say I'll hold them through the release, but I suspect premiums will elevate leading in to the report and that should help bolster the bullish position.

IBB BreakoutIBB is breaking out to the upside, with an initial target around $124, the 127.2% extension of the major swing from this year's high in January to the lows in April, followed by the 161.8% at $131.
I'm jumping in via September $125 calls.

General Market OverviewThis video is the first of many, and I discuss the behaviors of the sectors and potential markets that are poised to trend in the near future. The "freshest" sectors quietly trying to start a new trend are the Industrial and Consumer Discretionary Sectors. The sectors (along with their industries) I think should be on every trend follower's radar are:
XLF - Financials Sector (including some real estate stocks): setting up to break out of its 5 month range; main movers are the bank industry (not the Goldman Sachs and Morgan Stanley kind of banks)
XLI - Industrials Sector: breaking out today with the possible trend beginning here in an unpopular sector; main movers are the service industries
XLK - Technology Sector: obvious uptrend that should be followed with caution, but is getting ready to continue; main movers are the software and IT services & consulting industries
XLP - Consumer Staples Sector: in early stages on uptrend with possible correction or continuation in the near future; moved by multiple industries
XLRE - Real Estate Sector: also in the early stages of possible uptrend; main movers of sub-sector have been REITs
XLU - Utilities Sector: also in the early stages of possible uptrend; main movers are electric utilities industry
XLV - Health Care Sector: uptrend already in motion with test of all-time highs today, with great potential for trend continuation; main movers are medical equipment and managed health care industries
XLY - Consumer Discretionary Sector: breaking out today with the possible trend beginning here in a sector where the media does not favor much; main movers are the apparel, discount, footwear and auto industries (mostly retail)
I am going to do more videos on how I diversify my portfolio, and how to create such a portfolio according to what is moving in the whole market so it would be great to get feedback from this video that I can include in those, and also ideas on material you would like to see more of!
Thanks, enjoy.

Death Crosses AboundA few sectors are signaling troubles ahead, with their 50 day MA's crossing below their 200 day MA's.
This chart picture shows SPY (upper left) as a broad gauge of market action. It has yet to experience the "death cross."
However, the industrial stocks measured by XLI (upper right), materials stocks measured by XLB, and financial stocks measured by XLF have all experienced the death cross. Given their importance as a proxy for future growth, this seems to bode poorly for broader markets.

The Stock Market's Time to Test Buyers' ResolveThe stock market put in a strong week as the bounce from lows and supports continues. Caveats are still glaring like low/declining volume.
The Stock Market's Time to Test Buyers' Resolve drduru.com $SPY $QQQ #VIX $AAPL $AMZN $IWM $BBY $BHP $CMG $XLI $XLV #AT40 #T2108 $DE $ITB $LGIH $MNRO $MTCH $NIB $RIO $X

THE WEEK AHEAD: OIH AND XLV PLAYSAlthough earnings season continues to drag on here, a small financial media theme has emerged in this sell-off and that's that "Earnings don't matter" ... at least, at the moment.
In keeping with that mini-theme, I'm looking at putting on plays in sector exchange-traded funds, and two of the ones that have been battered the most in this market have been OIH and XLV.
My tendency with petro in the past is to play it directionally, although I have dabbled with nondirectional setups like iron flies, short straddles/strangles as well. Both types of setups could be productive here due to the underlying's high implied volatility metrics, which were above 45% as of Friday close.
Here are two plays -- one directionally, one non- in OIH:
OIH Synthetic Covered Call
March 29th 26 short put
Probability of Profit: 53%
Max Profit: $271/contract
Max Loss: Undefined
Break Even: 23.29
Notes: Shoot for 50% max of the credit received.
OIH Short Strangle
March 29th 22/26 short strangle
Probability of Profit: 64%
Max Profit: $125/contract
Max Loss: Undefined
Break Evens: 20.75 put side/27.25 call
Notes: Also go for 50% max of the credit received.
The XLV Plays:
March 29th 75/87 short strangle
Probability of Profit: 57%
Max Profit: $250/contract
Max Loss: Undefined
Break Evens: 72.50/89.50
Notes: Go for 50% of credit received. The spreads are showing wide after hours, so you'll have to run this setup to see if it's worthwhile during regular market hours. My guess: it won't pay 2.50 at market open ... .
Synthetic Covered Call
March 29th 86 short put
Probability of Profit: 52%
Max Profit: $505/contract
Max Loss: Undefined
Break Even: 80.95
Note: As with the short strangle, showing bid 2.81/mid 5.05/ask 7.30, so the metrics will change at open.

Bounce Monday set upWell, at least not all sectors in out right sell mod coming into Monday. There is some hope the accelerated down trend will take a reprieve. I did for get to show XLF and XLB. They both are still lagging other indices. Bottom line XLU, XLK and XLE looking better. XLY, XLI, and XLV ugly. IWM looks best for a trend reversal Monday.
Please leave comments below and follow me on the platform.


THE WEEK AHEAD: SNAP, FEZ, XLV, AND XRTWith four weeks or so until the next batch of earnings, I'm briefly turning my attention to exchange-traded funds to see if there's anything I can play to bridge the gap between earnings seasons.
As with the previous several weeks, there isn't much; only three are near or above the 70th percentile for implied volatility over the past six months: FEZ, with an implied volatility rank of 86, and a background implied volatility of 20; XLV (68/17) (no surprise there; some friskiness associated with the failed Repeal and Replace measure); and XRT (67/22). I will look to work XLV and XRT with iron flies, possibly, but I may go directional on FEZ, since it's meant to replicate the performance of the Euro Stoxx 50.
The other possibility is SNAP. It hasn't been on the block long enough for it to have a "6 month" metric of anything, but its background implied volatility is at 59%, and that's somewhat high for this market. Because of its potential for rippage, I think the best play in that is directional or where there is no directional risk on one side or the other (put diagonal, Jade Lizard, Big Liz).
I'll putz with possible SNAP setups here and post separately if something looks particularly attractive ... .

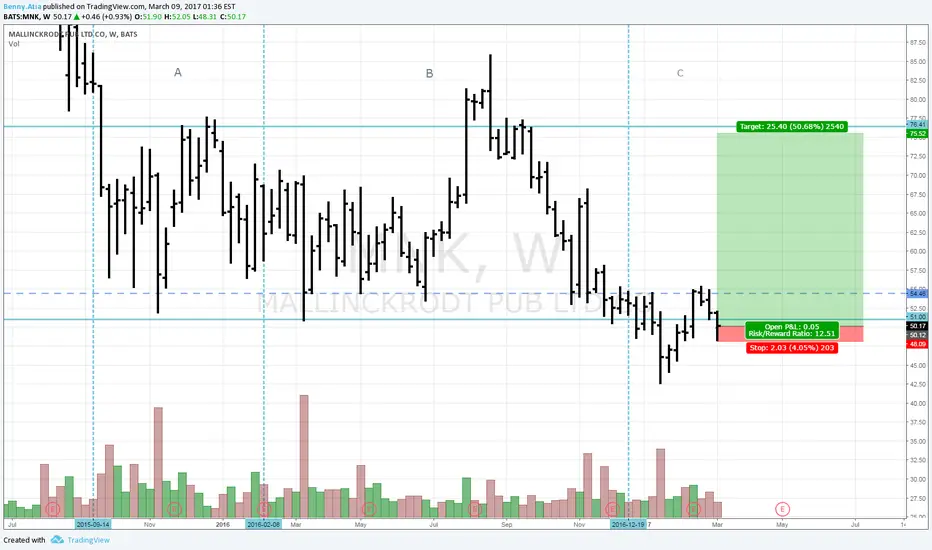
Entered MNK 50.12 Support of Trading range, new trend potenialBough the possibly* weekly false brake(*will see at weekly close) on the support of the trading range.
Very similar to my previous MOS trade, will link to it for reference.
Hoping for a push higher and if closing above 80 area, a possible upgtrend follow-through, surpassing MOS trade results.
Entered A - Shooting for the sky ~280$ areaAlthough the entry is in the daily, weekly timeframe also merges soon, potenial entry zone for long distance runner, if not, still a valid early trend entry on the small daily-weekly time-frames.
hopefully the upcoming momentum will be enough to distance from current location and proceed to the higher timeframes trend potential.

Long Term Sector RotationSPX vs Major Sectors. I added IBB to cover Biotech.
Please comment. My understanding at this point is to stay in sectors which have good fundamentals and have been relative laggards. The 3 bottom ones at this point seem to be Financials, Technology and XLU / XLP.
Since utilities is a risk-averse sector, so in a pro-growth environment I may want to go with the other 3. XLB is like the coyote / fox from Mickey mouse that runs a few meters off the cliff thinking its still running on solid ground before realizing that there's nothing below it and then falls like a rock. Great if you can time it right.


BLUE birdThis might look like a long for now, especially on sympathy. But the volume is of concern. Seller/Buyer ratio is on watch.

IBB targetsStill rangebound, and pending any big negative news on its components, IBB should be going up for days(?).


JUNO rounding.JPM conference presentation this week. If it's good, or if $KITE is good, this will move.
