Monero breakout to continue ?After the break of resistance and the pull back down the previous lvl I’m expecting to see XMR continue it’s breakout
Xmrusd

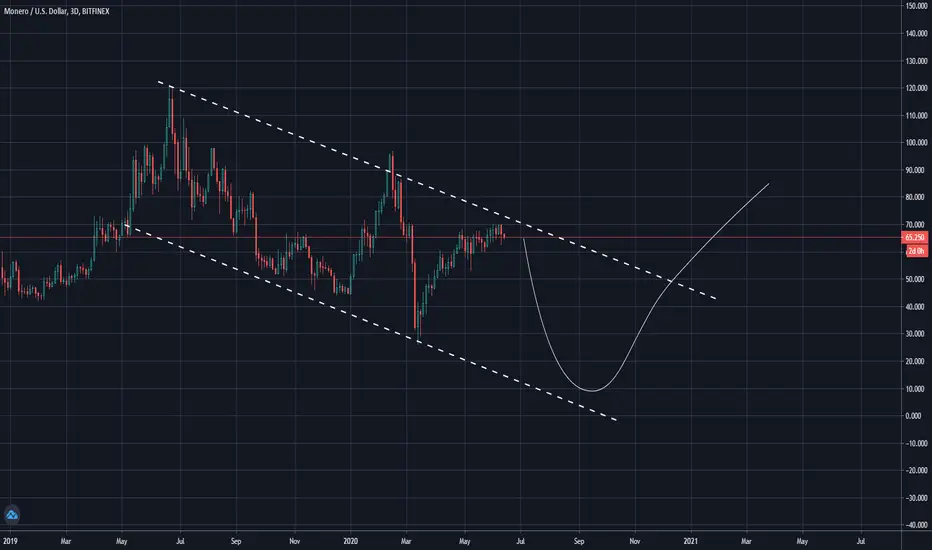
Expect a distribution and mark down here ...As you can see rsi rejected to touch over bought here, but something is here you didn't see ...
Hidden bullish divergence ...
Rsi needs to confirm the support line, so it has to do a little mark down, after that it will there for a while and mark up will start again.
So I recommend you to wait for a while, when you see a touch on 68 area and rsi touched the line, you can enter long to 71 and 72.
But if you see a break down on rsi line and the bottom line of triangle ... it means the long idea has rejected.
So keep your eyes open here ...
If you liked it, please hit the like button, share and write your comments and follow me, thanks for reading.
Take care, trade safe and GOOD LUCK.

MONERO +150%Buy now and more low price.
Sell levels on the chart.
Profit 150-350%
Good luck for you !

Monero- Ascending channel with good volumeHello,
I see a great and strong movement from monero that we can see in the next days-weeks.
Thanks!
Regards,


Monero Break outs after years of consolidationI was personally buying on Leverage few days ago, finally we saw a nice small move up, after a small cooldown, we should continue pushing higher.

XMRUSDt signal (LONG)Hello friends.
Please support my work by clicking the LIKE button(If you liked).Thank you!
Everything on the chart.
open pos: market
targets: 73 and ~79.5
after first target reached move ur stop to breakeven
stop: ~59.8 (depending of ur risk). ALWAYS follow ur RM .
Good luck
Follow me on TRADING View, if you don't want to miss my next analysis or signals.
Good luck.
It's not financial advice.
Dont Forget, always make your own research before to trade my ideas! If i help you to earn some money i will RLY VERYVERY appreciate for your donate.
Open to your questions or suggestions(PM to me).


XMR MONERO BREAKOUT - EASY TARGET 70 XMRUSD XMRUSDT XMRBTCXMR MONERO BREAKOUT - EASY TARGET TP1 70
IF 70 BROKEN THEN TP2 82

Looks good and bullish trend is doing wellOk guys ascending channel confirmed, first resistance broke, in my idea next resistance is 68, breaking it means there is a chance to touch and test 70(it came by the pattern in the last idea about xmr)
If you liked it, please hit the like button, share and write your comments and follow me, thanks for reading.
Take care, trade safe and good luck.

XMRUSD signal (LONG)Hello friends.
Please support my work by clicking the LIKE button(If you liked).Thank you!
Everything on the chart.
IDEA WITH GROWTH IS RELEVANT ONLY IF BTC WILL RISE, KEEP EYES ON BTC!!!
open pos: market
targets: 68.2 - 70 - 71.8
after first target reached move ur stop to breakeven
stop: under 64(depending of ur risk). ALWAYS follow ur RM .
Good luck
Follow me on TRADING View, if you don't want to miss my next analysis or signals.
Good luck.
It's not financial advice.
Dont Forget, always make your own research before to trade my ideas! If i help you to earn some money i will RLY VERYVERY appreciate for your donate.
Open to your questions or suggestions(PM to me).

Monero: Analysis using Ichimoku 17/06/2020H4
At D1, the cloud is directing upward, indicating an uptrend. On H4, the cloud is directing downward, indicating the formation of a correction for D1.
Conclusion:
We recommend buying when the RSI reaches an oversold level on the H4.
H1
At H4, the cloud is directing downward, indicating a downtrend. At H1, the cloud is directing upward, indicating the formation of a correction for H1.
Conclusion:
We recommend selling when the RSI reaches an overbought level on H1.
Good luck!

XMRUSD 4D: strong chart / best level to BUY 100% gainsWhy get subbed to to me on Tradingview?
-TOP author on TradingView
-15+ years experience in markets
-Professional chart break downs
-Supply/Demand Zones
-TD9 counts / combo review
-Key S/R levels
-No junk on my charts
-Frequent updates
-Covering FX/crypto/US stocks
-24/7 uptime so constant updates
XMRUSD 4D: strong chart / best level to BUY 100% gains
IMPORTANT NOTE: speculative setup. do your own
due dill. use STOP LOSS. don't overleverage.
Tagged as SHORT cause I expect short-term losses
before reversal from my level.
🔸 Summary and potential trade setup
::: XMRUSD 4D chart review
::: strong chart upside possible
::: HOWEVER wait for crypto correction
::: 15%-30% pullback in major coins soon
::: BUY later at discount price
::: details see chart
::: discount level near 50/52
::: BUY/HOLD setup from that level
::: TP bulls 100 90-100% gains
::: recommended strategy: BUY/HOLD
::: swing trade setup do not
::: expect fast gains
::: setup for patient traders only
::: good luck traders
🔸 Supply/Demand Zones
::: fresh demand 17 cents
🔸 Other noteworthy technicals/fundies
::: TD9/Combo update: N/A
::: Sentiment short-term: BEARS
::: Sentiment outlook mid-term: BULLS

Bear flag is formingIf price formed a candle above the red line(break it) or rsi break the red line, it means bear flag rejected, but if you see a good respect of rsi and price to these lines, you can see another down trend, and also I have to say you can see cross under in ma's ...
If you liked it, please hit the like button, share and write your comments and follow me, thanks for reading.
Take care, trade safe

XMRUSDt locally signal (SHORT)Hello friends.
Please support my work by clicking the LIKE button(If you liked).Thank you!
Everything on the chart.
open pos: market and put 1 more sell limit on 66.4
targets: 61 - 59 - 56.5
after first target reached move ur stop to breakeven
stop: 69.1(depending of ur risk). ALWAYS follow ur RM .
Good luck
Follow me on TRADING View, if you don't want to miss my next analysis or signals.
Good luck.
It's not financial advice.
Dont Forget, always make your own research before to trade my ideas! If i help you to earn some money i will RLY VERYVERY appreciate for your donate.
Open to your questions or suggestions(PM to me).

XMRUSDt locally signal (LONG)Hello friends.
Please support my work by clicking the LIKE button(If you liked).Thank you!
Everything on the chart.
open pos: market
targets: ~73$
stop: 49.5 (depending of ur risk). ALWAYS follow ur RM .
risk profit: 1 to 2.5
Good luck
Follow me on TRADING View, if you don't want to miss my next analysis or signals.
It's not financial advice.
Dont Forget, always make your own research before to trade my ideas! If i help you to earn some money i will RLY VERYVERY appreciate for your donate.
Open to your questions or suggestions(PM to me).

Looks like we have rsi convergence in xmrAlright guys this is my firs idea in xmr
As you can see we have ascending symmetrical triangle here, rsi goes up and macd shows that range is almost done, and volume confirmed that we have a big trend in our way(in 12 hours), we have support of ma's and also cross over in 50 and 200
As you can see we have 72 in 618 if we break 70 resistance!.
So I recommend you to wait for 69 resistance ...
If you see a candle above it, enter long to 72.
If you liked it, please hit the like button, share and write your comments and follow me, thanks for reading.
Take care, trade safe

Daily looks bullishAs you can see we are in a big ascending triangle, rsi is forming and respecting to the triangle and macd is finishing the triangle(It shows range is over).
We are in bullish trend because we had cross over in ichimoko and also price is above the cloud.
The trend will start after a little correction which would be in 65 area, and the target after breaking 69 would be in 76.
I looked in history for it, 76 in daily chart is one of the strongest resistances.
If you liked it, please hit the like button, share and write your comments and follow me, thanks for reading.
Take care, trade safe

XMRUSD Swing Trade and targetsCurrent trade for XMRUSD.
Long term trading strategy very profitable. Only long 1800% as compared to buy and hold which is also very profitable 750%.
Net profit shown below is for trading it both way.
Current printed long with XProfit will be fully activated if BTC decides to move up, but as we're facing big resistance, it's not a done deal and most of the crypto asset will react same as btc when traded against USD.
You can join links below or hit me up if you want to give XProfit a try for your long term trading in peace.
Cheers

Major Monero Discounts Could Happen! (XMR)Everything on monero continues to shoot green from the Crossover strategy and the ema dots.
We still sit below a very key level of resistance in an expanding downward channel with lower lows and lower highs being formed. Until an actual breakout you still have no bulls confirmed!
I am a big fan on monero and I personally would love to see it reject off resistance and dump for one more major selloff for unbelievable discounts.
If this happens I will add a large position at the next low or on the Resistance breakout if we decide to push upward.
Best of luck to you all.
🥇MLT | MAJOR LEAGUE TRADER | FULLTIME TRADERS

There is a trading opportunity to buy in XMRUSDMidterm forecast:
While the price is above the support 26.05, beginning of uptrend is expected.
We make sure when the resistance at 68.20 breaks.
If the support at 26.05 is broken, the short-term forecast -beginning of uptrend- will be invalid.
Technical analysis:
A peak is formed in daily chart at 67.79 on 05/18/2020, so more losses to support(s) 60.05, 54.05, 44.00 and minimum to Major Support (26.05) is expected.
Price is above WEMA21, if price drops more, this line can act as dynamic support against more losses.
Relative strength index (RSI) is 61.
Trading suggestion:
. There is a possibility of temporary retracement to suggested support zone (54.05 to 44.00). if so, traders can set orders based on Price Action and expect to reach short-term targets.
Beginning of entry zone (54.05)
Ending of entry zone (44.00)
Entry signal:
Signal to enter the market occurs when the price comes to " Buy zone " then forms one of the reversal patterns, whether " Bullish Engulfing ", " Hammer " or " Valley " in other words, NO entry signal when the price comes to the zone BUT after any of reversal patterns is formed in the zone. To learn more about " Entry signal " and the special version of our " Price Action " strategy FOLLOW our lessons :
Take Profits:
TP1= @ 60.05
TP2= @ 68.20
TP3= @ 82.15
TP4= @ 96.50
TP5= @ 120.95
TP6= @ 137.95
TP7= @ 168.70
TP8= @ 230.10
TP9= @ 298.90
TP10= Free
