XMRUSDXMRUSD
✅ 1 - 69.3
✅ 2 - 72.3
Breakdown 59.3, the price may fall below
If you like what I do, put 👍 and subscribe
Waiting for your comment, what do you think about this?
Xmrusd

Best fungible coin MONEROThis coin looks ready to double in value.
Capitulation is done and disbelief is coming.
Big opportunity for the next couple of months.
Be safe.

XMR/USDt - Like the Shakeout.On 1d you plan to go up. Like the Shakeout.
At 4h, the average slide is directed to the bosom.
Indicators are neutral.
The key level from which you can make a decision to buy.
Break-down and fixation is more reliable purchase.
Also I do not exclude a trip down (if below $63 I will consider a shorts).
Push ❤️ if you think this is a useful idea!
Before to trade my ideas make your own analysis.
Thanks for your support!

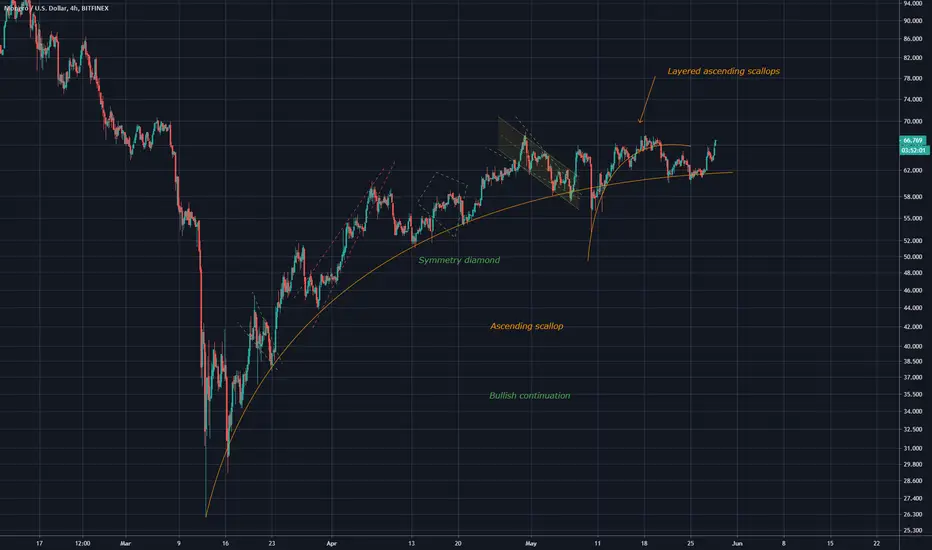
Monero looks really goodAnalysis for XMRUSD
Ascending scallops can be seen to be layering on top of each other
Looks nice
Haven't done the diamond patterns in awhile, not quite sure if its one, leave a comment
Very bullish

XMR/BTC - Moner0A triangle.
pressure on the upper boundary;
Punching up and securing the purchase.
stop loss for local minimum;
Push ❤️ if you think this is a useful idea!
Before to trade my ideas make your own analysis.
Thanks for your support!


Privacy Is Shifting. (XMR)I love monero ❤🥇❤🥇❤
True Cryptocurrency that plays a critical role in what it stands for.
💰 Let's check up on the price action of this one.
Wave 1: The selloff, the distribution of coins.
Wave 2: The accumulation of support.
Wave 3: The Resistance for controlled accumulation.
We are squeezing sideways as the pennant pattern is forming.
*As this pattern squeezes we will see a decision in which way the market wants to run on a breakout.
(Similar to how price broke down on btc back in November of 2018)
I'm not saying it will result in same results, I'm showing you how compression decide critical moves for trend changes)
These are key areas where you want to play for a major move.
The full compression of range could be controlled for another 6+ months, our first major sign is aw we see the weekly shoot to hit wave 3.
But one major observation I'd like to notice is what i titled on chart as "Final Shakeout"
That selloff could of been the final selloff in a stop hunt.
It was a major quick crash that scared buyers to force them out of their positions.
That can be called the final capitulation.
You are noticing as prices get low on altcoins they try to flash the market to force the buyers out of their positions.
I believe we could be in very early stage of the major multi year alt cycle.
But I also take into fact that the compression could last another 6+ months if wave 3 can hold.
What we like to look for on longterm entry is a doji compression off S&R Levels for trend change,
So technically this is a late call to buy now.
If you wanted to buy now you would hunt for an edge play in the market to push up to the next level of price in a lower timeframe.
Hope you enjoyed, have a blessed day!
MLT | PRO TRADERS 🥇

XMRUSDt AnalysisHello friends.
Please support my work by clicking the LIKE button(If you liked).Thank you!
Everything on the chart.
When breaking through and consolidating above 67, you can open a long with a target in the area of 73$ (9%)
scenario will be canceled if we exit the local channel down
Follow me on TRADING View, if you don't want to miss my next analysis or signals.
Good luck.
It's not financial advice.
Dont Forget, always make your own research before to trade my ideas! If i help you to earn some money i will RLY VERYVERY appreciate for your donate.
Also open to your questions or suggestions(PM to me).Will be glad earn some money for me and you.

XMR/USDT (Bullish 200ma Dynamic Support?)XMR/USDT
-bullish rejection at 200ma dynamic support
-forming a consolidation box
-holding above 20ma support
-technically, the market still bullish
-a safe trade is to wait for a break above the box
-open a Long position and target the swing up at 95s
-stoploss is under 62s


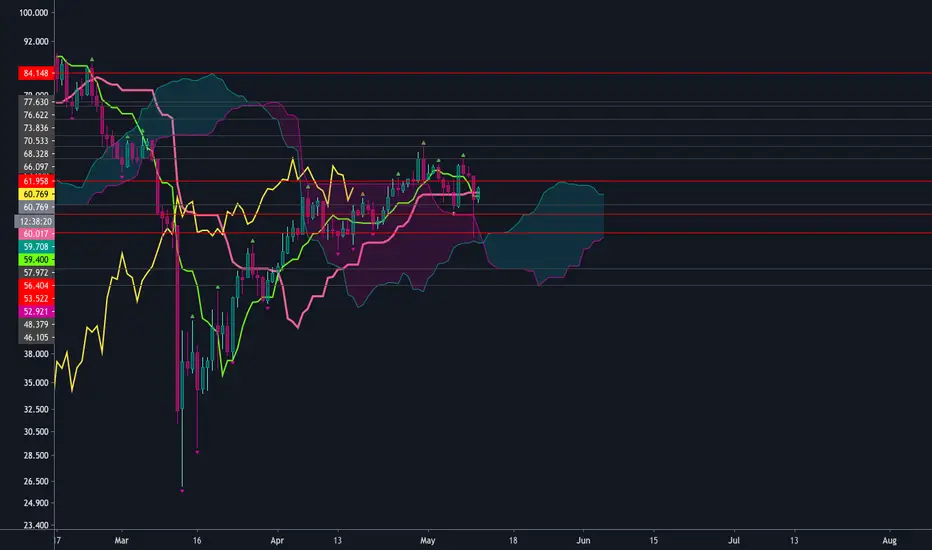
XMRUSDXMRUSD, is looking very nice, on the daily Ichimoku chart. Once Chikou-Span leaves the Kumo, and we get a bullish signal, of a TK cross, above the Kumo, I think this will be, a very positive trade. Good luck to you all.
ALT.D / My view on ALTCOIN market. 2020-2025Made a reply in another thread answering my view on altcoins.
Thought I might as well just copy/paste it for reference.
----------------------------
Without any doubts, I buy longterm:
ETH, EOS, (BTC), XMR, XLM, XTZ, XRP
I dont think I need to say anything other than I am 100% in on these.
EOS and XLM still havent really proven themselves. They might die. But I am 100% in anyway.
The others, have already proven a utility function and solved a major technological problem. They will be here for good. I'm putting my money where my opinion is on this. 100% of my liquid assets are crypto now. (I invest in tech companies and own founder stock otherwise, but thats the only other investing I do)
$LINK
I think LINK has potential but it is very inflated and overvalued/hyped right now.
LINK has not actually accomplished much of its blockchain technology claims yet, but it seems like progress is going well, and its supported, etc. so its a good one to add to the list.
It has good business development behind it also, partnering up with many other chains, and companies / agendas.
$ZEC
Some people might also like ZEC. I am on the fence.
$REP $BAT
REP and BAT are interesting as well. Utility usage and found a niche. any altcoin that has not found a 1) valid; 2) usable; and 3) niche - utility - will eventually disappear (go to $0).
$LTC
I'd also say LTC is a valid coin. Its basically bitcoin but faster tx speed, lower tx fees, and not much different from it (LTC is a BTC fork).
$BCH, $BSV/$BC*/etc
BCH is the other bitcoin "alternative" that I think has validity. The others I dont (BSV, BS* etc). However I dont hold BCH because it has a 51% vulnerability that is very very low. It could happen anytime. The only thing keeping it alive is MAD (mutually assured destruction). The miners who have over 65% control of BCH just dont want to nuke their own coin as the scam exit might not be as valuable as continuing to mine it/manipulate it. (ergo: BCH is WAY too centralized).
$OMG $ALGO $DASH
OMG, ALGO, and DASH are interesting to keep a watch on too.
These are basically all the coins on my watchlist.
ETC as well, but I have a love/hate relationship with ETC. I believed in it, and it burned me, so I'm staying away now. I also dont think ETC really matters anymore. ETH won that argument years ago.
ETC doesnt have the ETH dapp chain either. Everyone is using ETH chain not ETC chain.
ETC only exists because some purists cant let go of an old argument that they lost, basically, and I think thats childish and regardless of who is "right" and who is "wrong" (which isnt distinguishable in this case IMO),....let it frikkin go and move on with your life.
#1 "altcoin" ofc is ETH. So much so that I believe before 2021 it will decouple from BTC and have close to (if not more) market share. Its not even really an altcoin anymore. BTC and ETH are "THE COINS".
DISCLAIMER: I an an XMR miner.
However XMR has solved every drawback of BTC and improved upon it 100x.
If technical ability was the value of each coin, XMR would be worth 10 BTC.
I believe, eventually, it will be.
I will not sell a single coin lower than $250 right now, and after 2025 I wont sell a single one under $1k.
If you are interested, watch this:
www.youtube.com
Its long, but watch it in background while you play or work.
Its well worth it.
It literally covers everything about BTC and XMR and future of crypto as valid currency.
Monero Means Money (Monero=XMR). It is going to replace fiat and its already doing it in very niche markets.

XMRUSDCup and handle pattern on the 4hr. Price has retraced back to the Kijun-Sen. Entry is above latest down fractal . Target is a 1.272. Not advice.

XMR / My (biased) review of Monero (XMR) - HODL!This is not trade advice.
I am completely biased.
I started mining monero 1-2 months ago, actually after a virus infected my computer with an XMR miner and it led me to investigate it!
Crazy story but I fell in love with this coin. It has EVERYTHING i believe a cryptocurrency should be.
Key points on this video:
xmr
- history
live since 2014
10x potential from where we are now
compare to btc we are 2x from its peak
- whitepaper
xmr is the "anonymous cryptocurrency"
untrackable, untraceable by design
tx fees are low (lower than eg XRP)
tx speeds are high (much higher than BTC!)
security is bulletproof
- decentralized
cpu mined, asic resistant (everyone can mine)
as monero is growing - it is becoming MORE decentralized (many other coins incl BTC are becoming MORE centralized)
51% attack "immunity"
adds to its anonymity and untraceability
- usage
replace XRP for cross-border payments (lower TX fees, faster TX speed)
>> XRP has ripple company behind it doing bizdev, XMR is community controlled
anonymous store of value
anonymous payments
privacy and security #1 coin
blockchain (cryptonight) lead developer for all other cn-based coins
- value
has held value better than other coins
great mining community
mining pools that mine other coins when xmr value dips below them in hashrate/ratio, to continually pump xmr value
dropped less than most other coins including btc in march crash
was not premined (bitcoin, litecoin, monero, dogecoin are only major coins that were not premined)
- mining
block reward dynamic
block size dynamic
difficulty adjust every block

XMRUSDT longXMRUSDT (4h) long trade
Entry range: 74.7 - 75.15
Size: 2% of capital
Stop Loss: 55.12
TP1: 65.38 - 65.77
TP2: 74.7 - 75.15

XMRUSDT (4h) long trade opportunityGood long trade opportunity on XMRUSDT (4h)
Entry range: 62.17 - 62.71
Size: 2% of capital
Stop Loss: 58.45
TP1 range: 65.43 - 65.72
TP2 range: 68.54 - 68.83
Powered by BreakFree Trading

Monero long setup - updateMonero still showing bullish signals on the weekly chart, holding our position
Entry = $54.62
SL = $49.150
TP = $81.016
R/R = 4.83

Monero (XMR) the next destination can be $380The formation of Wedge:
On the long term weekly chart the Monero has started the formation of a wedge pattern. Since then it has been nicely hitting the support and resistance levels of this wedge pattern. At this time it can be easily observed that after the drop of March 2020 even though the price action has hit the spike beyond the support but finally it is retraced back and re-gained the value upto 161%.
But there are some certain bearish signals appeared therefore I am not expecting very soon break out from this pattern. If we take a closer look at the Bollinger bands indicator then it can be easily noticed that the upper bands of the bollinger bands is below the resistance of this wedge. If the price action will be reached at this level then the Bollinger bands won’t let the priceline of XMR to break out. And it will play a role of a strong hurdle, moreover after placing the volume profile on the complete price action moving within this wedge pattern if can be also found that the trader’s interest is up to $89. That is at the resistance level and above that level we have very weak interest of the traders. Therefore in order to break out we need to have the trader’s interest developed above the resistance of this wedge pattern.
Here we have one more indicator that is very much important that is the point of control of the volume profile. This POC is at $48 therefore this point of control can pull back the priceline towards itself at any time but once the traders interest will be developed above the resistance of this wedge pattern then the point of control of this volume profile will be also moved up. And if that will happen then XMR will have more strong chances to have a powerful breakout.
The combination of these indicators is showing weak bearish signals:
If we place the stochastic and the moving average convergence divergence (MACD) and the momentum indicators then we can notice that this time the movement of the price action of XMR is different from the previous moves that the Monero has been making withing this wedge pattern. For example if we see in the month of December then it can be easily observed that 1st MACD turned weak bearish from strong bearish then we received the bull cross from stochastic indicator and then momentum also turned weak bearish and the price action turned strong bullish and reached at the resistance of the pattern. After that we can see that in the month of Jun 2019 the stochastic gave bear cross and the MACD turned weak bullish and the momentum also turned weak bullish then priceline of XMR moved down again and reached the support of this pattern. Then in the month of December 2019 we can again observe that that MACD turned weak bearish and the momentum was already weak bearish and in the month of January finally we received a clear bull cross by the stochastic indicator then again the priceline started strong bullish rally and reached up to the resistance of this wedge. Then again in the month of Feb 2020 the stochastic gave the bear cross and the MACD also turned weak bullish and at the end of March 2020 the momentum also turned weak bullish then priceline drpped down and reached at the support. So these moves are showing that the movement of the XMR within this wedge is very much synchronized with the signals of these 3 indicators. But time if we take a closer look at the movement and these indicators then we can notice that 1st the MACD turned weak bearish and the stochastic also gave the bull cross but so far the momentum indicator is ignoring these bullish signals of stochastic and MACD. And it is still giving the strong bearish signals. Therefore we cannot expect that the priceline will be reached at the resistance of this pattern to make an attempt for the breakout unless the momentum indicator will also be turned bullish.
The support and resistance level:
If we switch daily chart then it can be easily seen that after 17th March when the price acton turned bullish first it broke out the resistance level at $44 and then re-tested this resistance as support and after successful re-test the price action took another powerful bullish divergence. Then it faced some resistance at $58.42 but finally the priceline broke out this resistance. Now currenty the Monero is re-testing the previous resistance as a support at $58.42. After successful re-test of this resistance as support we will be confirmed that the priceline of XLM has finally broke out this resistance. Because this level has been working as a strong support and resistance level for the priceline of XMR since December 2018.
Moving averages:
If we watch the movement of the simple moving averages on the daily chart then after the strong bearish trend in the month of March the price action started the bullish rally. Then it has broken out all the simple moving averages with the time period of 50, 25,200 and 100. And after breaking out every moving average it has been re-testing the previous resistance of moving average as support and after every successful re-test the priceline moved up to break out the next simple moving average. At this time we can see that the priceline has broken out the 200 and 100 simple moving averages on one go. And now the priceline is retesting the 100 and 200 simple moving averages at the same time. Today a very strong bearish candle stick is appeared. And the 100 simple moving average is likely to be broken down and if the priceline will be closed below the 100 simple moving average then there will be more chances that it will break down the 200 SMA as well. If the 200 SMA will be broken down then the priceline can very easily breakdown the 25 and 50 simple moving averages. Therefore in order to continue the rally the 200 simple moving average shouldn’t be broken down.
A very big bullish BAT pattern:
Now I woud like to recall a very big bullish BAT pattern that is formed on the monthly chart. And we can see that since October 2018 the priceline has entered in the potential reversal zone of this pattern. We can also observe a very small spinning candlestick that was appeared in the month of March 2019 that was completely opened and closed below this potential reversal zone level. But in very next candlestick it was retraced back in this PRZ level. Recently again in the month of March 2020 have witnessed a very long bearish spike beyond the potential reversal zone. But in the very next candlestick the priceline has been retraced back in this PRZ level.
The XMR’s final resistance level is $380 that is also in the Fibonacci projection area or the selll zone of this BAT patter. This is the Fibonacci projection of A to D leg. Therefore the price action once the price action will be entered in the potential sell zone then it can also make an attempt to break out the $380 resistance. So this bit bullish BAT pattern can produce upto 560% big gains.
The Crab pattern saved the BAT pattern to be invalidated:
In the meanwhile I would like to recall another harmonic bullish Crab pattern that was formed in the month of March 2020 by the price action of XMR. I have published this harmonic move in my post of 17th of March. And as per Fibonacci sequence of bullish Crab the priceline started a powerful bullish rally and produced more than 133% gains. This Crab pattern was the main reason that pushed back the priceline in the potential reversal zone of the big bullish BAT pattern that has been formed on the monthly chart.
Conclusion:
If the supports on the daily chart will be broken down then the Monero can start bearish rally on short term and mid-term. But on the long term the XMR can turn strong bullish at any time for up to 560% big gains and can hit the $380 long term resistance.
Note: This idea is education purpose only and not intended to be investment advise, please seek a duly licensed professional and do you own research before any investment.


Don't miss the great buy opportunity in XMRUSDTrading suggestion:
. There is a possibility of temporary retracement to suggested support line (60.0). if so, traders can set orders based on Price Action and expect to reach short-term targets.
Technical analysis:
. XMRUSD is in a range bound and the beginning of uptrend is expected.
.The price is above the 21-Day WEMA which acts as a dynamic support.
. The RSI is at 69.
Take Profits:
TP1= @ 71.70
TP2= @ 81.70
TP3= @ 96.90
SL= Break below S2

XMR UpdateTradingView won't let me type any description as apparently I'm 'breaking house rules', whatever that means.
