MoneroXMRBTC touched bottom and now formed triangle with potential break out resistance line. Targets next fibonacci levels
Xmrusd

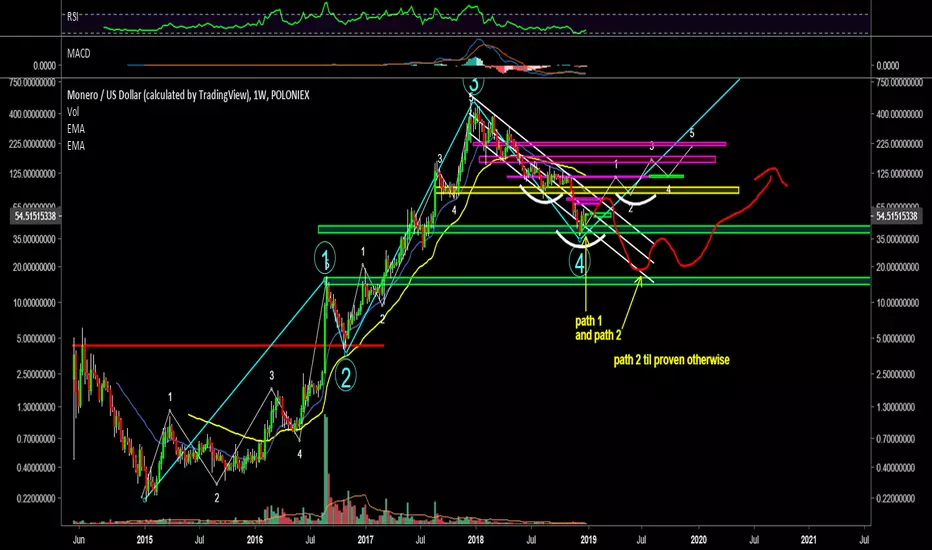
Eyes on long-term XMRBoth USD and BTC price reaching areas of possible reversal on long-term weekly charts. Posed for potential breakouts at the bottoms of downwards wedges in both charts. Bullish divergence has appeared for the last two lows on both MACDs. RSI is not showing bullish divergence but has recently touched and rebounded slightly from oversold areas, also posed to breakout through resistance in downwards wedge formations.
A corrective bounce to either of the last fib lines suggest possible XMRBTC targets of 0.016 (+20%) and 0.020 (+50%), with possible XMRUSD target of $130 (+245%).

Monero ($XMR) - simple buy and sell. Green - buy. Red - sell.
I do not recommend using this chart for margin trading.
It's not a financial advice.
Trade carefully and good luck!

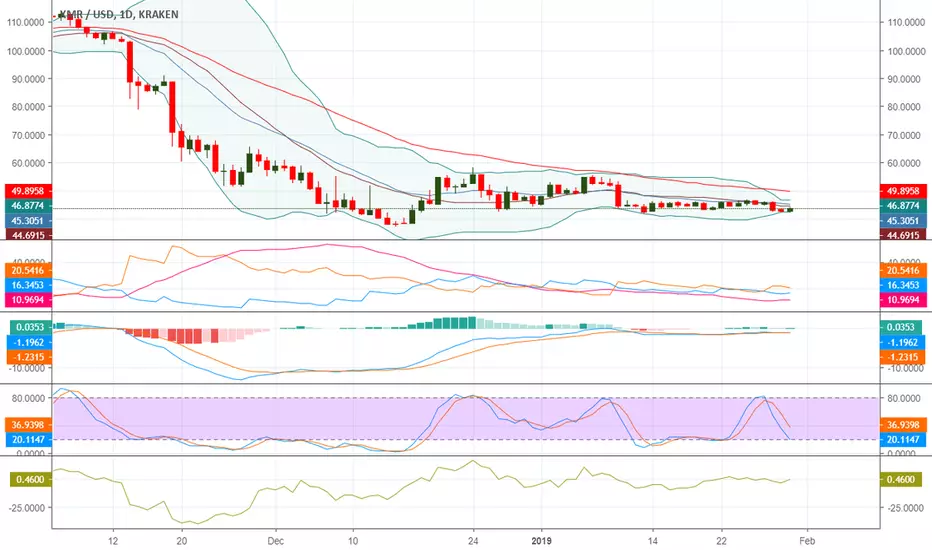
[Feb. 2019] Monero Price PredictionMonero (XMR) has seen a very tough year, declining from $253.76 back in February 1, 2018 to the recent price of $43 as of February 2019, a loss of -83%. For 2019 the year-to-date performance is -5.56%, as it started the year with a price near $46. Can the level of $40 act as a real bottom for 2019? Monero price prediction is very hard to be accurate, but in this article, we will present some scenarios based on the estimated of various sources and on our technical analysis.
Key facts as of February 1, 2019:
• Market Cap: $734.639.891 USD, 211.052 BTC
• Volume (24h): $33.024.942 USD, 9.488 BTC
• Rank 13 on CoinMarketCap based on the top 100 cryptocurrencies by market capitalization
• 52 Week Low - 52 Week High: $38.5789- $380.2306
The optimistic scenario is that there is strong support near the level of $42.50 and the Stochastics indicator (14,3,3) is in oversold levels, having made a bullish crossover. If a bounce is to occur then targets are the levels of $45.90, $46.80 and $49.55. The level of $49.55 is where the 50-day exponential moving average is today, February 1, 2019 and should be a strong resistance. The Momentum indicator is flat, and the strength of the trend, a dominant downtrend is not strong. A pause for the downtrend is very likely.

Monero (XMR) 21 Week Trading Plan (LIKE + FOLLOW)The goal for every technician is that his or her chart should be so easy to understand that someone with zero trading background can follow it.
After a week of brainstorming I'd like to formalize my TA into specific blocks and give viewers different options that best fits your needs/expectations. Here's the plan starting Monday, February 4th as I launch my 6 month trading block. So I hope you come follow and join me for the ride.
Mondays - Market Forecast ( Publish Top 10 Coins report)
Tuesdays - Video upload on Trading View (10 minutes of TA on Bitcoin and Alts + News + TA training topic)
Wednesday - Market Forecast (Publish Top 10 Coins report)
Thursday - Video upload on Trading View (10 minutes of TA on Bitcoin and Alts + News + TA training topic)
Friday - Market Forecast recap (Review our weekly analysis, what did we do right or wrong and game plan for the following week)
Here is a taste of what my charts will look like going forward
Regards,
Bobby
-Don't hate the hair, hate the game

Monero Price Prediction – Downtrend Continuation?Monero was initially launched in April 2014 as a fork of Bytecoin, under the name BitMonero. Ever since its inception the coin has been focused on anonymity, private transactions, and decentralization. Monero’s trading symbol is XMR, it uses the proof-of-work algorithm CryptoNight and is designed to be ASIC resistant (good news for small miners).
The protocol uses an obfuscated public ledger and Ring Signatures which mix the sender’s transactions with a group of others. This system makes it more difficult to establish links between sender/receive thus providing anonymity for users. Further, the use of “stealth addresses” makes it impossible for third parties to discover the actual destination address which is known only to the sender and receiver.
Mainly due to its privacy-oriented nature, Monero became the cryptocurrency of choice for dark markets users. In the first half of 2018, it was used in 44% of crypto-related ransomware attacks which is a concern for traders and HODL’ers.
XMR/USD Technical Outlook – The Big Picture
Currently trading around $43 Monero reached its highest price in early January 2018 when one XMR was worth 496 US Dollars. The privacy coin is now sitting at the 13th spot in market cap rankings with a total supply worth just over $731 million.
Similar to almost all other cryptocurrencies in the top 20, Monero (XMR) reached a top in early January 2018 and has been falling ever since. The pair has been printing lower lows and lower highs for the entirety of 2018 which is a staple of bearish trends. This one doesn’t show clear signs of coming to an end.
Between June and November 2018, the price of XMR was trading inside the horizontal channel created by 145 resistance and 80 support. It has since exited said channel and is approaching the long-term support at 30 which I consider to be the next target on a weekly chart.
The Relative Strength Index has been crawling at the bottom of its range since the beginning of December, but it is not clearly oversold so the only argument for retracement higher remains the fact that the downtrend seems to be losing steam. However, that alone is not enough indication that prices will rise in the near future.
On a Daily chart, we can see the same clear downtrend with the pair below the 100 days Exponential Moving Average and lower lows printed on a constant basis. Daily support sits at 38, resistance at 60 and the latest price action is flat, which makes it hard to anticipate the next short-to-medium term direction. However, from a long-term perspective, the pair is headed south so we expect to see a break of 38 followed by a move into 30 and possibly lower.
Daily Chart Support: 38 (the exact price differs depending on exchange)
Weekly Chart Support: 30
Daily Chart Resistance: 60, 100 days EMA and 80
Weekly Chart Resistance: 80, 145, 310
Most likely scenario: continuation of the downtrend, move below support
Alternate scenario: extended sideways price action, possible moves up based on downtrend exhaustion; keep in mind these are technical scenarios, which can be invalidated by fundamental developments

Will this Bullish Break Lead to the End of the Bear ?? LONG XMRMaybe this is an ending triangle? RSI has come to life breaking through 40 and holding on a couple tests setting up this price triangle. ADX is reset and ready for a new trend. Is this the end of the bear for XMRBTC?

Monero / XMR - Video Outlook TDSniperMonero / XMR
Monero vs USD video breakdown.
Buy levels and sell zones.
Twitter - Signals - Telegram in Bio


MONERO SHOWS YOU ALL WHO IS THE FORGOTTEN PRIVATE COIN First go to my first chart, You will Bitcoin cash chart- Did you see see two ABCD charts, and click the move! What did you see? HUGEEEEEEE. right? I made 8x there!!!
Now, Continue to read my post!
When should I buy? BEST BUY TIME
1 ) Symmetrical Triangle has to be broken
2 ) ABCD chart has to be broken
3 ) Moving average 50 ( Blue line ) has to cross Moving Average 100 ( Yellow line )
4 ) See the huge volume then some consideration
5 ) Dont forget to thank me!!!
Not: Are you buying right now? Sure, Dont forget to put stop loss like me.

XMRUSD (3D): Time to buy ... Monero = Anonymity. Anonymity is a long-term value! The indicators speak for themselves ...
Buying zone:
Grey Area
Targets:
Fibu 0.236 (~ 120 USD)
Gann 2/1 (~ 150 USD)
Fibu 0.382 (~ 200 USD)
Fibu 0.5 (~ 250 USD)
Gann 3/1 (~ 250 USD)

Megalodon Pro Automated Trader - Monero - Short Term Bull Megalodon Pro Automated Trader is giving short term buy signals(orange) on hourly time frame.
----------------------------------------------------------------------------
We believe that enlightening others is an incredible way to make this world a better place. That's why we created the tools you need to stop worrying about your investments and focus on what really matters in your life.
What is Megalodon ?
Megalodon uses Artificial Intelligence that combines 574 back-tested indicators and 2674 back-tested setups, simultaneously.
Megalodon works with any kind of asset , market state and time frame .
What is the win rate?
Megalodon is extremely accurate and offers insane profits as long as the fundamental analysis is done right .
Backtesting results can be found on our social media or down below .
How to use Megalodon Pro Automated Trader?
Simply, orange rectangles are buy signals and purple rectangles are sell signals .
Green clouds show buy signals and red clouds show sell signals.
Yellow line shows the difference between buy and sell counts.
How to set alarms on Megalodon Pro Automated Trader?
Click on Alert, select Megalodon Pro Automated Trader and click on Buy-Signal or Sell-Signal. More details can be found on our social media.
You may also watch our Megalodon Investing Tutorials on Youtube for more information.
How to purchase?
Megalodon is totally FREE .
You may upgrade to Megalodon Pro for the most important features , including automizing your trading on any asset profitably, setting up alarms to get notified , joining to our VIP telegram channel to learn and our VIP telegram group to interact with the community. Simply go to our website on our TradingView page for learning more and joining us for free.
Some of the backtesting results are:
BTC/USD for longer time frame trading in the bear market for the last year.
APPLE for longer time frame trading in the bull market for the last 10 years.
EURO/USD for day trading in the neutral market for the last month.
BTC/USD for day trading in the bull market for the last 15 days.
APPLE for day trading in the neutral market for the last 2 days and 6 hours.

eyes on monero... will it bottom out? monero massive head and shoulders formation. if bitcoin heads to 1800$ we could see this coin bottom out. i don't think the bears are done just yet.


XMRBTC (W): Possible buying option - Monero vs BitcoinDetails on Chart.
Buying: 0.0125 BTC
Target 1: 0.0175 BTC (~ +40%)
Target 2: 0.0210 BTC (~ +65%)
Stop: ~0.0110 BTC (~ -12%)
Let's see what happens. Happy trading. :-)

XMR: Monero Descending Channel !!Buy After Successfully Breakout Monero and then you can see Bounce back in price.
You Can Also set Own Risk reward.
Let see what Will be Next Move.
Warning- I m Not a Financial Advisor this idea Only For Educational Purpose Only.
Thank You !!

Monero Analysis: Bullish Momentum to Continue?Monero analysis for today is carried out on a 6 hour timeframe. March 5 2018 to current date shows that Monero has maintained its bearish trend inside of a channel.
Monero most recently broke below the bottom of the channel temporarily to reach a price low of $37.18 on December 15, 2018 before returning back into the channel.
The minimum expectation for the current bullish momentum in Monero is for price to reach the upper limit of the bearish channel.
A logarithmic scale was used in this Monero analysis and therefore requires switching back to an arithmetic scale to make any physical measurements and/or projections on the price chart.


MONERO : XMR Moving in the Channel Zone !!You can LONG , SHORT as Channel Formations.
Trade Carefully !!
Warning- I m Not a Financial Advisor this idea Only For Educational Purpose Only.
Thank You !!

MONERO: Keep an eye on the lines ...So, Monero (XMR) is rebound today. 11th place in cryptocurrency rating with a current market value of $1B and average daily trading volume $16M. XMR/USD is at $ 58 right now, previously shown a good result of $61.
The good news of today is that Monero holders now can store their coins on Ledger Nano S, thumbs up! But no reaction from market so far to this news.
As for the technical picture: On the 1-hour chart of XMR/USD you can follow the resistance zone created by a confluence of SMA50 and SMA100. For now a sustainable move above $61.90-62.00 area is to bring bulls into play. After, we should keep an eye on $66.00. This resistance stopped the recovery on Wednesday.
Have a good weekend and always trade with caution!
