Crypto getting tight into lows.. Squeeze coming?I'm seeing charts like this XRP weekly all over the crypto-land. After such a persistent push a sick bounce should be in the cards somewhere... the questions is: where? Keeping an eye on where price holds on the weekly can give a great headsup as to where you could get a solid squeeze... and in cryptoid-land that could be up to 400% on some coins. The ones that look best to potentially set up so far are:
DAPPT
XTZ
XMR
FIL
ENQ
XRP
I will post charts if these actually do make an attempt to put in a nice bear market bounce.
Xmrusd

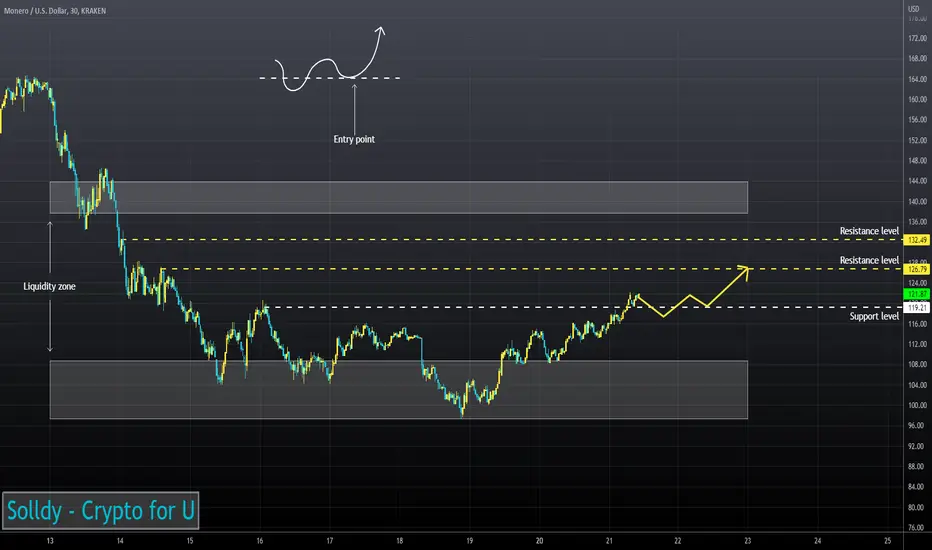
XMRUSD ❕ declining volatilityAfter Monero fell in the liquidity zone, volatility decreased and then the price reversed.
Main MAs show bullish sentiment (30m TF)
50MA break up 200MA (1H TF)
Price is above liquidity.
XMR ignored the reversal signal from the TD Sequential indicator (1H TF)
Volatility is declining.
I expect that the price will correct to the support level and after fixing above it may continue to bounce.
BTCXMR Fractal?
There's a nice and ominous fractal on the XMRBTC chart from way back in the beginning of it's price history in 2014... Let's see if i jinxed it!

Monero (XMR) - June 16hello?
Traders, welcome.
If you "follow", you can always get new information quickly.
Please also click "Like".
Have a good day.
-------------------------------------
(XMRUSDT 1W Chart)
121.8 or less is likely to be a mid- to long-term investment area.
Therefore, the key issue is whether it can rise above 121.8 and receive support.
(1D chart)
If it fails to rise above 121.8, there is a possibility that it may decline to around 61.5-84.6, so careful trading is required.
I think that the volume profile section formed over the section 61.5-84.6 is the source of the power that supports XMR.
Therefore, if you see support in the 61.5-84.6 section or higher, you can start buying from a mid- to long-term perspective.
However, if it fails to rise above the 121.8 point, we will have to increase the number of coins corresponding to profits through short-term trading.
------------------------------------------------------------ -----------------------------------------------------
** All indicators are lagging indicators.
Therefore, it is important to be aware that the indicator will move accordingly as price and volume move.
However, for convenience, we are talking in reverse for the interpretation of the indicator.
** The MRHAB-T indicator used in the chart is an indicator of our channel that has not been released yet.
** The OBV indicator was re-created by applying a formula to the DepthHouse Trading indicator, an indicator disclosed by oh92. (Thanks for this.)
** Support or resistance is based on the closing price of the 1D chart.
** All descriptions are for reference only and do not guarantee a profit or loss in investment.
(Short-term Stop Loss can be said to be a point where profit and loss can be preserved or additional entry can be made through split trading. It is a short-term investment perspective.)
---------------------------------

XMRUSDXMRUSD
The chart was in an uptrend. The trend line has been broken
Target-price 1 - 173
Target-price 2 - 158
Target-price 3 - 141

Why is Crypto Crashing? Is Celsius Insolvent?BIG NEWS out this evening of June 12, 2022. Celsius, a leading crypto lending platform, has halted withdrawals. Historically, this is a sign that a platform is fearing a "bank run" scenario and is willing to sacrifice customer trust to maintain financial solvency. Rumors have been swirling this week but now it is confirmed.
In this video I share what this has historically meant and share my opinion on what I think investors should be watching.
The financial news tomorrow will no doubt cite this news as the "reason" for the weekend crash... but Technical Analysis was clear going into June that crypto was in a bearish cycle and major supports were already breaking.

XMRUSD ❕ active buyingMonero tried to break the descending channel.
When trying to break through, the price is actively being bought back.
Price oversold on RSI (1H TF)
A reversal signal TD Sequential (1H TF) is forming now
I expect that price may bounce if it fixes above the lower boundary of the channel.

XMRMONERO looks like has been in a long term falling wedge (bull flag) and now is few weeks holding above the resistance and Im expecting another leg to the upside to about $900

XMR US draft bill to eliminate anonymous crypto projectsMonero's (XMR) is popular due to its ability to help anonymize users.
The transactions are much more difficult to trace because they use stealth addresses.
But that is not what regulators want for the crypto space.
A leaked copy of US draft bill proposes to eliminate anonymous crypto projects.
DAOs, DeFi and exchanges will be required to legally register in the US!
After XMR hit the $200 resistance, i think it will drop to $137.
Looking forward to read your opinion about it.

XMR Monero riseMultiple channels have confluence of resistance at 225-228 that price will likely meet if CCI breakouts of its downward trend soon.
Inverse head and shoulders printing with a measured move to 246.

$XMR CUP & HANDLE $6000 targetcup and handle
base measure coincides with fib extension
$6,000 target
some day in the future
maybe

$XMR - Price entered Bullish Breaker - Will Act as support *SMT* My Last XMR Signal did not go as well. However, I believe I found where I went wrong and will be able to correct it with this signal.
*SMT* = Smart Money Theory = everything you think that is not retail related to trading. First, SMT does not believe that triangles, wedges , trendlines , channels, harmonics, etc. has any effect on how price reacts. I'm Sorry, but you won't convince me that Bitcoin knows it has created a triangle and that it knows how to react from that? It does and will remember price levels, that's it. The second is to recognize that the price is not random, it is set by an algorithm controlled by those that control the asset. The Third thing to remember is price will move toward attacking where there is Liquidity (Equal Highs, Equal Lows, phantom Trendlines etc.) and Balance (Fair Value Gaps, Liquidity Voids.) That's the basics. The rest is very unique in the vocabulary you need to have and the concepts that wrap around these ideas.
So we have a long term Low High Lower-Lower formation in the upward movement of the price action of the chart. The high candle is the the Breaker. This is part of Smart money theory that's hard to explain without giving a video. But the price at this point should not get lower than the last up candle between 170 and 175. My entrance was 175.50. Stop loss is 169 and aiming bullish for the inverse ofr the 62% around 194.50. Then it might return lower, I'm not sure. But I think this Breaker Will hold and cause a short bullish run at least.
Closer up of the the chart
After it completes the run, The I have a feeling it will have another decent fall into the imbalance belowe the currrent support as seen pictured here:
Lastly, if the price stays near where it is, it is in confluence with the exit of the trade as there is a bearish order block right at the price near 194-195
As for now. I'll be on top of this trade and keep it updated as much as I can. I'm only trading 3 cryptos right now, BTC,ETH, and XMR. We'll see if I'm right this time.
SKILLING:XMRUSD
GATEIO:XMRUSDT

XMRUSD ❕ trend breakThe uptrend has been broken.
Price is moving in a downward channel.
XMR is under the major MAs at 30m Timeframe.
I expect Monero may continue to fall after fixing under resistance level.

Monero can Decrease Or Increase Depending on a Reaction from 170MXR (Monero) was in a Big Rising Wedge pattern. The Pattern Was going to Decrease the Price and It Did! The Price is gonna Decrease to the Bottom of the Pattern But For Now The Price shall fall to 170$ and after that We shall see What is gonna Happen. Two Scenarios Can Accrue! One is that the Price would Continue To Decrease and It would reach 155$ and another Scenario is that the Price would Start to Increase from there and Get Back to the top of the Pattern. We shall wait and See What is gonna Happen.
-MXR was in a Rising wedge pattern
-It's already Broken by the Price
-The Price shall fall to 170$
-if it would Continue to decrease 155$ is the Target
-If it doesn't Price will Increase
-In a Few days we can Come to a Conclusion.
_ _ _ _ _ _ _ _ _ _ _ _ _ _ _ _ _ _ _ _ _ _ _ _ _ _ _ _ _ _ _ _ _
Thank you for seeing idea .
Have a nice day and Good luck

MONEROXMR/USDT i see this Rising Wedge Pattern is just broke and i take SHORT POSITION
Entry - 194
TP - 150
SL - 209

XMR - LONGHey Guys, I opened a long position and see a possible entry above the green box if you want to open a long too. I take my first profit on the next resistance you see on the chart. But please be careful because of BTC.
NO FINANCIAL ADVICE | DYOR | HAPPY TRADING

Reverse Head and Shoulders for MoneroA little reverse head a shoulders action for Monero... (jeez, I come back stateside and the whole neighborhood is gone. It's going to be okay everybody!)

XMR - have still difficulties in being bearishXMR has violated support on the 185 - 189 USD level.
However it reclamed that level very rapidely.
MONERO has formed a beautiful cup & handle pattern on the USD pair.
Difficult to be bearish - despite present market conditions.

Monero (XMR) - May 23hello?
Traders, welcome.
By "following", you can always get new information quickly.
Please also click "Like".
Have a nice day.
-------------------------------------
(XMRUSDT 1W Chart)
Resistance: around 218.2
Support: 125-156
It is important to be able to walk sideways in the 156-218.2 section.
125.0 and below are likely to enter the mid- to long-term investment area.
(1D chart)
Primary resistance: around 190.0
Secondary resistance: around 218.2
1st support: 156.0-170.6
2nd support: around 125.0
If it fails to move above 190.0, we should see if there is support above 170.6.
------------------------------------------------------------ -----------------------------------------------------
** All indicators are lagging indicators.
Therefore, it is important to be aware that the indicator will move accordingly as price and volume move.
However, for the sake of convenience, we are talking in reverse for the interpretation of the indicator.
** The MRHAB-T indicator used in the chart is an indicator of our channel that has not been released yet.
** The OBV indicator was re-created by applying a formula to the DepthHouse Trading indicator, an indicator disclosed by oh92. (Thanks for this.)
** Support or resistance is based on the closing price of the 1D chart.
** All descriptions are for reference only and do not guarantee a profit or loss in investment.
(Short-term Stop Loss can be said to be a point where profit and loss can be preserved or additional entry can be made through split trading. It is a short-term investment perspective.)
---------------------------------

XMRUSDT$ midterm
$ short Position
$ The probability of success is high
$ Open your position after getting confirmation
(Please confirm and enter to enter the transaction and note that this is not a trading offer)

XMR/USDTIn this market situations, it is a huge risk to making trades. However, if you are one of the risk lovers there is a trade option. Do not trade before 4h close above the enter price.

XMRUSDT decision zone hi guys
if we brake the resistance and close 4h candle above we are bullish
and if not we have to wait

XMRUSDT TREND LINE ANALYSISNice to meet you, everyone
I'm an alt trader
I'm analyzing and recommending things that are similar to my personality among many alt coins
----------------------------------------------------------------------------------------------------------------------
It retest after breaking the upward trend.
If the retest is successful, it will go down.
