Monero - Daily UpdateBottom Line: Higher against 60.40 in a developing third wave at larger degree.
Key Levels: Below 60.40, 74.01, 86.59, 116.55 Above 135.08, 162.42
Outlook: Against 74.01, Monero should continue higher within a larger degree third wave advance.
Analysis: Yesterday's comments still apply: "Monero is little changed, although the 109.69 low has stayed intact. We next want to see impulsive trading above 128.52 to both confirm the end of the wave ((4)) correction and to set up a break of the wave ((3)) high at 139.73."
XMRUSDT

XMRUSDT completing Gartley | A good long opportunity aheadOn the small time period 1 hour chart , the price action of Monero (XMR) is completing final leg of Gartley and soon it will be entered in potential reversal zone.
Buying And Sell Targets:
The buying and sell targets as per Fibonacci sequence of Gartley formation should be as below:
Potential reversal or buying zone: $154.74 to $154
Fibonacci projection or sell zone: $155.32 to $156.73
Stop Loss:
The potential reversal zone area that is up to $154 can be used as stop loss in case of complete candlestick closes below this level.
Possible profit and loss ratio:
As per above targets this trade has a profit possibility of 1.70% and as per the above-mentioned stop loss, the loss possibility is 0.48%.
Note: Above idea is for educational purpose only. It is advised to diversify and strictly follow the stop loss, and don't get stuck with trade.

Dot forming bearish pattern We can see a clear rejection in the daily chart at the resistance point ( 5.5). A shooting start candle formation can be seen which is obviously a reversal pattern and if we inspect the history it can formed shooting star patterns twice and the trend had reversed.
Placing buy orders at first support 4.85 and 4.5 will be nice. In my opinion it will get bounce from first support itself. Dot is a safe coin to trade so if it come to any of these zones don't hesitate to accumulate.
What's your view on Dot?
Regards,

XMRGood day traders,
I only do algo trading as emotions are harmful.
XMR is set to skyrocket.
If you wanna use the strategy for free contact me.
This is not trading advice, trade at your own risk.


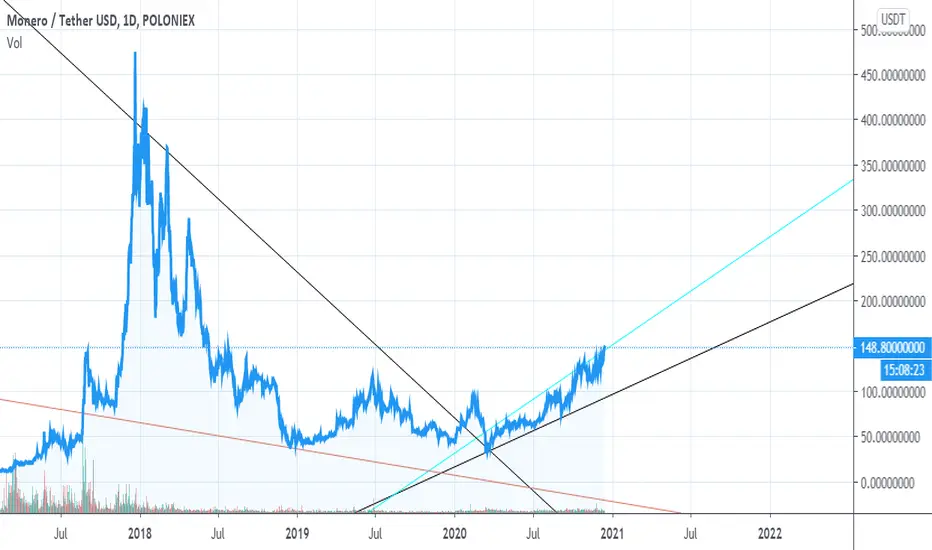
XMR Long (D1)After selling climax occured in the middle of March, 2020, XMR started to slowly climbing towards the 2-year-range's upper boundary.
The majority of coins were distributed within that range. Why?
1) Selling climax
2) 2-year-long consolidation
3) quick retrace from a pullback at 120 price level.
Why long?
1) BTC already hit ATH. ETH has 2x way to go. XMR still has 3.5x room to grow towards ATH
2) strong PA near upper boundary: slowly but steadily climbing through resistance. Stronger than of BTC's!!
3) Selling Volume is declining while XMR is drawing ascending price structure and steadily scraping through...
4) R/R = 4 (first target). Nothing in between 120 and 280 levels
5) 2nd target's R/R = 6. 3d R/R = 8
Looks like a great opportunity to flip BTC to XMR. Or just Long XMR/USD.
Btw, orange curve line was drawn in Nov'19 or earlier. Don't remember exactly. But I don't have any proof. So, you can just believe me or not.
So, I was waiting for this trade 1.5 years. Patience is a virtue. But I should practice it to get that skill.
Have a nice ride!


Monero XMRUSDT - The most bullish altcoin in December- Monero is definitely the most bullish altcoin in High-Cap category
- We can see Head and Shoulders, cap and handle or Ascending triangle on the daily chart
- The coin is currently breaking out the previous swing high established in October
- 280 is the next target and we can reach all time high next year in 2021
- Monero is one of the best coins, that will survive long term
If you want more of these ideas, hit the like button and follow me, so you don't miss any update!
Also, check my signature down below ↓


XMRUSDT - own gameThe asset has its own game.
Pressing the level 140.
Global trend up.
Need consolidation under level.
And should expect a breakthrough up.
You will learn the best place where we can trade this instrument at low risk.
Write in the comments all your questions and instruments analysis of which you want to see.
Friends, push the like button, write a comment, and share with your mates - that would be the best THANK YOU.
P.S. I personally will open entry if the price will show it according to my strategy.
Always make your analysis before a trade


POSS. XMR BREAKOUT! (XMR/USDT)XMR is trying to break out from what appears to be a macro bull flag pattern. If it can hold above the trend line & 200SMA, we could see significant upside and a retest of previous yearly highs.
happy trades ~
CD

DON'T SLEEP ON XMR/USDT!!! Nice Consolidation period...XMR Chart is beautiful right now. We broke back into the ascending channel that XMR has been trading in for months since breaking out from macro downtrend.
It would be nice / easy to assume it will *stay* in the channel, break through recent resistance and move higher... But I have a feeling that with the uncertainty around BTC right now, we may just as easily see another dip down, weeding out the weak hands and allowing for more consolidation before the next move higher. There's a naiiiiice curve forming that I have a feeling we may stay within during this period.
XMR has the advantage of being one of (the?) oldest privacy coins in the market. Like most USD pairs, it generally trends with BTC, and being a large cap, it takes more volume to really move the price, but as we've seen with everything, there have been some really nice upswings that usually easy to spot.
Guys, I like looking at charts, but I'm really not that successful at trading because i tend to overtrade. XMR is one that I find fairly easy to trade, and has been so faithful to it's high-TF patterns that it makes for a great mid-term hold.
DON'T SLEEP ON XMR!!!


XMRBTC_DailyPrice:0.006754 BTC
TP_LVL I: 0.0079 BTC
TP_LVL II: 0.0090 BTC
SL: 0.000058 BTC
Expected Return: 35 %
Risk/Reward: 2.3

XMR Just Increased 10% Within An HOUR! This is How To Trade.All information can be found on the chart. I tried to make it as self-explanatory as possible. In case you still have any questions, free free to leave a comment or send me a personal message.

XMR/USDT (1D) - Midterm Plan - Accumulation Hi Traders,
Finally got back to trading, and prepared few analysis for you.
As you can see, I expect that Monero finished First impulsive wave and now we are in the middle of Correction = Accumulation phase.
My buy positions are stacked from 120-104 USD (About 8 levels every 2 USD) to get as best price as possible.
In case of 1to1 extension of Wave 3 - Target could be around 210-230 USD... In case You are willing to Hold that long. (Several months). On Short term scale you can follow 4H chart and count partial waves inside of Wave 3.
Good luck and trade safe. BTC is near ATH so anything could happen ;)

✳️Monero/USDT (20/11) View + Trading Plan #XMR $XMRXMR has risen very strongly since September and is in the correction phase. But it looks like XMR will continue to climb further to the 150-160$ zone in December. However, XMR needs to conquer the 125$ zone, and that will be the moment we buy XMR.
If the XMR fails to rise to that zone, we will buy at lower price zones.
📈BUY- LONG
-Buy: 100-102$, SL if B
-Buy:: 125-127$ if B, SL if B
📉SELL-SHORT
-Sell: 134-136$, SL if A
-Sell: 154-156$, SL if A
♻️BACK-UP
-Sell close to 100-102$ if B, SL if A
❓Details
Condition A : "If 1D candle closes ABOVE this zone"
Condition B : "If 1D candle closes BELOW this zone"
