Can KOLD make it through the summer?KOLD is a leveraged inverse of natural gas futures contracts. Natural gas prices could see a rise
this summer as it is fuel for electric plants to make electricity to power air conditioning and
charge all the new electric cars. Hydroelectric and wind might be green put they contribute
little to the large power grid. NG is better than coal and diesel. So if a supply and demand
imbalnce develops what does Eco 101 say will happen to prices ? KOLD will go down and BOIL,
its inverse will go up as rising current prices will reflect in futures contracts in months ahead.
On the chart, KOLD is seen in an uptrend and the RSI has crossed over the 50 line while
price has crossed over the POC line of the profile ( mean price at which the most shares traded
over the given date range). Bullish momentum is slightly dominating with moving averages
diverging. A volume void above may result in a small jump along the way. Will the summer
heat drive up NG prices and make KOLD melt?
Xngusd

UNG- Buy at a BottomAs shown on the 4H chart, UNG has been trending down albeit with a triple top in April
and a head and shoulders in early May. It is presently at the bottom of the long term volume
profile and two standard deviations below the running mean anchored VWAP. This is
deep undervalued territory. On the MACD indicator, the K and D lines intersecting while under
the histogram which is positive portrays an early entry signal. I believe that it is inevitable
that UNG will have an uptrend in June as it did in April and May. The uptrends had a slope
of about 1.5-3% per day while underway. I will take a long trade in UNG and potentially BOIL
while leveraging XNGUSD on forex. For UNG, the targets are the POC line of the volume profile,
and mean VWAP , the final target is one standard deviation above VWAP while the stop loss
is three standard deviations below VWAP ( thin green line).

XNGUSD ( Natural gas ) Short Term Selling ideaHello Traders
In This Chart XNGUSD HOURLY Forex Forecast By World of Forex
today XNGUSD analysis 👆
🟢This Chart includes_ (XNGUSD market update)
🟢What is The Next Opportunity on NZDCHF Market
🟢how to Enter to the Valid Entry With Assurance Profit
This Video is For Trader's that Want to Improve Their Technical Analysis Skills and Their Trading By Understanding How To Analyze The Market Using Multiple Timeframes and Understanding The Bigger Picture on the Charts.

UNG retracement complete- to uptrend again.UNG as shown on the 15-minute chart had an untrend for a week culminated by the very steep
finish to the uptrend into resistance followed by a very rapid bounce down and retracement.
A standard 50% Fibonacci retracement is now complete. UNG appears to be bounding off
the POC line of the volume profile which coincides with the 0.5 Fib level.
UNG tracks the natural gas futures, especially the leading month. It appears now ready to
resume an uptrend. This is a directional bearing on the trend for any instrument based on
natural gas prices including XNGUSD on forex.

Can XNGUSD short squeeze?XNGUSD on the weekly chart showing two years of price action with weekly candles
shows the rise in 2021 into spring 2022 then printing a head and shoulders pattern
and the reversal to deep into the support/demand zone. The volume profile shows
the majority of the trading during this time period to have been between $3.75 and
$ 8.50. It would seem likely that there are a sizeable amount of short sellers holding
positions with unrealized profits of 50% to as much as 300%. This past week had the
best buying volume in six months and provides bulls with optimism
If natural gas can gain some momentum and put in green candles with a decent price range for
a couple of weeks in a row, the combination of new buyers with new interest and short sellers
liquidating and buying to cover their unrealized gains might ignite a bit of a rally for natural
gas. I will keep natural gas on watch. I will keep in mind that a breakout without a
corresponding volume the response could be a fakeout. A stop loss would be $1.95 below the
support zone while the final target would be $4.75 below the POC line. Interval take profits
would be 10% of the forex lots every time the price rises by $0.50 for risk management and
good profit taking while underway.

XNGUSD Bull Pennant Pattern Short then LongXNG has had a big week with a big bullish momentum move into a symmetrical triangle
and then a breakout into a bull flag pattern to finish out the trading week. A Bollinger Band
squeeze as the symmetrical triangle was underway preceded the breakout. PRice crossed the
POC line of the volume profile where trading volume , liquidity and volatility all are the
highest Equities and equity funds like BOIL, KOLD, UNG, UNL, LNG had corresponding moves.
The Luxalgo ECHO indicator, a predictive AI tool, suggests that from here XNGUSD will retrace
5% or so perhaps targeting the mid/basis line of the Bollinger Bands and then resume its
upward trend. the retracement would be 50% of the uptrend which started the morning of
5/18 which was a 10% move. The indicator is predicting the uptrend resumption for
5/22. By extension, equity instruments that mirror natural gas prices presumably will have
similar moves. I conclude that my profits achieved in BOIL options after the big move
should be prtially taken off the table to buy some KOLD calls or BOIL puts instead to hedge
for the prediction of the algorithm tool.

An Important Bullish Breakout in the Natural Gas MarketThe price of natural gas in USD rose sharply on Thursday after the US Energy Information Administration (EIA) reported a slightly smaller-than-expected weekly increase in domestic natural gas inventories.
At the same time, an important breakdown of the contracting triangle pattern formed by 2 lines (shown in blue) has formed on the XNG/USD natural gas chart.
Presumably, this triangle delineates a market stage in which large players could accumulate long positions at low prices after the downtrend that has been in place in the natural gas market since the beginning of 2023.
On Friday morning, the bulls are able to keep the progress made, keeping the price of XNG above the former resistance at 2.575, which can now serve as support.
This breakdown may become a stage in the development of an important bullish trend. We previously reported that according to EIA forecasts, the average price of natural gas in 2023 could exceed USD 4.
Start trading commodities with tight spreads. Open your trading account now or learn more about making your money go further with FXOpen.
This article represents the opinion of the Companies operating under the FXOpen brand only. It is not to be construed as an offer, solicitation, or recommendation with respect to products and services provided by the Companies operating under the FXOpen brand, nor is it to be considered financial advice.

XNGUSD Silver is coming down as us cpi data comes strong and us dollar gain let see how it react at demand zone

XNGUSD showing StrengthBased on Daily timeframe, XNGUSD almost last 52 trading days defending it's low level. Now we see some strength from lower level.
can we see XNGUSD at 5.5$ in coming trading days?

XNGUSD ready to reverse recent downtrend LONGOn the daily chart here XNGUSD had a head and shoulders or double top last summer and fall
and has now trended down to support. I see this as a prime place to take a long position.
The decline of the overvalued USD contributes to this idea as does the persistent demand in Europe
for compressed / liquid NG and the ongoing war there that could eventually grind into WWIII.
ETFs such as BOIL , UNG and UNL may be a good way to make this trade if not in the forex market.

XNGUSD....4H= Technical analysis of natural gas against the US dollar on the 4-hour chart
= The analysis is based on price channels and trend analysis
= When it exceeds the level of 2.811, its first target becomes = 3.693
= If it exceeds the level of 3.693, its target becomes = 4.812

XNGUSD ready to reverse recent downtrend LONGXNGUSD has been on a long downtrend. On the 1 H Chart,
a falling wedge is seen awaiting a breakout. Moving Average slopes are
decreasing their negativity towards zero. ATR / Volatility is decreasing
as is the downtrend momentum on the average directional index indicator.
I see this as a long swing trade setting up for forex or alternatively
a natural gas ETF like UNL / UNG or a natural gas stock like LNG. This
trade would be propelled by the dollar losing strength, inflation being
sustained, WW III in Europe continuing and the weather turning cooler the
remainder of the winter.


NATGAS (XNGUSD) ALL NEAR Support and Resistence AreasNatural gas (XNGUSD) is currently trading near key support and resistance levels. The near-term support and resistance levels are important to watch, as they can provide insight into the direction of the commodity’s price.
15M Chart:

XNG| GAS |DECRYPTERS | XNGUSD ForecastHi people Welcome to Team Decrypters
lets keep it simple we are at Multi month low on XNG so here is a possible upside in short to Mid term , I hope this can be a good Trade for every one

Possible BOIL Cup and Handle in formation ENERGY PLAY LONGBOIL could be setting up a long continuation trade
Now working on the handle. MACD shows the lines crossed
while under the histogram is very often an excellent sign.
Time will tell- My preferred trade will be call options
expiring in late January or February.
( This is a triple-leveraged natural gas play with
the upcoming winter heating season expected to be
expensive especially in Europe. The inverse is KOLD
which would be a good put option right now.)
AMEX:BOIL

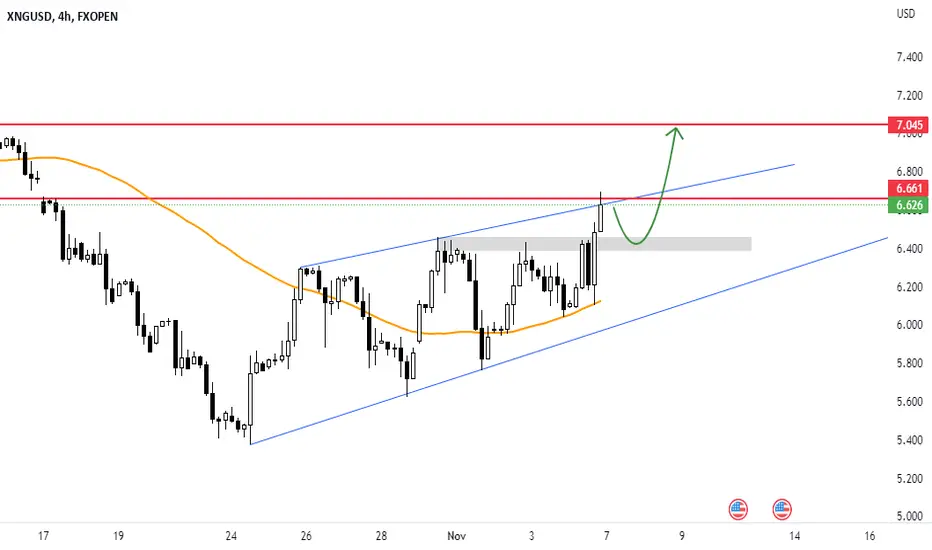
XNGUSD - NGAS NEXT WEEK MOVEGas this week had a strong bullish movement, and I expect it to complete this movement next week, with a correction that may target 6.40 levels, from which it may launch towards 7.0 levels.The gas has been in an ascending channel for 11 days, but will it breach it and rise towards the 7.0 levels? We wait next week to see what it has in store.
🔥💥 Like, Shared and subscription 💥🔥
Note: If you are a beginner trader, you should be aware of these rules:
1: Do not covet
2: Don't trade too much
3: Secure your positions after entering the profit
4: Enter contracts that fit your portfolio
5: Adhere to all recommendations
gaz naturel et buy now This market is witnessing an unusual movement and the possibility of a rise is very high
My advice is to buy

LNG Natural Gas Energy Play LongAMEX:LNG
LNG having trended down with the fall in the price of natural gas is now sitting in the support zone.
I anticipate an up-trending retracement to potentially as up as the resistance zone.
Rising relative volume and rising relative strength lend support to a reversal as does
the consolidation in the price of natural gas after a recent fall.
As a swing long trade the stop loss is below the support zone with the first target of about $ 160 or a 50% retracement
and the final target at $ 167 before resistance.

XNGUSD ready to reverse recent downtrend LONGGLOBALPRIME:XNGUSD
XNGUSD a few weeks back downtrended afer breaking the neckline of a head and shoulders pattern down to
the support of a double bottom formed in early August. Volume profiles are added to the 30 minute chart.
I see an uptrend retracement of the recent downtrend and accordingly the following:
Stop Loss at 7.64 just below the recent swing low
Target 1 8.59 the bottom of the high volume areas and near the Fib 0.382
Target 2 8.84 just under the Fib 0.50
Target 3 9.15 just under the POCs of the volume profiles and the neckline of the head and shoulders pattern.
Fundamentals: decreasing DXY will cause a relative rise in commodities; winter is coming storage of compressed NG
is underway and increasing demand.
All is all, this forex pair is ready for a long trade.

BOIL beginning a round bottom reversal LONGAMEX:BOIL
BOIL a triple leveraged ETF based on natural gas as a commodity and its futures
on the 15-minute chart has begun a round bottom reversal into an uptrend. The AO / Candle indicator
confirms this as does the curve of the accumulation /distribution indicator. Fundamentally, natural gas price
is rising especially with the DXY dollar value in a mild correction. Winter heating season is upcoming and the energy
crisis in Europe accelerating with Russia shutting down ( for now only ?) its remaining active pipeline.
Right now long BOIL looks to be an excellent setup.

XNGUSD/ NGAS Long UpdateGood day traders,
Following all our NGAS signals hitting massive Take profit points, we have one current trade running on the monthly timeframe. After a successfull retest an ABCD bearish harmonic trend hike is currently beign formed, we are almost at the end of that trend hike. We now expect the XNGUSD/ #NGAS/ Natural Gas to reach 11.3 before retracing to meet our final take profit point 14.
Disclaimer
NASDAQ Guru offers general trading signals that does not take into consideration your own trading experiences, personal objectives and goals, financial means, or risk tolerance.

XNGUSD Long - Week 07 + 08 - 02Cup and Handle in formation on all 1h/2h/3h/4h charts.
Possible reversal confirmation - still pending
