THE WEEK AHEAD: TGT, ANF, COST, XOP, OIH, FXIA trio of retail names, TGT, ANF, and COST announce next week ... .
TGT announces on 3/6 before market open. Preliminarily, the March 16th, 11-day, 20-delta 69.5/81 short strangle pays 1.54 at the mid, with its defined risk counterpart, the 66.5/69/81/84 iron condor paying under 1/3rd the width of the wings at .83/contract, slightly shy of the credit I like to receive on those to pull the trigger.
For those into the short put/acquire/cover cycle type trade (I'm going to refer to these as "spack" trades for short):* the 30 delta, March 16th 71.5 short put is paying 1.37 at the mid, which would yield a cost basis of 70.13 of any assigned shares, a discount of 6.7% over where the underlying is currently trading.
ANF announces on 3/7 before market open. Given the size of the underlying, I'd probably go short straddle, with the March 16th 21 paying 3.22 at the door and its defined risk iron fly variation -- the 17/21/21/25 paying 2.56, slightly greater than 1/4 the width of the long strangle component of the setup, which is what I want to see at the least out of an iron fly.
The "spack" trade: the March 16th, 30 delta 19 short put is paying .91/contract, yielding a cost basis of 18.09 in any assigned shares versus 20.68 market, a 12.5% discount.
Lastly, COST announces on the 7th, after market close. The March 16th 177.5/200 short strangle is paying 2.40, with the defined risk 172.5/177.5/200/205 paying 1.21, somewhat short of 1/3rd the width of the wings.
The spack trade is to sell the March 16th 182.5 for 2.31/contract which would result in a cost basis of 180.19 in assigned shares -- a 4.8% discount over where shares are currently trading.
Sector-wise, the volatility remains in a familiar place, with XOP/OIH having the highest (34%). FXI (29%), XRT (27%), and XHB (26%) follow in descending order, with background implied a bit on the light side (I like >35% to bother).
Depending on your thoughts about where petro is heading: The XOP April 20th 31/37 short strangle is paying 1.01 at the mid (neutral assumption); the April 20th 32 short put (bullish assumption) is paying .74 with a resulting cost basis of 31.26 (an 8.4% discount over current share price); and the Plain Jane slightly monied April 20th 34 covered call (buy shares at 34.14, sell the April 20th 34 short call) costs 32.50 to put on (a 4.8% discount over current price) (selling the April 20th 34 short put for 1.47 yields basically the same metrics).
The FXI April 20th 44/51 short strangle is paying 1.41 at the mid, with the spack trade being to sell the April 20th 45 put for a .94 credit, resulting in a cost basis of 44.06 per share, a 6.8% discount over where the underlying is currently trading.
* -- Generally speaking, the cycle is to: (a) Sell puts. At expiry, if price is above your strike, you keep the premium. (b) If at expiry, price is below your strike, either allow yourself to be assigned, or roll the short put out "as is" for credit and therefore further cost basis reduction. (c) On assignment, proceed to cover your shares by selling calls against at or above your cost basis in the shares, looking to exit the trade profitably.
XOP

OPENING: XOP JUNE 15TH 31 LONG/MARCH 29TH 34 SHORT PUT DIAGONAL... for a .15/contract credit.
As with any diagonal, there aren't many metrics to provide, since max profit is dependent on the number of rolls undertaken, the credit received for each, as well as whether the long maintains value. However, the max loss is the width of the spread (3) minus the credit received for the setup (.15) or 2.85. This is the max I can lose if I do nothing, and the setup goes to max loss. Similarly, my max profit is a whopping .11 ($11)/contract if price rips totally away from the setup, the long and short go to worthless, and I don't roll the short to take in more credit.
The particular thing I like about these setups is flexibility and the number of ways in which they can be worked intratrade:
(1) Allow the short put to go to at or near worthless (.05 or less), and then sell the long for a credit if it has held value in excess of the credit you received to put the trade on. The difference between the credit received for selling the long minus the credit you received to put the trade on is your profit (minus fees and any debit you paid to close the shortie).
(2) Work both ends of the candle. Roll the long down on significant increase in value to lock in gains and roll the short put down when you're able to do so for a credit. Alternatively, roll the short put out for duration and credit on significant decrease in value, leaving the long in place. Cover the setup for a debit that is less than total credits received. The difference between total credits received and the debit you paid to exit is your profit.
Keep in mind that if you burn both sides of the candle, you'll be widening the spread and therefore increasing buying power effect and max loss.
(3) Work the short put only. Roll the short out "as is" on significant decrease in value (I ordinarily do this at 50% max) and exit the trade when rolling is no longer productive (usually when price has ripped away from the setup). If price breaks the shortie, allow as much extrinsic to bleed out of the contract as you can, and then roll for a credit while examining whether you can strike improve on roll.
This is the generally accepted approach to these setups. The width of the spread (and therefore the buying power effect) remains constant throughout the process or decreases if you're able to roll the shortie down for strike improvement and a credit (decreasing the width of the spread and therefore max loss).
And we'll see how it goes ... .

THE WEEK AHEAD: P, HLF, XOPP announces earnings on 2/21 after market close; HLF on 2/22 after market. Any vol contraction plays you choose to pull the trigger on should be put on shortly before the close before which earnings are announced, when the background implied volatility is likely to be at its highest.
With background implied volatility over 100%, the obvious play in P is a post-earnings vol contraction play. Preliminarily, the March 16th 5 short straddle is paying 1.22/contract at the mid with break evens at 3.78 and 6.22, theta 2.14, delta -20. That being said, it's so low to the deck that I could also see going at the money short put, with the March 16th 5 shortie paying .49, giving you a break even of 4.51, which would be your cost basis in assigned shares, assuming it's in the money at expiry, and you don't roll out to reduce cost basis further.
The HLF March 2nd 77.5/91 delta neutral short strangle pays 2.97 at the mid with break evens at 74.53 and 93.97, a theta of 16.23. The comparable defined risk iron condor -- the March 2nd 73.5/77.5/91/95 pays 1.46 at the door with a max loss of 2.54, break evens at 74.53 and 93.97, and theta of 6.24.
As far as non-earnings/non-single name risk plays are concerned, the volatility appears to be highest in the petro sector at the moment -- in XOP, OIH, and XLE. Of these, the background implied in XOP is the highest, and the April 20th 31/37 delta neutral short strangle is paying 1.22 at the mid with break evens at 29.78 and 38.22, theta of 2.13. The corresponding defined risk play (the 28/31/37/40 iron condor) doesn't pay one-third the width of the wings, so isn't worthwhile. Naturally, you can consider the iron fly route, where the metrics are pretty good for the play: the April 16th 29/34/34/39 pays 2.73 with a max loss of 2.27, theta of 1.12, delta of -3.41.
In the volatility product arena, the /VX term structure remains "goofy" with a flat aspect front to back with the highest priced trading in March trading at 17.78, the lowest in June at 17.23 relative to a VIX print at 19.46, and we're still technically in backwardation with the front month (March) trading above April. That's a fairly narrow range for eight months worth of expiries* to trade in with little to no meaningful contango to take advantage of at the moment. That'll naturally work itself out at some point ... .


THE WEEK AHEAD: (WHAT THERE IS OF IT) - KRE, GDXJ, EWZ, XOP, VIXWith the shortened holiday week, I'm not expecting much out of the market in terms of volatility, so don't anticipate on putting on anything unless we get some exogenous event pop in the VIX.
However, there are a few that might be worth working possible setups in:
KRE (regional banks), with an implied volatility rank of 60 and an implied volatility of 22.
GDXJ (junior gold miners), uber low rank, but still decent background of 27.
EWZ (Brazil), 39/33.
XOP (oil and gas), 36/33.
I'll post trade ideas in those separately if anything looks potentially fruitful in those.
With VIX trundling along here at sub-12 levels, broad market looks subdued from a volatility standpoint, something that's likely to remain in place as the Senate end of tax reform is can kicked to after the Thanksgiving holiday recess ... .

could set up potential desc. triangle breakout $uwt $dwt I'm a buyer above top level resistances. C is optional for gamblers

OPENING: XOP DEC 15TH 32/34/40/42 IRON CONDOR... for a .49 ($49)/contract credit.
Metrics:
Probability of Profit: 63%
Max Profit: $49/contract
Max Loss: $151/contract
Breakevens: 33.51/40.49
Delta: 1.64
Theta: .99
Notes: Going small, defined, neutral assumption here, since the implied volatility isn't as high as I would like. Shooting for 50% max ... . The full on naked 34/40 in the same expiry currently goes for .82.


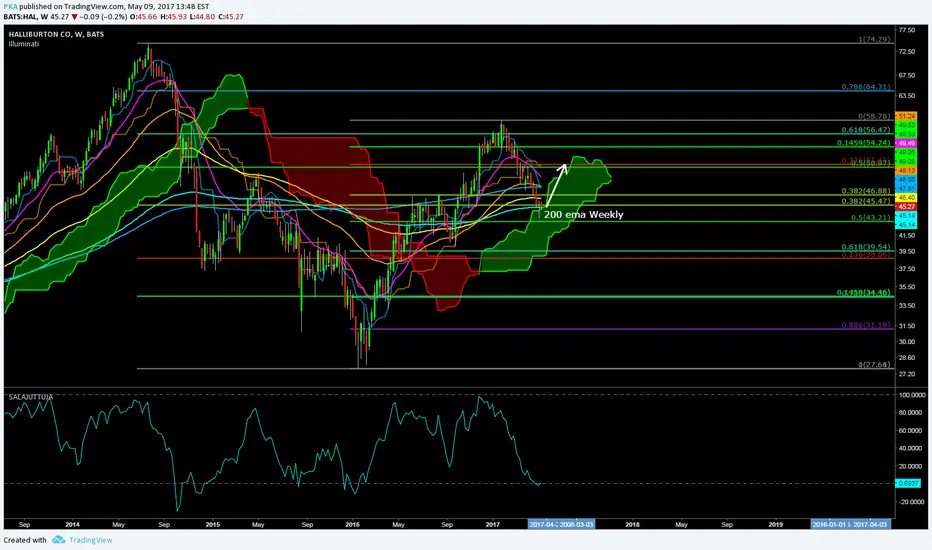
XOP: General Idea of Where this Channel is GoingSomething that you can predict is nice. XOP prices surging, should roll along in a channel pattern. Heiken-Ashi has been pretty good at predicting trend swings here.

XOP - Headed towards the top of a massive wedge. PT $38.50XOP appears to be looking to re-test the top of a massive wedge. Looking for contact around $38.50. Crude prices are providing a massive tailwind, I think we see $60 crude by December and $XOP will follow to the upside.


FOUR OPTIONS TRADE IDEAS FOR NEXT WEEK: HTZ, TLT, GLD, AND XOP... , one high implied volatility (HTZ), two low implied volatility (TLT, GLD), and one long-dated bullish assumption oil trade (XOP).
High Implied Volatility
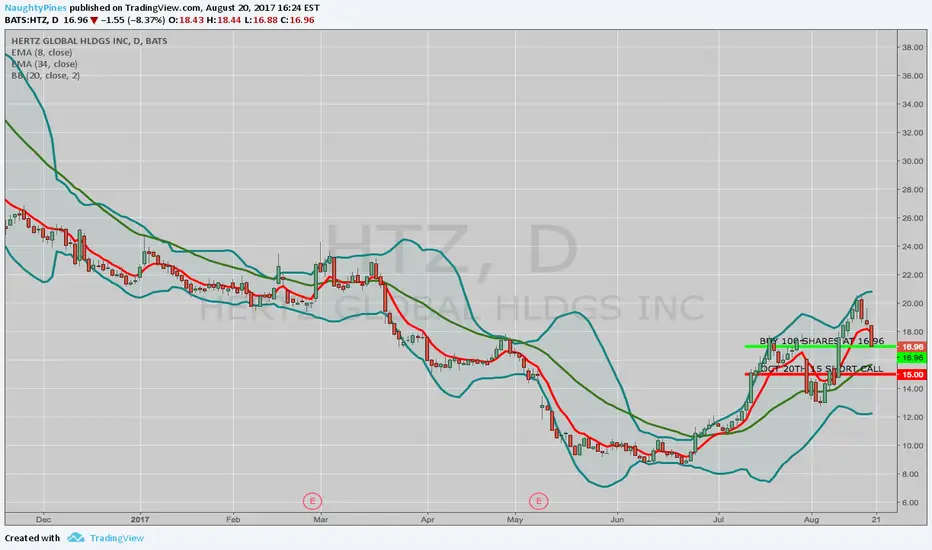
HTZ "Monied" Covered Call
Buy 100 Shares at 16.96
Sell Oct 20th 15 call
13.99 db (your cost basis in the shares)
1.01 max profit if called away at 15
Notes: Roll the short call out for additional cost basis reduction if it doesn't finish at 15 or you can't exit the trade before expiry around that mark. It's only got monthlies, so some patience may be required if you are unable to get your candy right away. An alternative approach would be to sell the 12.5 short put in the Oct 20th expiry (currently trading at .50) and then look to cover (monied or otherwise), if assigned.
Low Implied Volatility
Both TLT and GLD are in low volatility territory here, so look to deploy low volatility strategies on them ...
TLT Sept 15th/Dec 15th 125 put calendar
1.87 db
GLD Sept 15th/Dec 15th 121 put calendar
1.63 db
Notes: Roll the short put aspect out for duration "as is" on significant decrease in value, and look to exit the trade at 20% max of what you put it on for. Obviously, not "big money" plays, but also not big buying power pigs either ... .
Long-Dated Neutral to Bullish Assumption Oil Trade
XOP Oct 20th 31 short call/March 16th 21 long call Poor Man's Covered Call
8.06 db
Notes: Roll the short call aspect of this setup out for duration and credit to reduce cost basis in the setup and look to exit the trade for 10-20% max of what you put it on for. For a longer duration setup with the potential to reduce cost basis in the entire setup to zero over time, consider the Oct 20th 31 short call, Jan 18th '19 20 long call Poor Man's for a 9.54 db. An alternative instrument to consider which is also oil sensitive is XLE, although a similar setup comes with a heftier "entry fee" -- the Oct 20th 65 short call/Jan 18th '19 50 long call costs 12.29 to put on.
Short option for O&GERF has had a large run up relative to other companies in it's industry. There is a large wick with large volume, this is a sell signal to me. I'd pair this short off with some long XOP but either way I believe it should work.

XOP: 4am Dip in USOIL Futures Signaled Top-of-Channel ReversalOne significant dip in USOIL around 6am predicted a lower open and subsequent dip and daily run on USOIL and XOP today. Oil futures were down significantly, and XOP was trading at the top of its most recent channel.

Over 70% trade on XOP (Big Lizard)Closed a trade last week and had no position in XOP. Today we had a -2% move down and around 9% in the last month IV rank is not great, but right now not many ETF's have over 20 Implided volatility rank.
So I decided to sell a straddle with no upside risk (Big Lizard).
The trade:
Sold the 33 Call
Sold the 33 Put
Bought the 35 Call
Total credit $2.16

GUSH, XOP Follows Crude Oil FuturesIf you want to know how XOP, GUSH and DRIP are trending, just take a look at the crude oil futures. XOP responds to CLQ2017 throughout the day.

THE WEEK AHEAD: XOP/OIH/XLE, COSTPremium Selling
For the umpteenth week in a row, there is little in the market for high quality premium selling plays. Screening for 52-week >70 implied volatility rank, you'll basically get one quality hit at the moment, and that is COST, which has dipped significantly on AMZN/WFM merger news. A few names are approaching that 70 mark, but they have earnings three to four weeks out; you might as well wait to put on volatility contraction plays around earnings announcements in those cases. I previously set out a nondirectional play in COST (see Post below) that I didn't enter, having been distracted by something or other; I may reconsider that play now that the market's had an opportunity to digest the AMZN news.
Other names, such as NBR (petro, part of whose operations are deep water),* RAD (pharmacy in merger and acquisition with WBA), and BBRY (a kind of WTF, why are they still around) are too small in dollar value to be worth playing unless you dive in and go straight-on covered call or near-to-the-money short put.
Directionals
I've been waiting for several weeks to put on a bullish XOP, OIH, and XLE play. Each time I look at them, it appears that oil has trundled lower on rising rig count, total stock build, lackluster inventory draw, or a combination thereof.
I've been primarily watching oil prices around the supposed average shale production break even at $40 to go long in one of these underlyings. We may be close enough for me to make a play, but I'll probably continue watching. Lower is better for either a net credit put diagonal or a Poor Man's Covered Call in these guys.
Low Volatility Plays
With VIX continuing on its sub-12 bender, there probably isn't a better time to go put-side low volatility strategy in broad index underlyings (SPY, IWM, QQQ, DIA) using either calendars, net credit put diagonals, or debit diagonals. These capitalize on volatility expansion and movement of the underlying toward the put side, ideally allowing you to exit the short put aspect of the setup at worthless and recapture any value left in the long at the expiry of the front-month short. Heck, the dam has to break at some point ... .
* -- I regard most companies that rely substantially on deep water operations as largely doomed here. Most deep water operations require high per barrel prices that we haven't seen for a substantial period of time and aren't going to see in the short- to medium-term.

THE WEEK AHEAD: QQQ AND XOP/XLEWith Friday seeing a pop in QQQ implied volatility (six month implied volatility rank at 100; background implied at 19%), I'm looking to add in a touch of broad index core position here in the Q's, having just exited all my June setups. I have depicted the neutral assumption, defined risk July 21st 131/134/2 x 145/2 x 146 iron condor here (probability of profit: 52%; max profit: .91; max loss/buying power effect: 2.09; break evens at 133.09/145.46; theta: 1.12; delta: -2.32).
Some other variations:
UNDEFINED RISK/NEUTRAL ASSUMPTION
July 21st 132/146 short strangle
Probability of Profit: 68%
Max Profit: 1.67/contract
Break Evens: 130.33 (below 1 standard deviation)/147.67 (between expected and 1 standard deviation)
Theta: 5.29
Delta: .87
UNDEFINED/NEUTRAL TO BULLISH ASSUMPTION/NO UPSIDE RISK
July 21st 134/145/146 Jade Lizard
Probability of Profit: 82%
Max Profit: 1.60/contract
Break Even: 132.40 (between 1 standard and expected)
Theta: 3.94
Delta: 19.37
Unless you've been totally living under a rock, you'll know that oil's been "getting frisky." Oil's getting frisky means that underlyings like OIH, XOP, and XLE are getting frisky, too. Every time I've looked at getting into a bullish XOP or XLE setup, however, oil has dropped lower, so I've held off. While you can naturally just short put or short put vertical XOP or XLE, I'm inclined to do something that I can work for at least a couple of cycles* and that it is also defined risk. Enter the net credit put diagonal:
XOP July 21st 31 short put/Sept 15th 28 long put net credit diagonal
Buying Power Effect: 2.88
Theta: .72
Delta: 12.69
Most diagonals you pay a debit to put on, a proposition that I'm generally not fond of. Price can rip away from the setup; both options can go to zero; and you're left holding the bag, having paid what your max loss will be on the setup up front. Here, though, I'm looking to get a credit for the short put that slightly exceeds the cost of the long put (by a whopping .12), so I'll be able to avoid the aforementioned bag holding if the price of oil rips away from the setup during its lifetime. Unfortunately, as a "calendarized credit spread" (which is the way I generally work these), there aren't a good deal of metrics to look at, since max profit will depend on how much credit you collect through rolling of the short put, which can in turn depend on how price moves toward and away from the setup and/or implied volatility expands/contracts.

Neutral trade on XOPWith an IVR of 32, I Sold the 37/34 Strangle for $1.52.
Our break evens are at $38.52 and $32.48.
58% probability of profit

XOP: THREE BULLISH ASSUMPTION PLAYS IN ADVANCE OF OPEC TALKSWith XOP hanging around horizontal support here and with OPEC output cut extension talks and jawboning on the near-term horizon, it only makes sense to talk about petro plays with a bullish assumption, particularly due to XOP implied volatility rank (in the 74th percentile over the past six months) with background implied volatility at 34. Here are three:
LADDERED SHORT PUTS/SHORT PUT VERTICALS
The most straightforward of the strategies with a neutral to bullish assumption.
Example:
June 16th 33 short put
July 21st 32 short put
.97 credit at the mid
These are currently setup at the 20 delta strike. Look to take profit at 50% max, either one at a time, or for the setup as a unit. Generally, no intratrade defense. Toward expiry, look to roll out for duration and credit on test.
A defined risk variation on the nakeds, laddered short put verticals:
Example:
June 16th 30/33 short put vert
July 21st 29/32 short put vert
.64 credit at the mid
As with the naked short puts, look to take profit at 50% max, either individually or for the setup as a unit. Generally, no intratrade defense. Toward expiry, look to roll out for duration and credit on test.
POOR MAN'S COVERED CALL
Example:
Sept 15th 90 delta 28 long call/June 30th 30 delta 37.5 short call
7.28 db at the mid
Here, you're looking to reduce cost basis in your back month, long-dated option over time by rolling your short call out for duration and credit. With these, look to take profit at 10-20% of what you put it on for, taking into account any credits you received for rolls. Intratrade, look to roll out the short call when it's lost 50% of its value.
LIZARDS
There are several variations, all of which involve receiving credit for the entire setup that exceeds the max loss that could be experienced by the short call side.
Example (Naked Short Put + Short Call Vert):
June 30th 34/37.5/38.5 Jade Lizard
1.10 credit at the mid
BE at 32.90 (below expected move)
Example (Short Put Vert + Short Call Vert):
June 30th 31/34.5/37/38
1.02 credit at the mid
BE at 33.48 (above expected move)
Max Loss/Buying Power Effect: 2.48
Look to take these off at 50% max. Intratrade defense can be done by rolling the untested side toward current price to the extent it's productive. Toward expiry, look to roll the tested side out for duration and credit and to sell an oppositional side against for a credit that exceeds what you paid to roll, although it's generally just a walkaway trade if price blows through your short call side, since the max loss that can be experienced by that side will be less than what you collected in credit up front (i.e., all the risk associated with these is on the put side).

THE WEEK AHEAD: HPQ, LOW, BBY, GME EARNINGS; XOP, EWZ (NON)EARNINGS
HPQ, LOW, BBY, and GME are all up for earnings announcements. Out of these, BBY and GME appear to be the best candidates for premium selling, given their implied volatility rank and background implied volatility metrics, although virtually every liquid underlying with an earnings announcement bears watching; implied volatility can pop at the last moment, making them ripe for a play.
BBY announces on 5/25 before market open, so look to put on a play on the 24th before session close.
Preliminary Setups:
June 2nd 51.5 short straddle; 4.18 at the mid with break evens wide of the expected move at 47.32/55.68.
June 2nd 44.5/51.5/51.5/58.5 iron fly: 3.69 at the mid with break evens at 47.31/54.69; 3.81 max loss/buying power effect.
June 2nd 47/56 20 delta short strangle: 1.17 at the mid; BE's at or wide of the 1 SD at 45.83/57.17.
June 2nd 46/48.5/54.5/57 30 delta iron condor: 1.03 at the mid; BE's wide of the expected move at 47.47/55.53; 1.47 max loss/buying power effect.
GME announces on 5/25 after market close, so look to put on a play on the 25th before session close.
Preliminary Setups:
June 2nd 24 short straddle: 2.21 at the mid with break evens wide of the expected move at 21.79/26.21.
June 2nd 21/24/24/27.5 iron fly: 1.88 at the mid with break evens wide of the expected move on the put side, slightly short of the expected on the call at 22.12/25.88; 1.62 max loss/buying power effect.
June 2nd 22/26.5 20 delta short strangle: .65 at the mid with break evens wide of the expected move at 21.35/27.15.
June 2nd 20/22.5/26/28.5 iron condor: .72 at the mid with break evens wide of the expected move at 21.78/26.72; 1.72 max loss/buying power effect.
Due to the credits received for the short strangle/iron condor, would probably short straddle or iron fly.
NON-EARNINGS
The two exchange-traded funds with the metrics I generally look for: XOP and EWZ. I already have a non directional, defined risk EWZ setup on (an iron condor), so could look to add. With XOP, I'm looking at directional stuff (laddered short puts, laddered short put verticals, Poor Man's, or a setup with no upside risk, the concern being that OPEC will extend output cuts, causing this to rip skyward).