GOLD METAL MARKET TRADE SETUPS & SIGNALS For 12th Dec 2019www.youtube.com
I Publish Daily chart updates on over 49 Assets including Forex pairs, Indices, Commodities, Metals, Cryptos and more. Watch them via the above link
XPTUSD

GOLD METAL MARKET TRADE SETUPS & SIGNALS For 11th Dec 2019www.youtube.com
I Publish Daily chart updates on over 49 Assets including Forex pairs, Indices, Commodities, Metals, Cryptos and more. Watch them via the above link

Platinum eyes for highAfter move down a while ago, Platinum looks good to move up again before going down deeper.
Entrance: 890
Stop: 875
First target: 910
Final target: 929

GOLD METAL MARKET TRADE SETUPS & SIGNALS For 10th Dec 2019www.youtube.com
I Publish Daily chart updates on over 49 Assets including Forex pairs, Indices, Commodities, Metals, Cryptos and more. Watch them via the above link

PLATINUM Buy SignalPattern: Channel Up on 1M.
Signal: Bullish as the price is approaching the Higher Low zone of the pattern.
Target: 950 (below the 1D Resistance) and 990 (below the 1W Resistance).

XPTUSD AnalysisStill, it is in the long trend so do not expect much fall, however quite bullish in the long term and can break previous records

PLATINUM LONG IDEAGOOD RR SETUP HERE WITH PLATINUM, PRICE ACTION SHOWING RESPECT FOR THIS SUPPLY/DEMAND ZONE, I SEE IT MAKING A NEW HIGH AS IN GENERAL UPTREND.


Platinum (XPTUSD): Bullish Megaphone towards a new Higher High.Platinum posted a strong rebound on the 871.00 October 2nd low and is currently rising on 1D (RSI = 62.934, MACD = 2.660, Highs/Lows = 16.6714) towards a new Higher High. The Higher High is designated by the 1M Megaphone pattern it has been trading within since August 2018. The 1D RSI patterns suggest that a new bullish leg may start without needing to make a Higher Low. Our Target Zone is 1,020 - 1,040.
Keep in mind that XPTUSD has just initiated its new multiyear Bull Cycle, and we consider it a top investment in the coming years, a matter we analyzed on our long term analysis below:
** If you like our free content follow our profile (www.tradingview.com) to get more daily ideas. **
Comments and likes are greatly appreciated.

XPT USD SELL (PLATINUM - US DOLLAR)Hi there. Price is forming a continuation pattern to the downside. Watch strong price action at the current price for sell.

XPT/USD - SWING TRADEHi, today we are going to talk XPTUSD
We observe a H4, some important points. The details are highlighted above.
Thank you for reading and leave your comments if you like.
Targets: Exclusive to Traders Heaven members.
Stop: Exclusive to Traders Heaven members.
Join the Traders Heaven today, for more exclusive contents!
Link bellow!
Disclaimer: All content of Golden Dragon has only educational and informational purposes, and never should use it as financial advice

Platinum: Top investment for the coming years.In our search for solid long term investments in the coming years we have decided to share our long term outlook on Platinum.
Technically it recently broke above a 3 year Falling Wedge turning bullish on the monthly chart an effect that has since receded as it pulled back on the 1,000 mark (RSI = 50.285, MACD = -8.660, ADX = 25.926, Highs/Lows = 11.4571).
If the 1W MA50 holds this pull back and another spike prints a Golden Cross, then we may come across a unique multi year buy opportunity on Platinum as most parameters will be similar to the late 90's Golden Cross pattern when the metal entered a hyper strong Bull Cycle. The target will be 2-3 times the initial value.
We wish to add at this point that Platinum has fairly reliable pointers both on the short and long term and thanks to that most of our latest XPTUSD signals have met their target on high quality patterns. You can get an idea of those below:
** If you like our free content follow our profile (www.tradingview.com) to get more daily ideas. **
Comments and likes are greatly appreciated.


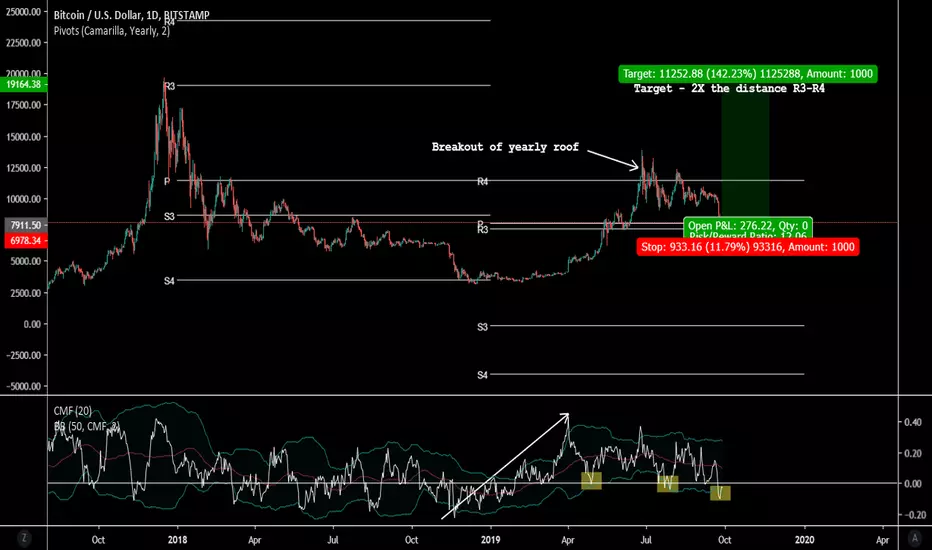
Reversal at yearly pivot expectedAs you price stopped at yearly pivot - as I predicted in my previous BTCUSD post a few weeks ago. Its also classic 50 percent Fib correction if you measure. 200 EMA is also there. Previously it broke through yearly camarilla breakout level R4 and pulled back to R3 as often is the case with Camarilla before the breakout continues. We should see a bullish move (impulsive 1-5 Elliott wave cycle) from yearly pivot. CMF shows bullish institutional accumulation and pullback to 0 area. If price would start bearish trend below Camarilla R3 - then it is likely to drop last year's close or all the way Camarilla S3.
Platinum - Consolidation / Price At Support LevelXPTUSD sitting at support level from recent consolidation. Also, back-testing descending trend-line from previous breakout.
Resistance is up near $1960, offering a decent RR setup, depending on where on places their stop.
One final consideration.... We're heading into seasonal strength. While there are many fundamental details to consider, I like the odds posted below and I don't mind being a few days early. ;)
Platinum Futures Continuous Contract Seasonality
Analysis has revealed that with a buy date of October 4 and a sell date of May 23, investors have benefited from a total return of 761.53% over the last 10 years. This scenario has shown positive results in 10 of those periods.
www.equityclock.com
Lonf from $930

XPTUSD H1 12/09/2019Hello Traders!
We play with Smartmoney concepts, that means that we look mostly on PA to determine what will happen in future.
As we all know, price is moved by BIG players: Banks, Institutional traders, HFT bots (we call them all of them SM).
They can't play as we do, cause of a HUGE lot sizes, so cause of that they need to SELL to BUY and BUY to SELL for positioning them self in the best possible spot.
If u were learn about trading from free and accessible knowledge, u probably heard about BUYing LOW and SELLing HIGH?
So SM must BUY LOWER and SELL HIGHER :)
We as retail traders are just a small fish in this ocean, so we need to catch the waves which are created by SM.
Here u will find a thought process to identify these spots on chart, where SM stuck with their orders.
We want to play with SM so, we looking for entries (depending of direction) on HEC in 3 spots:
- top of WICK
- top/bottom of BODY candle
- 50% of BODY candle
CHARTS AGENDA:
SM - SMART MONEY
PA - PRICE ACTION
HEC - HIGH ENERGETIC CANDLE (LAST OPPOSITE CANDLE BEFORE MOVE) <- SM MUST SELL TO BUY AND BUY TO SELL :)
BITCOIN SIGN - MONEY POCKET (SL, BUY STOPS, SELL STOPS) - EQH - EQUAL HIGHS / EQL - EQUAL LOWS
BLACK ARROWS ARE ABOVE AND BELOW THESE MONEY SPOTS POINTING FUTURE TARGET
BLUE LINES - ENTRIES WITH SMART MONEY MITIGATION MOVE - SNIPER ENTRY FOR US
BLACK LINES FOOT PRINTS - SPOTS ON CHART WHERE SMART MONEY SHOULD COME BACK TO GET OUT OF THEIR POSITIONS IN DRAWDOWN (SM MUST SELL TO BUY AND BUY TO SELL) - POTENCIAL SNIPER ENTRIES
BLACK BOX - GAP's (IPA - INSUFFICIENT PRICE ACTION) - SPOTS ON CHART WHERE PRICE MOVED TOO FAST, AND LEFT SOME "WHOLES" IN PRICE ACTION WHERE ALGORITHMS WHAT TO COME BACK AND FILL IT BY "HEALTHY" PA.
I'm so grateful to all of my Mentor's which I met on my trading journey for this knowledge, and cause of struggling few years to discover how the market really moves i decide to share it for free with all of u.
My only goal with it is to Help all of u to have a breakthrough in your Trading Journey and obviously it will impact all your surroundings <- generate more time 4 u, more freedom and this will impact others.
If u have any questions feel free to ask:)
GOD BLESS U ALL!

XPT USD SELL (PLATINUM - US DOLLAR)Hi there. Price is forming a continuation pattern to the downside. Wait for the price to hit the top of the pattern and watch strong price action for sell.


Platinum (XPTUSD): Lower Buy Opportunity.XPTUSD has been on a very strong rise in late August almost hitting the 1,020 - 1,045 1M Resistance Zone. Despite trading on bullish 1W technical values (RSI = 64.131, MACD = 26.660, Highs/Lows = 45.6178), the volatility itself is high enough (ATR = 41.0321) to justify a pull back to the 1D Support (890).
This is where we expect Platinum to seek buyers as long as the 1W MA50 (blue line) provides support. Once this pull back is completed we will aim again for the 1,020 - 1,045 Resistance Zone.
** If you like our free content follow our profile (www.tradingview.com) to get more daily ideas. **
Comments and likes are greatly appreciated.

XPT USD SELL (PLATINUM - US DOLLAR)Hi there. Price is forming a continuation pattern to the downside. Watch strong price action at the current price for sell.


Platinum Pre-Breakout SetupPlatinum broke above descending trend-line. Price is coiling. Possible breakout in the near future (Comex Session). Bias to the upside. Seems to have found support around $930 (tested three times) after price sold off $60 last week. Still up almost 10% on the month, outperforming both silver and gold.
Link showing commodity price comparison.
prntscr.com
I mentioned the initial breakout in a previous idea.

