King of the MetalsI have published previously on the silver/gold ratio. Silver is bound to outperform gold over time. The question is whether platinum will outperform silver and gold, or underperform both metals. Watch the dotted line for a breakout. If anyone has interesting research on platinum please post in comments below or pm me (fundamental or historical is preferred).
954 is technical resistance in platinum. Watch current level.
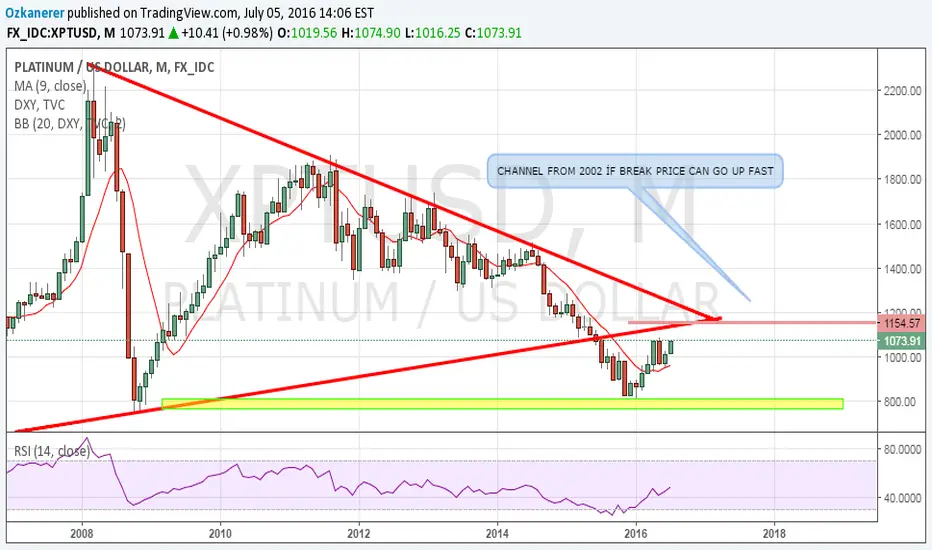
XPTUSD


Platinum. Retestthere is a probability of a decline after the retest of the level of 900.
but it is necessary to take into account that the seasonal trend in January is up (80-90% probability of growth)

PLATINUM/XPTUSD - D - LONG - TDII've always liked minerals and raw materials. Maybe I will focus more on commodities in the future.
I believe this is a good setup for PLatinum. We have a SL below latest low, that is not too far. We had a breakout on 4H, that should slow down a bit but not so much and then we can go to the sky.
GL HF

Trading opportunity for XPTUSD (2017-07-21)Updates for XPTUSD from last time.
Buy or add more longs if it breaks out of the triangle.
Good luck for everyone!

Platinum about to lift off? These two markets look interesting together because of the similar price action. Notice how rice was in a descending triangle followed by a breakout. These are typically bearish patterns, but not always, clearly. I believe platinum is in the same consolidation phase before it breaks out. Notice it took rice approximately two years to break out from its established support. Platinum seems like it's on the verge of doing the same. I've seen some traders present shorting opportunities in platinum. I think that's a big mistake.
Other than that, what does platinum have to do with rice? I'd say nothing. There is no inverse or positive correlation whatsoever. Perhaps there is something more between the two, but that is not the point of the analysis.

Platinum TradeOutLookwe will be long Platinum in up coming days . 900 is psychological Support Zone . and market gave us nice Response from this Level

Platinum setting up for new move up on weeklyWeekly Platinum is consolidating setting up for a breakout to the upside. Looking at current support at 886.8xx. If support holds at this area, price should continue up based on rhythm of TRIX and TSI.
Monthly TSI and TRIX are turning up. A breakout of price from current weekly consolidation looks to be to upside.
Daily chart with weekly consolidation overlay and last daily consolidation channel based on ADX


#TrendFlex Platinum Alert [Free]Bull Signal on Platinum - XPTUSD
MacroView Research forecasts platinum prices to extend gains near-term vis-a-vis weaker U.S. dollar; a view we've had in mid-December.
Alert: $990
Thresholds: 959.47
Opportunity: 1053.29
Trade Mgmt: TP on 50% of position at $1,015; move threshold to breakeven
This is a free version of MacroView Research's TrendFlex alerts, a proprietary alert system for FICC and select ETFs. We will be opening up registration for new subscribers March 1. If interested contact us anytime.
We believe performance matters. If TrendFlex is red for two back-to-back quarters, we'll refund 50% of fees - an offer not found anywhere else.
Follow @Lemieux_26, @EconomicHedge and @Macro_View on TWTR

Trading opportunity for XPTUSD (2016-11-29)There is a potential trading opportunity for XPTUSD if it breaks out of the falling wedge.
Good luck for everyone!

XPTUSD in a small time frame analysis (2017-01-03)It is an idea following up the previous idea in a weekly time frame:
XPTUSD will provide buy opportunities once it breaks out of the falling wedge.
Good luck for everyone!

New Bull Starting in Platinum?A few interesting points about XPTUSD and why it might be time to look at long positions:
1. 7-Year cycle in XPTUSD is bottoming out right now.
2. We are seeing a backtest of the initial breakout similar to what happened in 2000-2001
3. XPTUSD production is going to see major cutbacks moving forward from South Africa
4. Above ground stocks are winding down which has put extreme pressure on prices for the last 4 years
5. Should the DYX fail to breakout decisively over 102 before the end of 2016, then the ZARUSD could strengthen.


Short platinum As the idea states. Short platinum till it reaches 1047 USD. It might do the pattern described with the arrows.
www.tradingview.com

Potential Long-Term CALL on PLATINUMWatching for a strong move to the upside on the 5th wave of this impulse wave. Will wait for MACD to cross to the upside and for price to close above 50 MA before making call. Extra confirmation would be price closing above 100% Fib level.

Sell Trade Closed with +1296 pips of Realized Profit Hi,
my XPTUSD has reached the Target earning:
+1296 pips of Realized Profit.
Open: 1179.5
Close: 1052.6
Study with me on profiting.me
Thank you
Girolamo Aloe

And now palladiumAfter travelling on the overbought region for some time, it seems XPDUSD is now ready to retrace. We just touched the 0,618 angle of the fib speed resistance and already heading south. First target on 0,5 angle around 620's coinciding with last peak, and secondary on the 0,382 on the 600's. Wait for your signal and enjoy the short.
All precious metals are on this same trend. Check my idea on XPTUSD and watch how XAUUSD will follow this week.

PLATINIUM ALWAYS REMEMBER THIS CHART SET UP FOR BIG PROFITXPTUSD HAVE BIG POTANTIAL FOR LONG JUST WE NEED TO FALLOW CHART OR SET UP BUY STOP FOR FUTURE...

it is converging to Supply - #ProfitingMeHi,
Platinum PTUSD is very interesting in this moment. It is converging to a strong supply, giving a possibility to take a good sell trade. Of course accepting the risk.
I am a Trader of profiting.me
Thank you
Girolamo Aloe

Platinum shortlooking for confirmation on a 3rd higher low of 3 in the XPTUSD bull run. Stop out level is higher than the first highest high as well as near R1 stop for monthly level. 1000 area has proven to be strong resistance. I would suggest a averaging in price of 995, ranging maybe from 990 to 1000 area for asks. I think the white triangle should play out to allow the 50 and 200 ema to get very close or maybe cross for a fakeout before at least more ranging if not a larger drop down.
