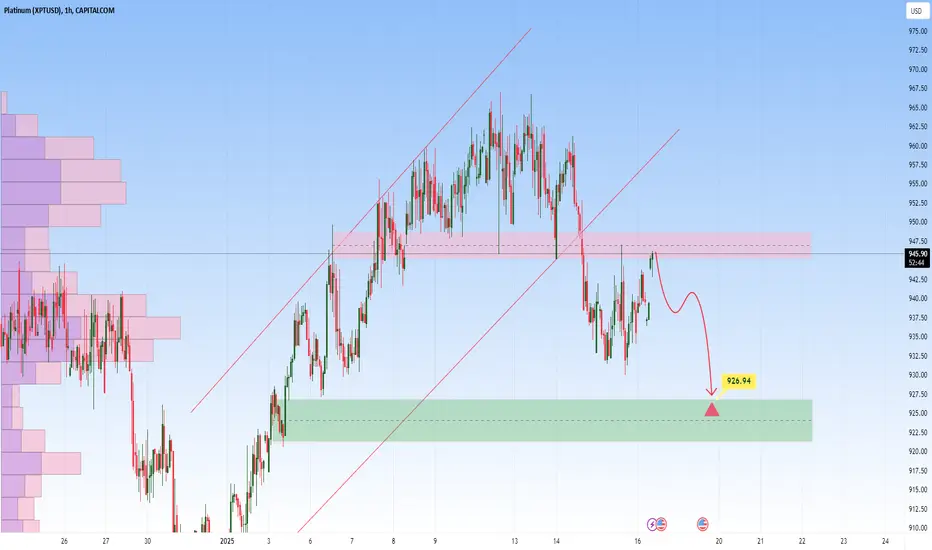
Platinum – Potential Short Setup with RetestPlatinum is currently trading below a key resistance zone, following a breakdown from the ascending channel. The recent bearish momentum indicates the potential for a continuation lower if the price fails to reclaim the resistance zone.
If the price retests this zone and shows rejection signals—such as bearish wicks, engulfing candles, or decreased buying pressure—it would strengthen the case for a short trade. In this scenario, the next target for sellers would be the $926.94 support zone, where buying interest may re-emerge.
This setup aligns with the broader bearish structure following the channel breakdown. Traders should monitor price action closely at the resistance level for confirmation of rejection before entering short positions.
XPTUSD
PLATINUM Weekly Forecast: Bearish! Look for SHORTS!Keep an eye on this one, as it makes its way down to 911.7.
I'm looking for the highlighted lows to be swept this week.
Enjoy!
May profits be upon you.
Leave any questions or comments in the comment section.
I appreciate any feedback from my viewers!
Like and/or subscribe if you want more accurate analysis.
Thank you so much!
Disclaimer:
I do not provide personal investment advice and I am not a qualified licensed investment advisor.
All information found here, including any ideas, opinions, views, predictions, forecasts, commentaries, suggestions, expressed or implied herein, are for informational, entertainment or educational purposes only and should not be construed as personal investment advice. While the information provided is believed to be accurate, it may include errors or inaccuracies.
I will not and cannot be held liable for any actions you take as a result of anything you read here.
Conduct your own due diligence, or consult a licensed financial advisor or broker before making any and all investment decisions. Any investments, trades, speculations, or decisions made on the basis of any information found on this channel, expressed or implied herein, are committed at your own risk, financial or otherwise.

XPT/ USD "PLATINUM" Metals Market Heist PlanHola! Ola! My Dear Robbers / Money Makers & Losers, 🤑 💰
This is our master plan to Heist XPT/ USD "PLATINUM" Metals Market based on Thief Trading style Technical Analysis.. kindly please follow the plan I have mentioned in the chart focus on Long entry. Our target is Red Zone that is High risk Dangerous level, market is overbought / Consolidation / Trend Reversal / Trap at the level Bearish Robbers / Traders gain the strength. Be safe and be careful and Be rich.
Entry 📈 : Can be taken Anywhere, What I suggest you to Place Buy Limit Orders in 15mins Timeframe Recent / Nearest Low Point take entry should be in pullback.
Stop Loss 🛑 : Recent Swing Low using 2H timeframe
Attention for Scalpers : Focus to scalp only on Long side, If you've got a lot of money you can get out right away otherwise you can join with a swing trade robbers and continue the heist plan, Use Trailing SL to protect our money 💰.
Warning : Fundamental Analysis news 📰 🗞️ comes against our robbery plan. our plan will be ruined smash the Stop Loss 🚫🚏. Don't Enter the market at the news update.
Loot and escape on the target 🎯 Swing Traders Plz Book the partial sum of money and wait for next breakout of dynamic level / Order block, Once it is cleared we can continue our heist plan to next new target.
💖Support our Robbery plan we can easily make money & take money 💰💵 Follow, Like & Share with your friends and Lovers. Make our Robbery Team Very Strong Join Ur hands with US. Loot Everything in this market everyday make money easily with Thief Trading Style.
Stay tuned with me and see you again with another Heist Plan..... 🫂

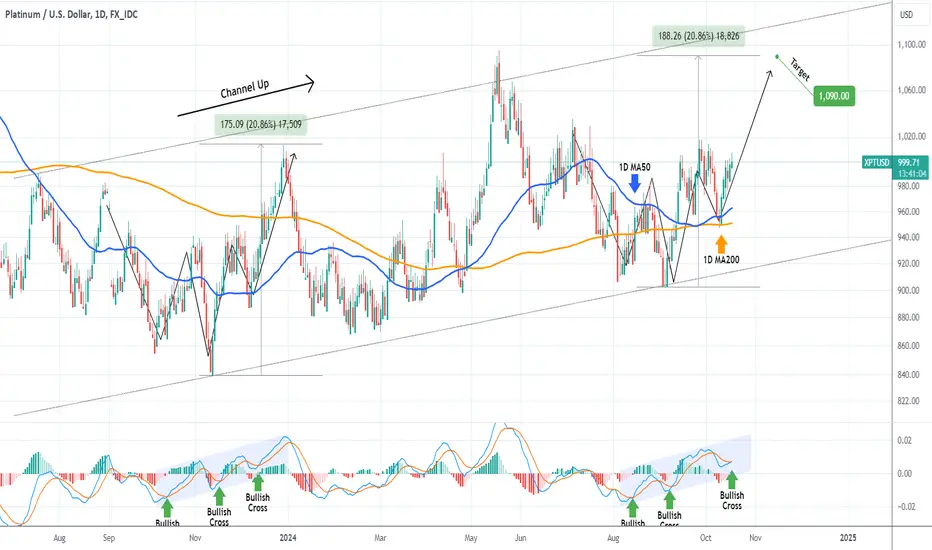
PLATINUM Huge buy opportunity at the bottom of the Channel Up.Platinum (XPTUSD) has been trading within a Channel Up for almost 1.5 year and currently it is testing the pattern's bottom. This process is similar to the Lower Lows bottom sequence of February 12 2024.
As you can see, even the 1D MACD fractals are the same and we are about to post the decisive Bullish Cross that signals the buy. As long as the price remains below the 1D MA50 (blue trend-line), it is a huge long-term buy opportunity.
The previous Bullish Leg hit the 1.236 Fibonacci extension within the Channel Up and peaked above it on the 1.5 Fib ext. As a result, our technical Target is on the modest 1.236 Fib at 1090.
-------------------------------------------------------------------------------
** Please LIKE 👍, FOLLOW ✅, SHARE 🙌 and COMMENT ✍ if you enjoy this idea! Also share your ideas and charts in the comments section below! This is best way to keep it relevant, support us, keep the content here free and allow the idea to reach as many people as possible. **
-------------------------------------------------------------------------------
💸💸💸💸💸💸
👇 👇 👇 👇 👇 👇

XPT/USD "Platinum" Market Money Heist Plan on Bullish SideHallo! My Dear Robbers / Money Makers & Losers, 🤑 💰
This is our master plan to Heist XPT/USD "Platinum" Market Market based on Thief Trading style Technical Analysis.. kindly please follow the plan I have mentioned in the chart focus on Long entry. Our target is Red Zone that is High risk Dangerous level, market is overbought / Consolidation / Trend Reversal / Trap at the level Bearish Robbers / Traders gain the strength. Be safe and be careful and Be rich.
Entry 📈 : Can be taken Anywhere, What I suggest you to Place Buy Limit Orders in 15mins Timeframe Recent / Nearest Low Point take entry in pullback.
Stop Loss 🛑 : Recent Swing Low using 30m timeframe
Attention for Scalpers : Focus to scalp only on Long side, If you've got a lot of money you can get out right away otherwise you can join with a swing trade robbers and continue the heist plan, Use Trailing SL to protect our money 💰.
Warning : Fundamental Analysis news 📰 🗞️ comes against our robbery plan. our plan will be ruined smash the Stop Loss 🚫🚏. Don't Enter the market at the news update.
Loot and escape on the target 🎯 Swing Traders Plz Book the partial sum of money and wait for next breakout of dynamic level / Order block, Once it is cleared we can continue our heist plan to next new target.
💖Support our Robbery plan we can easily make money & take money 💰💵 Follow, Like & Share with your friends and Lovers. Make our Robbery Team Very Strong Join Ur hands with US. Loot Everything in this market everyday make money easily with Thief Trading Style.
Stay tuned with me and see you again with another Heist Plan..... 🫂

PLATINUM: Best sell signal of the past 30 days.Platinum is heavily bullish on its 1D technical outlook (RSI = 65.879, MACD = 18.220, ADX = 36.308) as it trades on the bullish wave of the 2 month Channel Up. With the support of the 4H MA50, the price is very close to the top of the pattern. The bullish wave before that, topped upon a +12.17% rise and then pulled back almost to the 0.5 Fibonacci level and the 4H MA200. The current level is already great for a sell entry (if you want you can wait until the RSI gets overbought) and out target (TP = 1,020) is above the 0.5 Fib as the 4H MA200 this time is rising more aggressively than on the previous bullish wave.
## If you like our free content follow our profile to get more daily ideas. ##
## Comments and likes are greatly appreciated. ##

PLATINUM | XPTUSD Weekly Outlook Oct. 21st: BULLISH Bias!This weekly forecast is for Oct 21 - 25th.
Platinum is heading towards the Swing High with good momentum.
Target should be achieved this week.
Enjoy!
May profits be upon you.
Leave any questions or comments in the comment section.
I appreciate any feedback from my viewers, and I respond to every comment.
Like and/or subscribe if you like the video and want to receive updates directly.
Thank you so much!
Disclaimer:
I do not provide personal investment advice and I am not a qualified licensed investment advisor.
All information found here, including any ideas, opinions, views, predictions, forecasts, commentaries, suggestions, expressed or implied herein, are for informational, entertainment or educational purposes only and should not be construed as personal investment advice. While the information provided is believed to be accurate, it may include errors or inaccuracies.
I will not and cannot be held liable for any actions you take as a result of anything you read here.
Conduct your own due diligence, or consult a licensed financial advisor or broker before making any and all investment decisions. Any investments, trades, speculations, or decisions made on the basis of any information found on this channel, expressed or implied herein, are committed at your own risk, financial or otherwise.

Platinum Insider Stays in the Game, Anticipating Higher PricesA platinum Insider hasn't changed portfolio yet, so there's still potential for more growth.
Let me remind you, on September 4th, an insider came into the Platinum market and went long, which caused the price of Platinum (and other precious metals) to go up.
Now, prices are getting close to his target levels. This is important because it shows the market's future direction. The Insider know when to get in and when to get out. And we can watch them to see what he is doing.
If you don't have the time or inclination to read stock reports, just follow us. We cover all the important stuff and provide valuable insights every day.

XPT Surges as EMAs Align with Bullish Chart PatternH ello!
XPT broke out from a falling wedge (See green trendlines!) formation with strong bull power, as the MACD shows. It wasn't against expectations since falling wedge chart patterns usually break upward. It's often a bullish formation. Thus, MACD and chart patterns align with a bullish outlook. Furthermore, the price is above EMAs (20/50/100/200). EMAs crossed upward on the 24th of September. Seemingly, nothing stands in the path of bulls until the green target circles. However, stay vigilant and don't go all in.
Regards,
Ely

PLATINUM Strong rebound on the 1D MA200.We got a perfect bottom buy entry on Platinum (XPTUSD) last time we analyzed it (August 30, see chart below), with the price already halfway to our 1090 Target:
As you can see, the price action is almost a perfect mirror image of September - December 2023. Now that the price has confirmed the new Bullish Leg with a strong rebound on the 1D MA50 - 1D MA200 zone (blue and orange trend-lines respectively), we can expect it to complete the pattern and complete a +20.86% rise, right where our 1090 Target is.
-------------------------------------------------------------------------------
** Please LIKE 👍, FOLLOW ✅, SHARE 🙌 and COMMENT ✍ if you enjoy this idea! Also share your ideas and charts in the comments section below! This is best way to keep it relevant, support us, keep the content here free and allow the idea to reach as many people as possible. **
-------------------------------------------------------------------------------
💸💸💸💸💸💸
👇 👇 👇 👇 👇 👇
Time to BUY PLATINUM (XPTUSD)?....YES!Sept 23 - 27th
Is it time to buy Platinum? YESSIR!
Weekly TF clearly shows the formation of a weekly bullish Fair Value Gap (+FVG).
Daily TF shows price is sitting in a daily +FVG, over lapping the W +FVG.
4H TF shows price is sitting in a 4H +FVG, which is nested in the D +FVG.
Not to mention, price has broken structure to the upside, and has pulled back to all of the above.
Did I mention the trend line that is intersecting the 4H and Daily +FVGs for confluence of support?
Oh yeah... the 4H TF shows the retracement of the most recent trading range has pulled back to the fibonacci Golden Ratio of .618.
So yeah, I'm thinking the market is BULLISH, and poised to push higher from the +FVGs.
May profits be upon you.
Enjoy!
May profits be upon you.
Leave any questions or comments in the comment section.
I appreciate any feedback from my viewers, and I respond to every comment.
Like and/or subscribe if you like the video and want to receive updates directly.
Thank you so much!
Disclaimer:
I do not provide personal investment advice and I am not a qualified licensed investment advisor.
All information found here, including any ideas, opinions, views, predictions, forecasts, commentaries, suggestions, expressed or implied herein, are for informational, entertainment or educational purposes only and should not be construed as personal investment advice. While the information provided is believed to be accurate, it may include errors or inaccuracies.
I will not and cannot be held liable for any actions you take as a result of anything you read here.
Conduct your own due diligence, or consult a licensed financial advisor or broker before making any and all investment decisions. Any investments, trades, speculations, or decisions made on the basis of any information found on this channel, expressed or implied herein, are committed at your own risk, financial or otherwise.

ANTICIPATING TRADEAnalyzed XPTUSD by applying following trading strategy steps:-
1. Bearish trend
2. Bearish divergence
3. Double top bearish reversal pattern found in the end of bullish trend and before start of bearish trend
4. Anticipates a bearish trend, and initiated two trades with 1 % risk thru sell stop

Platinum is about to skyrocket and soar by 20%!Platinum's insider was discovered!
He was last seen at it on March 7th of this year, and platinum prices have jumped by 20% since then!
Now, his target price is between $1100 and $1200 , representing a greater than 20% increase. There's some significant momentum going on there.
We are keeping a close eye on it.

PLATINUM Strong buy opportunity at the bottom of the Channel Up.Platinum (XPTUSD) has been trading within a 1-year Channel Up pattern and on August 05 it priced the latest Higher Low on the pattern's bottom. Having already recovered the 1D MA50 (blue trend-line), we have a confirmed signal of the start of the new Bullish Leg.
The last two major rallies rose by at least +20.86% and as such, our long-term Target is 1090.
-------------------------------------------------------------------------------
** Please LIKE 👍, FOLLOW ✅, SHARE 🙌 and COMMENT ✍ if you enjoy this idea! Also share your ideas and charts in the comments section below! This is best way to keep it relevant, support us, keep the content here free and allow the idea to reach as many people as possible. **
-------------------------------------------------------------------------------
💸💸💸💸💸💸
👇 👇 👇 👇 👇 👇

XPTUSD Strong buy on this 1W MA50 rebound.Our April 24 analysis (see chart below) on Platinum (XPTUSD) saw us struck Gold as we caught the exact Bullish Megaphone bottom which hit our 1060 Target:
The situation isn't all that different now as Platinum got close to those April levels, with last week's Low marginally breaking below the 1W MA50 (blue trend-line), managing however to close the candle above it.
This has been followed with a strong green 1W candle this week, which we expect to be the technical rebound towards at least Resistance 1 if not a new Higher High. Our Target is slightly lower than this at 1095.00.
-------------------------------------------------------------------------------
** Please LIKE 👍, FOLLOW ✅, SHARE 🙌 and COMMENT ✍ if you enjoy this idea! Also share your ideas and charts in the comments section below! This is best way to keep it relevant, support us, keep the content here free and allow the idea to reach as many people as possible. **
-------------------------------------------------------------------------------
💸💸💸💸💸💸
👇 👇 👇 👇 👇 👇

PLATINUM Massive profit last time. What's the next trade?Straight and plain success of our previous Platinum (XPTUSD) signal (April 24, see chart below), where we caught the exact Bullish Megaphone bottom and hit directly our 1060 Target:
The price could now enter a consolidation phase, the last accumulation, similar to November 15 - December 15 2022, when after it touched the 1D MA50 (blue trend-line), it rallied to the bottom of the Resistance Zone.
As a result, we are turning into buyers again, targeting 1100 (just below the Resistance Zone).
-------------------------------------------------------------------------------
** Please LIKE 👍, FOLLOW ✅, SHARE 🙌 and COMMENT ✍ if you enjoy this idea! Also share your ideas and charts in the comments section below! This is best way to keep it relevant, support us, keep the content here free and allow the idea to reach as many people as possible. **
-------------------------------------------------------------------------------
💸💸💸💸💸💸
👇 👇 👇 👇 👇 👇

Extension of bull market trend in metalsDear analysts and traders,
I trust this message finds you in good health and high spirits as you prepare to approach the upcoming week with renewed vigor. I extend my best wishes for continued success in all your business pursuits. It is essential to emphasize that sustained success in business hinges significantly on the consistent establishment and adherence to your principles.
As an advocate of the Elliott Wave principle, I regard this methodology as a valuable instrument for market analysis. Over the past three years, I have honed my approach by amalgamating this principle with a meticulous evaluation of diverse market scenarios. I strive to mitigate market uncertainties by upholding a broad spectrum of market perspectives, enabling me to discern market structures with utmost precision.
I am pleased to share my analysis with you, with the disclaimer that I do not offer buy or sell recommendations. My perspective on analytical ideas remains entirely impartial, and if my analysis aligns with your standards, it can serve as a compass for informed decision-making.
I have enclosed my prior analysis of the same market for your perusal and comparison. All aspects of my analysis are clearly delineated for clarity. Nevertheless, familiarity with the Elliott Wave principle theory facilitates comprehension of the analytical concept. I apologize for the repetitive nature of the text, as my week is occupied with formulating analytical and educational ideas, as well as engaging in trading activities and managing my social networks. Due to time constraints, I am unable to provide textual explanations for every idea, hence the inclusion of a separate text alongside the labeling. Should the text be unclear, I am available to elucidate the key points.
My rigorous study of the Elliott Wave Principle spanned nearly three years, during which my grasp and utilization of this invaluable tool evolved. My progress thus far stands as a tribute to the legacy of Ralph Nelson Elliott, whose brilliance underpins my accomplishments. May he rest in peace.
I am grateful for your unwavering support and benevolence, and I eagerly anticipate your feedback and constructive criticism.
May my analysis serve as a valuable asset in your business endeavors, and I remain yours sincerely,
Mr. Nobody
Previous analytical ideas

PLATINUM XPTUSD Bearish Robbery Plan to make money 🤑💰Hola Platinum Robbers,
This is our master plan to Heist Bearish side of PLATINUM XPTUSD market. kindly please follow the plan i have mentioned in the chart focus on Short entry, New entry traders pls enter only in pullback of smaller timeframe then enter to rob the money. Our target is Green Zone that is High risk Dangerous area Consolidation will happen. Be safe and be careful and Be rich.
Loot and escape near the target 🎯
support our robbery plan we can make money take money 💰💵 Join your hands with US. Loot Everything in this market everyday.

XPTUSD has cross-over and shows short opportunity XPTUSD has broken its bottom trendline with a 3 EMA crossing over the 10 EMA to the downside. At the same time we're getting the EMAs crossing over the Stochastic is heading down and crossing over the 50% mark giving three confluences to look for shorts
Ill be targeting a 1% move down underneath a support i have drawn out on the 4H chart

More downside for XPTUSD (Platinum)XTPUSD has been rallying ever since it broke out of its two week sell off a couple days ago but there are now signs showing that the upward momentum could be coming to a end.
Technical : The 3 EMA is crossing over the 10 EMA to the downside while at the same time the Stochastic is crossing the 50% mark to the downside as well. These Bearish confluences are happening while we are nearing the bottom Trendline, making a breakdown higher probability. Target a 1-1.5% move down from your entry/break

4H XPTUSD (Platinum) Long waiting on retestXPTUSD has broken the Bullish (TOP) Trendline after multiple (5) touches, we dont have a clear safety line to give us a stop loss so i wont enter of the initial break. Im going to instead wait for a retest of the Bullish Trendline we'd just broken, Waiting allows me get a better idea of the breakout to see if its just trying to fake us out. If this bullish situation plays out ill be targeting Resistance above at 943.95.

XPTUSD Strong Higher Low buy opportunity. 1D Golden Cross formedPlatinum (XPTUSD) gave us an excellent bottom buy signal last time (March 13, see chart below), as the metal entered a Channel Up pattern following the bottom just below 880.00:
Currently we are on the 2nd Bearish Leg of the Bullish Megaphone pattern that emerged and will complete a Golden Cross on the 1D time-frame today. As per the December 02 2023 Golden Cross, which was formed after a similar rebound, but on a more aggressive Channel Up instead of a Megaphone, we should be expecting another Higher High near the 1.382 Fibonacci extension. Our Target is 1060.
-------------------------------------------------------------------------------
** Please LIKE 👍, FOLLOW ✅, SHARE 🙌 and COMMENT ✍ if you enjoy this idea! Also share your ideas and charts in the comments section below! This is best way to keep it relevant, support us, keep the content here free and allow the idea to reach as many people as possible. **
-------------------------------------------------------------------------------
💸💸💸💸💸💸
👇 👇 👇 👇 👇 👇

Platinum- Can it Bridge the Gap with Gold?For the past 10 months, OANDA:XPTUSD has been trading within a range between approximately 850 to 1000.
However, upon closer examination of this range, it appears to resemble a rounded bottom formation and also after dipping below 900 at the beginning of March, Platinum has been establishing higher lows, suggesting that the price is ready for a strong rise.
Conservative traders may want to consider waiting for a break above 1000.
In such an instance, the price could potentially accelerate and reach 1300 in the medium term.
On the other hand, more aggressive traders could opt to buy dips near 950.
With a stop loss set below 850 and a target of 1300, this strategy could potentially yield a risk-to-reward ratio of more than 1:3.
