XRPUSDT → Hunting for liquidity ahead of a possible declineBINANCE:XRPUSDT.P is forming a downward market structure after a false breakout of global resistance. Bitcoin is in a correction phase and, after a slight rebound, may continue its movement...
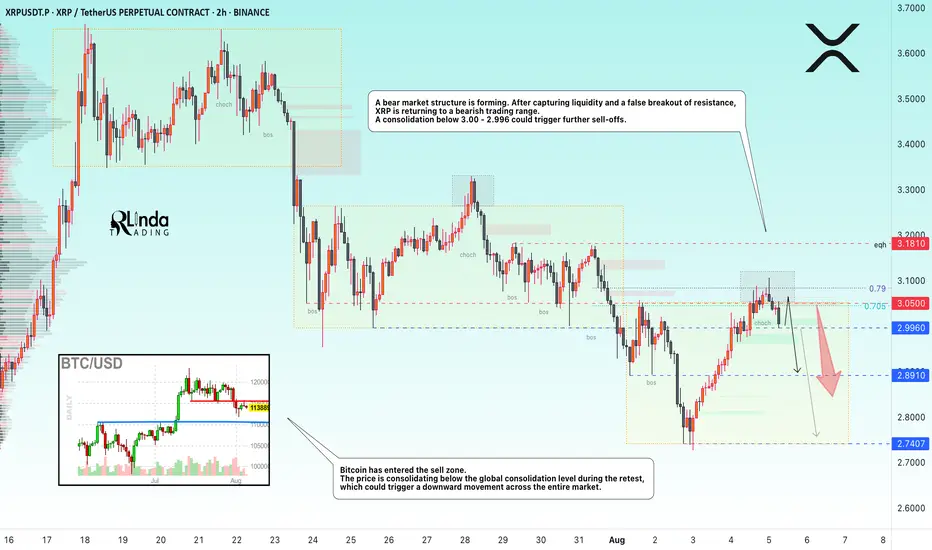
Bitcoin has entered the sell zone. The price is consolidating below the global consolidation boundary of 115,500 during the retest, and if Bitcoin continues to decline, this could trigger a downward movement across the entire cryptocurrency market.
XRP is forming a bearish market structure. After capturing liquidity and a false breakout of resistance, the price is returning to a bearish trading range. There is no potential for continued growth at this time. A consolidation of the price below 3.00 - 2.996 could trigger further sell-offs.
Resistance levels: 2.996, 3.050, 3.181
Support levels: 2.996, 2.891, 2.74
The local bearish structure will be broken if the price starts to rise, breaks 3.050, and consolidates above it. In this case, XRP may test 3.181 before falling further.
At the moment, after a false breakout of resistance, the price is consolidating in the selling zone, and the downward movement may continue. I consider 2.74 - 2.655 to be the zone of interest in the medium term.
Best regards, R. Linda!
Xrp
XRP 8H – Rejection Off Resistance, Can Golden FIB Save It?XRP just printed a clean rejection off the $3.15 resistance zone, and price is now pulling back into a high-probability demand zone — the classic Golden Pocket (0.5–0.618) retracement from the July impulse leg.
With momentum cooling off, bulls need to step in soon or risk a drop into deeper Fib levels.
🔹 Key Levels & Structure
Price failed to reclaim the prior breakout zone (blue box) and is now in a short-term correction phase.
The Golden Pocket between $2.79–$2.59 lines up with price structure from late June.
Below that, 0.786 at $2.28 marks the final zone before invalidation of the full move.
🔹 Momentum Check
Stoch RSI remains in overbought territory — a deeper reset could align with a Fib bounce and create the next opportunity.
Price may need to sweep lows before continuation.
🔹 Scenario to Watch
A bullish bounce from the Golden Pocket → reclaim of $3.15 = strong upside continuation potential.
Otherwise, XRP may revisit the 0.786 level before stabilizing.
Do you trust the Fib support — or are you waiting for confirmation above $3.15?
Let’s discuss 👇

XRP 1D – Major Support Bounce Inside Channel, Will Range Hold?XRP just defended a critical long-term support zone near $2.70 — aligning perfectly with the mid-channel range and previous breakout level. After rejecting from multi-month resistance around $3.15, price has returned to structure for a potential higher low.
🔹 Structure & Range
The macro channel (white lines) has guided price action for over 9 months.
XRP recently tagged the upper boundary, rejected, and pulled back into support around $2.70.
This zone was tested multiple times historically — it now serves as a pivot for continuation vs. reversal.
🔹 Momentum Signal
The Stoch RSI is printing a bullish cross from oversold — a classic confluence for reversal setups.
If the support zone holds, we could see price attempt another run at the $3.15–$3.30 resistance and eventually challenge the upper trendline.
🔹 Macro Outlook
Holding this structure = bullish midterm continuation.
Losing it opens the door for a drop back toward $2.00–$2.25, where the lower channel support sits.
Will XRP defend this channel — or is a breakdown back to $2.00 inevitable?
Drop your analysis in the comments 👇

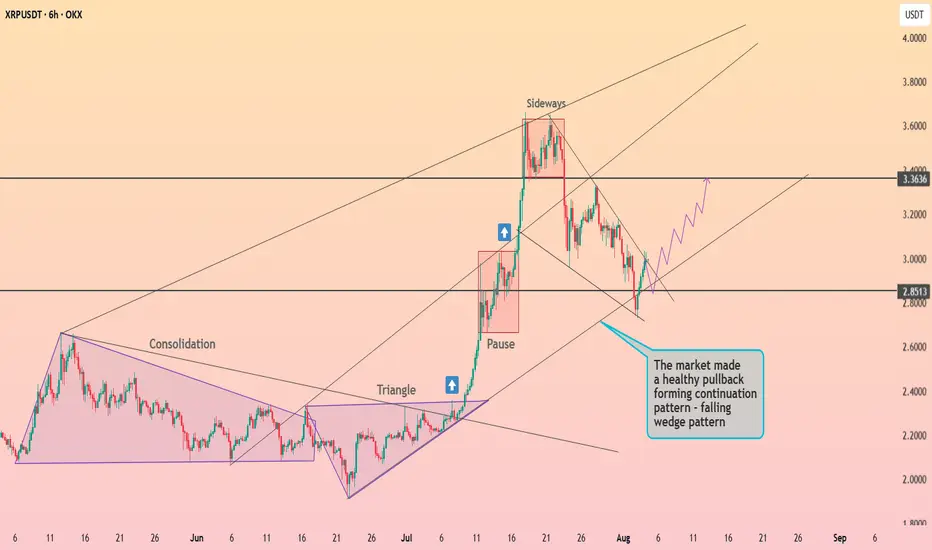
XRP is preparing to exit the wedge ┆ HolderStatOKX:XRPUSDT is forming a falling wedge after a sharp breakout and pullback. Price is stabilizing near $2.85, a key former resistance level. If bulls reclaim momentum here, a move toward $3.36 becomes a high-probability scenario.
XRP Update · Support Confirmed · Not $4, Now $6 & HigherIt is true our next target is $4.5 but this isn't the final target anymore. Based on what I am seeing coming from the chart and what is happening marketwide, we have to continue to expand while aiming higher, each time, adapting to market conditions.
The next target for our XRPUSDT track and trade is now at $6.27, let's read the chart.
First, do what you need to secure profits, your trade, your position; and do your own thing. I you alert of the opportunity, great entry price and timing but it is up to you to plan, take profits and adapt your trading to your own individual conditions. All is good and we are doing great. Notice how the market continues to perform awesome just as expected and notice how we indeed are getting more; and more. This is not the start, XRP is already pretty advanced in its bullish cycle but this isn't the end either. There is plenty of room left available for much more growth.
Yesterday support was found exactly above 0.618 at $2.71. These levels were there before the retrace so we know based on what Fib. proportions XRP is moving. We know exactly where to find resistance and support.
As soon as support was activated the same day we got a full green candle and the break of another resistance. Today full green again. Normally, people would still say that it is early and wait for confirmation; not me, I told you the retrace would be fast and end within days. Seeing the action as it is today, we can confirm the resumption of the bullish move. This means higher prices and higher prices in the chart can translate into weeks of bullish action. Week after week after week. Some retraces and corrections will invariably show up, always small followed by additional growth.
This is the 2025 bull market. Still early, the best is yet to come.
Bullish momentum will grow and a massive force will take over the market. This force is likely to be with us for months and at this point everything will grow. This same energy will remain with us for years and we have to make the most of this cycle.
Be ready, be prepared, maximize profits and continue to buy, to hold and to trade long-term. The more we practice the more we learn.
The more we learn more money we can make. With more money, we can meditate more and with more meditation we can improve our results. The conclusion is abundance and with financial abundance we can materialize the type of life we want. It can be anything, but you will be rewarded based on your insistence, persistence and hard work.
Patience is key.
Thanks a lot for your continued support.
Namaste.

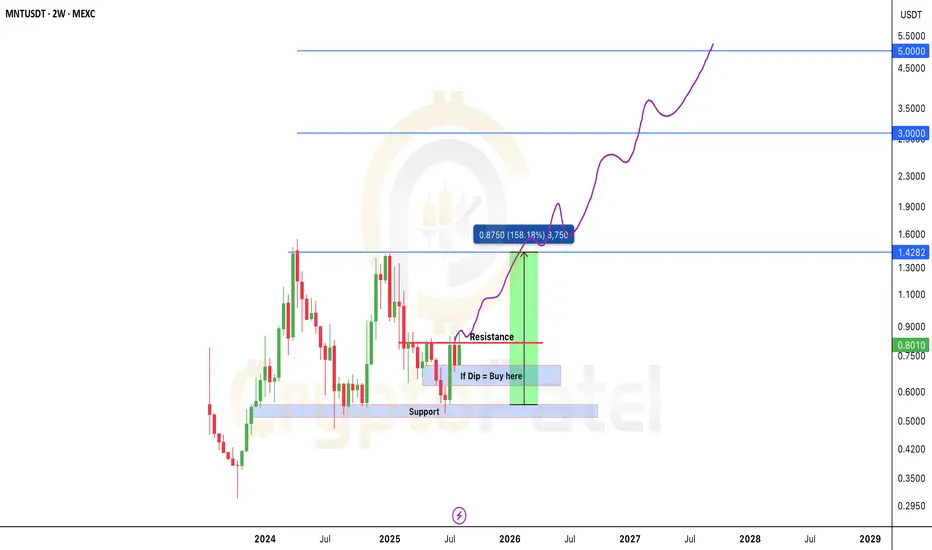
Will MNT/USDT 5x to 10x Potential Post BreakoutTSX:MNT Forming Bullish Structure – 5x to 10x Potential Post Breakout
#MNT is currently trading very close to a major resistance level at $0.82.
We’re waiting for a clean breakout above this zone. Once confirmed, price can potentially deliver a 5x–10x move in the coming days.
If price retraces, the best long-term entry zone would be around $0.70–$0.60 — right inside the accumulation box.
This bull run has strong structural support around $0.55–$0.50. As long as we stay above this zone, we remain highly confident in the upside move toward $5.
Key levels to watch:
Accumulation Zone: $0.60 – $0.70
Resistance: $0.82
Support: $0.50 – $0.55
Bull Run Targets: $1.42 / $3 / $5
NFA & DYOR
The Platinum BulletOver the years, I have posted a lot of educational content here on TradingView. Everything from Elliot waves to Wyckoff, psychology to Gann.
I have been lucky as a trader, 25 years doing this you pick up a thing or two. But above everything else, what you realise is that trading is a mindset game and not a technical one.
Many new traders try their luck. They are either experts in another field or simply successful in something else, or they come to the trading arena seeking wealth.
Both tend to get humbled quickly.
It is common for many new traders to put so much emphasis on the strategy, they overlook the psychology. You see, a strategy might work for someone, but you can't get it to work for you. This could simply be the time on the charts you lack, the timeframe or the instrument you are trading. The account balance or the fact you are not used to seeing 3-4 losses in a row.
When it comes to trading, less really is more!
Here's a simple one for you.
Take the mechanical range post I posted.
Now look at this;
On the larger timeframes we can see clearly the ranges and the supply/demand.
Then dropping down to the daily.
This is where, the technical aspect becomes less important and the psychology behind the move shows it's hand.
I have added volume and the AD line just to show how obvious this can be.
What do you see? Well as the price goes up, the volume goes down, we know we took liquidity to the upside.
So, if nothing else you would anticipate a pullback phase.
Then you get the clarity. Price drops and then pushes back, yet fails to make a new high. Almost like the volume told you it was about to happen.
Where did it pull back to?
Adding a simple volume profile too, from the swing high to the swing low. You can see the majority of the sell off (PoC) happened at a specific price point. Price pulled back to exactly that region before dropping.
The drop caused a local change in character and immediately took out the swing low - the last swing low of the leg up. (the real change in the trend).
There is obviously more to cover than this, but that is for another post.
Once you learn the way markets capitalise on the fear, the greed, the herd mindset, sentiment of the retail crowd. You can use the sentiment analysis in your favour.
You don't need 6 screens, fancy indicators, there is no silver bullet or 100% win rate strategies. And no a bot won't make you a Billionaire overnight.
If it was that easy, we would have no doctors, lawyers or firefighters; they would all be professional Bot traders.
Simplify your approach, put emphasis on the proper mindset, psychology and risk management and you will do alright!
Stay safe in the markets!
Some other recent posts;
Disclaimer
This idea does not constitute as financial advice. It is for educational purposes only, our principal trader has over 25 years' experience in stocks, ETF's, and Forex. Hence each trade setup might have different hold times, entry or exit conditions, and will vary from the post/idea shared here. You can use the information from this post to make your own trading plan for the instrument discussed. Trading carries a risk; a high percentage of retail traders lose money. Please keep this in mind when entering any trade. Stay safe.

All in XRPRegulatory Shift: Barriers for Ripple and XRP are easing, clearing the path for dominance in crypto/blockchain markets.
End of Retail Bubble: The retail-driven crypto era is fading, with institutional players paving the way for entry.
XRP ETF Progress: Eight XRP spot ETF applications from major funds await SEC approval, expected within months.
Ripple Lawsuit Nearing End : Resolution is imminent, setting a precedent for other crypto projects.
Blockchain as Infrastructure: The new U.S. Treasury Secretary and SEC Director recognize blockchain as critical national infrastructure, comparable to railroads and the internet in its transformative potential. This perspective aligns with the rhetoric of global financial authorities like the IMF, BIS, and WEF, as well as leading consulting firms, which have championed blockchain’s role in revolutionizing finance and cross-border transactions over the past few years.
Market Trends : Stablecoins, CBDCs, tokenization, and cross-border payments will drive growth, settling on public blockchains.
XRP’s Advantage : Stress-tested by global banks and governments for over a decade, XRP is uniquely equipped for large-scale enterprise adoption. Backed by Ripple, a leading fintech with connected leadership and top talent, XRP leverages unmatched expertise and a global network of bank and payment partners, driving innovation and solidifying its enterprise-grade infrastructure.
Market Performance: Post-election, XRP surged 500%, outperforming all coins, with stop-loss hunting below $3 likely over.
Conclusion and price prediction XRP remains largely unnoticed by mainstream media, its transformative potential yet to resonate with the broader public. Compared to Bitcoin, XRP is still in its infancy as a store of value and speculative asset for retail investors. Yet, as market dynamics shift and critical developments unfold, a potent blend of utility-driven demand and speculative momentum could propel XRP to $10 by the end of 2025. If Ripple’s vision of an Internet of Value takes root—enabling seamless, instant, and low-cost global transactions, capturing a substantial portion of SWIFT’s payment flows, and harnessing the power of tokenization—XRP could emerge as a cornerstone digital asset commodity, potentially soaring to triple-digit valuations by 2030 and fundamentally redefining its role in the global financial ecosystem.
Ripple (XRP/USDT) Technical Analysis – 1H Timeframe🔰 Current Market Context:
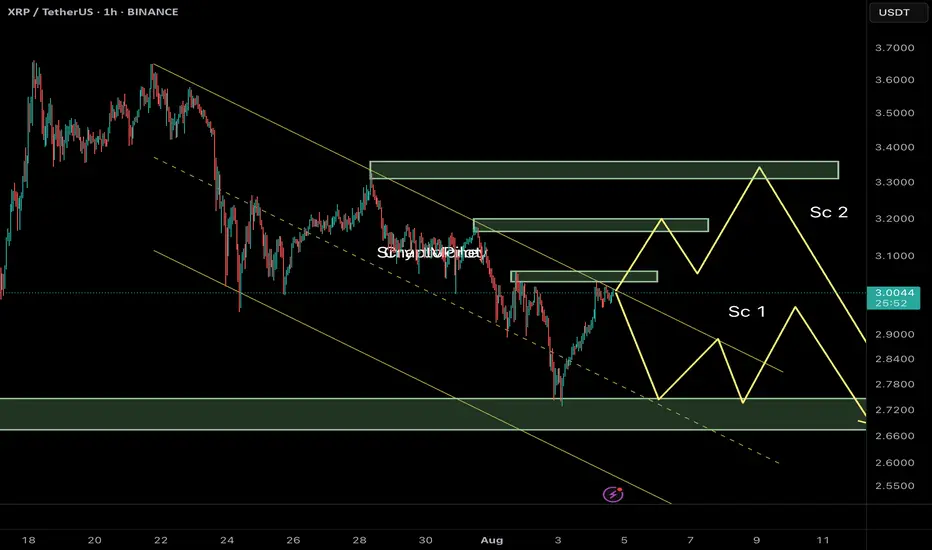
After breaking below the ascending channel near $3.50, XRP has entered a corrective phase within a descending channel. Price is now hovering around a mid-range resistance zone, and we can outline two key potential scenarios from here:
⸻
📌 Scenario 1 (Sc1) – Immediate Rejection and Bearish Continuation
In this case:
• Price gets rejected from the current resistance zone ($3.05–$3.10).
• A quick corrective pattern (likely a Zigzag or Flat) plays out.
• XRP moves down to test the next demand zone near $2.70–$2.65, breaking below recent swing lows.
✅ This scenario aligns with the current weak structure and visible sell-side pressure. Liquidity above recent highs has likely been swept, creating a setup for continuation downward.
⸻
📌 Scenario 2 (Sc2) – Extended Correction with a Final Bull Trap
In this case:
• Price pushes higher toward a deeper resistance zone near $3.30–$3.40.
• A liquidity grab above the prior highs triggers a sharper reversal afterward.
• The overall structure could form a Diametric or Complex Correction, suggesting a deeper and more time-consuming wave before resuming the bearish trend.
⛔ This scenario requires strength and acceptance above $3.15, and should be treated as an alternative unless proven by price action.
⸻
🎯 Summary & Trade Strategy:
Scenario 1 is currently more probable unless we see a strong break and close above $3.10. Expectation: XRP may head toward the $2.70–$2.65 demand zone if resistance holds.
⚠️ Avoid entering early. Wait for confirmation via internal BOS (Break of Structure), bearish engulfing near OB zones, or signs of rejection with volume at resistance.
XRP Short Hedge in Play Against ETH & BTC Divergence 🚨📉 XRP Short Hedge in Play Against ETH & BTC Divergence ⚖️💥
Right now, Bitcoin is sitting at a major lost level: 115,700 . Unless we reclaim that zone , the market structure remains bearish. If BTC does reclaim it—I’ll turn ultra bullish. But until then, I must actively look for some shorts.
And in a sea of liquidity, XRP might offer reliable setups for short-side trades.
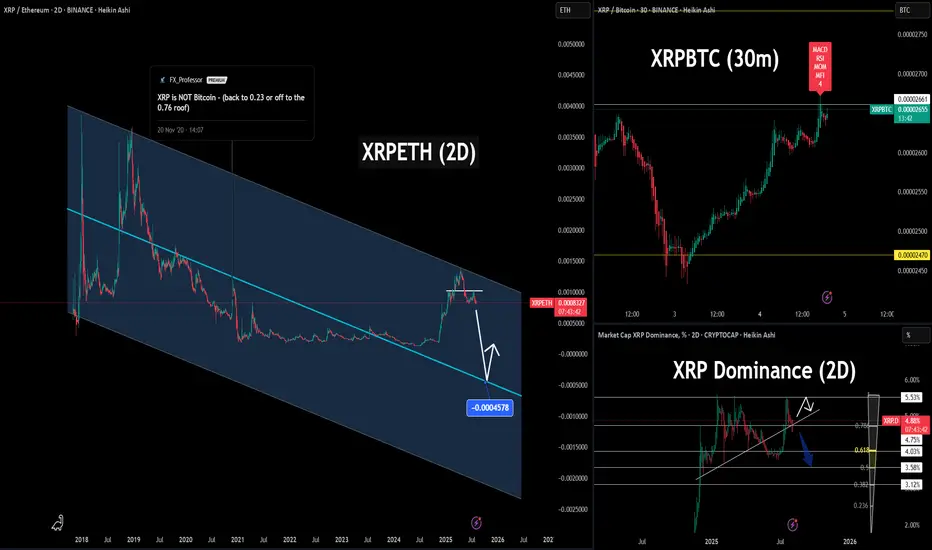
📊 1. XRP vs Ethereum (2D)
We're right at the top of a multi-year descending channel on BINANCE:XRPETH XRPETH. This is a textbook short entry zone , with a potential drop back toward the midline or lower boundary.
✅ Setup: Short XRP / Long ETH — clean hedge with relative strength in ETH.
⏱ 2. CAPITALCOM:XRPBTC XRPBTC (30m)
We now have 4 confirmed bearish divergences on the short-term chart:
🔻 MACD
🔻 RSI
🔻 Momentum
🔻 Money Flow Index (MFI)
This setup has a high probability of reversal, particularly at these horizontal resistance levels.
📉 3. CRYPTOCAP:XRP.D XRP Dominance (2D)
Rejection at 5.53%, again. Now with added Fibonacci confluence levels on the pullback:
0.618 Fib sits right at 4.03%
0.5 Fib near 4.75% (current battle zone)
Deeper liquidity zones at 3.58% and 3.12%
If dominance fails to hold the 4.75% neckline, we could see a full Fibonacci retrace back to the golden ratio— a strong potential drop.
📎 Throwback Chart: Nov 2020
📈 Here's a setup I posted years ago:
👉 XRP is NOT Bitcoin – back to 0.23 or off to the 0.76 roof
That idea nailed the explosive move from $0.23 to $0.76 , and then the collapse back to $0.17.
XRP has a history of sharp pops followed by deep drops — and this looks like another one might be brewing.
🔍 Macro Bearish Factors:
📦 XRP supply = 100 Billion (vs BTC’s 21M cap)
🧠 Ripple controls over 42.5% of total XRP (wallets + escrow)
📉 94% of XRPL txns hold no real value— network activity mostly spam
🕳️ “Dark pool” OTC volume suppresses price discovery
🧱 UNL validator model exposes centralization and network fragility
📊 XRP dominance structurally capped near 5.5%, now rejecting hard again
📌 In conclusion:
This is not about bias, it's about structure and data.
When the charts line up with fundamentals, and liquidity is flowing toward ETH and BTC, XRP becomes the natural hedge.
Short XRP. Long ETH. Watch BTC.
One Love,
The FX PROFESSOR 💙
Disclosure: I am happy to be part of the Trade Nation's Influencer program and receive a monthly fee for using their TradingView charts in my analysis. Awesome broker, where the trader really comes first! 🌟🤝📈
An Example of Trading a Coin (Token) You're Hesitant to Trade
Hello, fellow traders!
By "Following," you'll always get the latest information quickly. Have a great day today.
-------------------------------------
There are coins (tokens) that are showing positive trends, but are reluctant to trade.
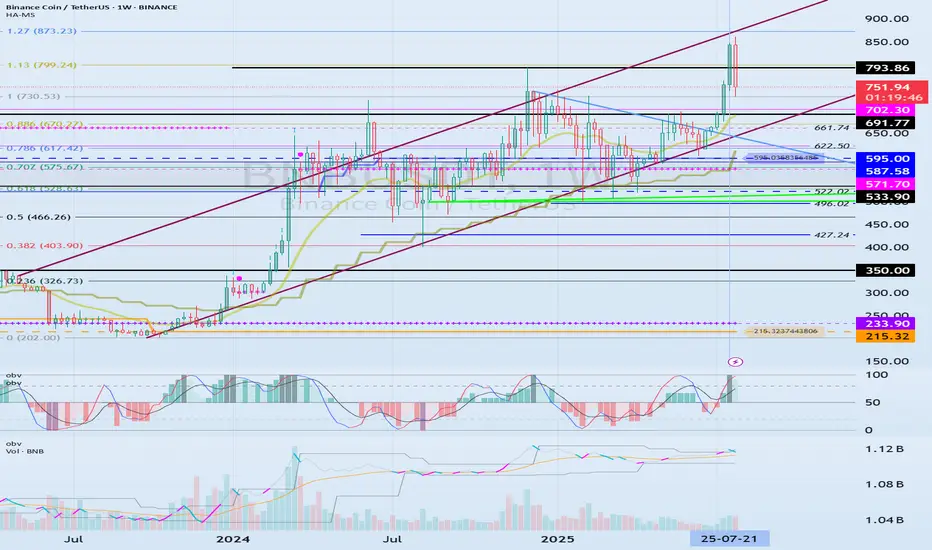
BNB and TRX are two such coins.
(BNBUSDT 1W chart)
(TRXUSDT 1W chart)
What these two coins have in common is that their representatives are Chinese.
These two coins are consistently making efforts to expand globally.
BNB is ranked first among exchange-traded coins, while TRX is steadily making efforts to expand into the US market to expand globally.
Despite this, some are reluctant to trade due to concerns about being an exchange-traded coin and being a Chinese coin.
To mitigate this risk, it's best to increase the number of coins (tokens) that ultimately generate profits.
In other words, by selling the amount of the original purchase price, you retain the number of coins (tokens) that represent profit.
This way, even if the price plummets, you'll always be in profit, allowing you to seize new opportunities.
For coins (tokens) that demonstrate long-term growth potential, increasing the number of coins (tokens) that represent profit is recommended. While these coins (tokens) appear to have potential for long-term growth, they currently carry some risk.
This also applies to coins that are considered worth holding for the long term, such as BTC and ETH.
Therefore, coins (tokens) that have a large user base and are considered to have future value, such as XRP, ADA, SOL, and DOGE, still carry some risk.
-
Thank you for reading to the end.
I wish you a successful trading experience.
--------------------------------------------------
Bitcoin Dominance & The Fall of AltcoinsBitcoin has sold off sharply in recent session.
Allowing alt coins to capture small percentages of bitcoins liquidity which resulted in epic bullish moves.
Now that Bitcoin is retesting a major moving average (50 MA) we might see BTC recapture some of that crypto dominance.
Other alt coins are well off of their 50 day moving average making them a riskier buy.
When BTC dominance starts to take leadership we often see alt coins and the total market cap sell off.
Bitcoin dominance is hitting a multi year trendline and looks poised to capture some of the alt liquidity.
We still think BTC can sell off and go lower, but on a relative basis it should hold up better than other alt coins & Ethereum.
There are some key nuances that are building and shaping up for a very similar topping formation that occurred in 2021.

XRP - IH&SLike I said in my last post, xrp was to hit 2.80. Nailed it. Right on the money!
Now, it seems like we're printing an IH&S. No other real patters are matching up l well. We finally have some liquidity in the market to chart some rough patterns.
I'm seeing a little push up off the bottom BB - to 3.12 ish? But rejection back down to the daily pivot for the right shoulder. And acuminate there prior to any news from the SEC. And then were primed and strapped to a rocket!
But honestly, who really knows what these MM have in store. So stay light on your feet in this area.
Roll them bones for it!

$XRP ENJOYERRRs see ya at $1.04-$1.20If we look at the chart of XRP, you can see that since the move in fall of 2024, we've had a massive lack of balance on the chart.
We ran up quickly without testing any levels as support.
That makes me think we're going to see the lack of balance get corrected and the same move is now going to happen in the opposite direction.
The $1.04-1.20 region looks like a good area of support to me.
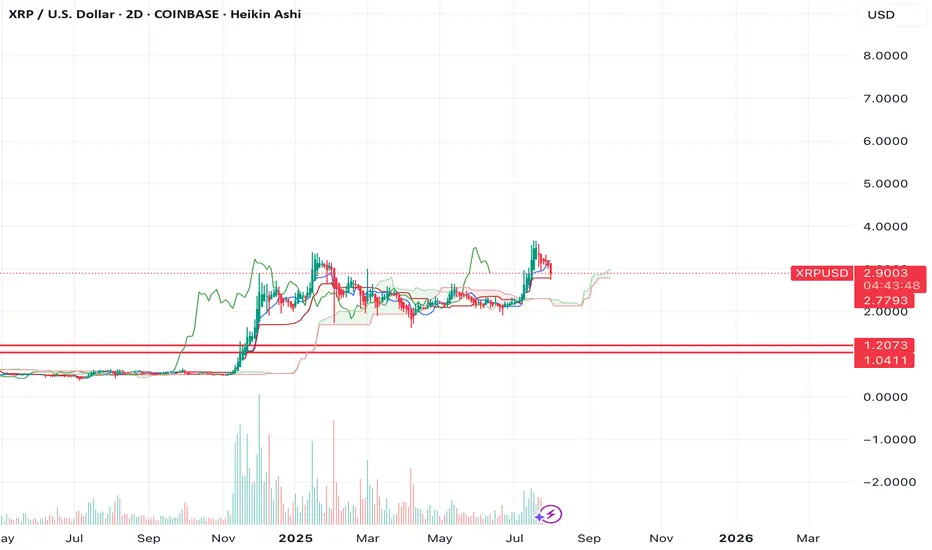
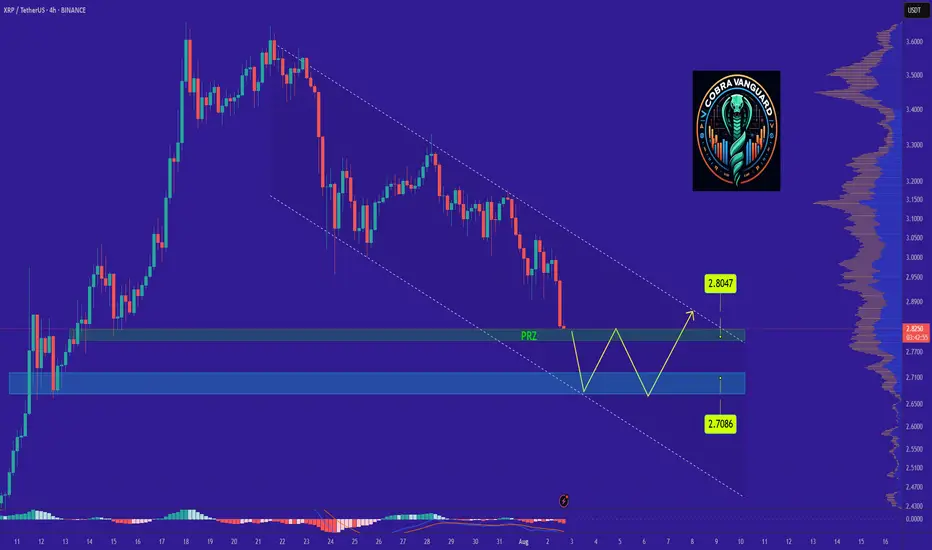
XRPs Situation (Daily) !!!If the price loses the PRZ range, it will drop to the bottom of the channel and then rise to the top of the ascending channel, which will take some time.
Best regards CobraVanguard.💚
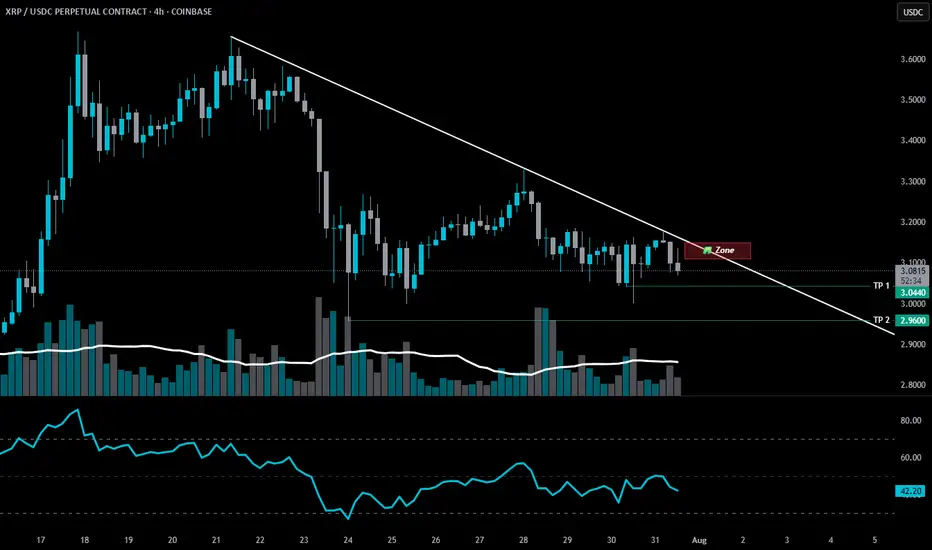
XRPUSDT 4H – Pullback Into Support, But Will This Bounce Stick?XRP has retraced nearly 25% off its local highs after a powerful +90% move in July. Price is now pulling back into a well-defined demand zone around 2.85–2.88, which previously triggered the breakout impulse.
📌 What’s notable:
Clean retest of demand + price hovering above the final bullish structure
EMAs are overhead, but not yet fully bearish — a reclaim could flip short-term bias
The lower demand zone (~2.15–2.25) still stands as a last line of defense from the original rally base
This bounce attempt is key — a strong push from here could send price back toward the $3.30–3.50 region. But if bulls fail to hold, there’s room for a deeper retracement.
Trade Planning Notes:
Aggressive Long: Entry on wick into support with tight invalidation
Conservative Long: Wait for EMA reclaim confirmation
Bearish Case: Breakdown = target $2.25 zone
The path from here decides whether this is a healthy pullback — or the start of a reversal. What’s your play? 👇

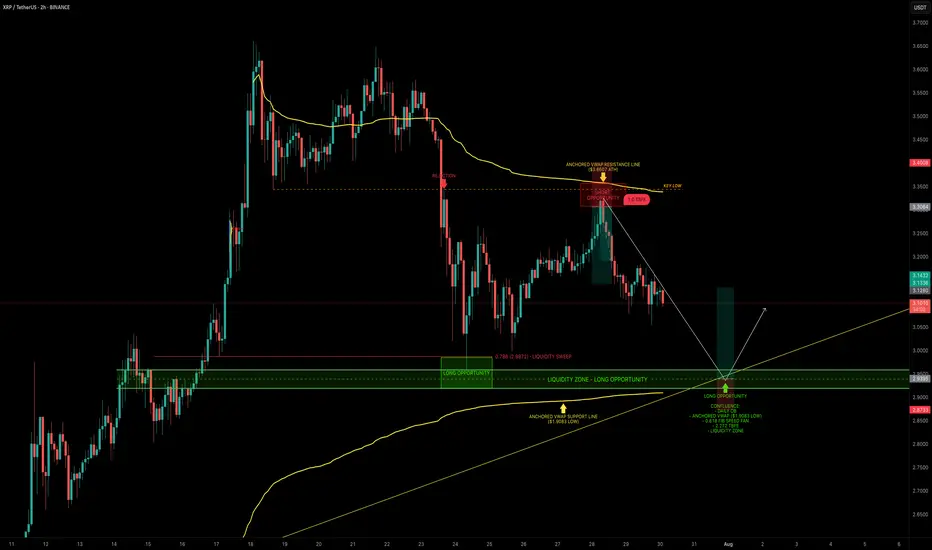
XRP — Mapping Out the Next High-Probability Long SetupXRP continues to respect key levels, delivering clean setups and strong technical reactions.
📉 Recent Price Action Recap
After the flush from $3.65 into the $3.00 support zone, XRP printed a solid bounce back toward the $3.30 resistance area, forming a clean short setup between $3.30–$3.35.
Price is now trading mid-range within the 6-day consolidation.
🟢 Next High-Probability Long Setup
A prime long opportunity lies between $2.96 and $2.9175 sitting within a key daily order block.
Confluence at this zone includes:
Liquidity pool just below the $2.9555 swing low
Anchored VWAP from the $1.9083 swing low resting just under the block
0.618 Fib Speed Fan lining up as dynamic support (July 30 – Aug 2)
2.272 Trend-Based Fib Extension at $2.9297
📈 Long Trade Setup
Entry Zone: $2.96 – $2.9175
Stop Loss: Below anchored VWAP (clear invalidation)
Target: $3.1/$3.13+
R:R: ~1:3+
💡 Educational Insight
This setup is a great example of how multiple tools layered together (like Fibonacci levels, VWAPs, order blocks and liquidity zones) can significantly increase the probability of a trade playing out.
When structure, volume-based tools and time alignment all point to the same area, it creates a high-confluence trade zone. These are the areas where risk is most defined and reward is most favourable, a principle every technical trader should anchor their strategy around.
_________________________________
💬 If you found this helpful, drop a like and comment!
Want breakdowns of other charts? Leave your requests below.
HBAR Momentum Hbar has gained some momentum lately. This is the ideal rally setup.
It has also yet to see real price discovery past .5
Large trade already opened.
DYOR, I believe this coin has a ton of potential.
Hederas' Council consists of entities like Google, IBM, Boeing Through VentureX, Standard bank.. Just to name a few.
But you all don't care about that.

Xrp - The final bullish breakout!💰Xrp ( CRYPTO:XRPUSD ) will create new all time highs:
🔎Analysis summary:
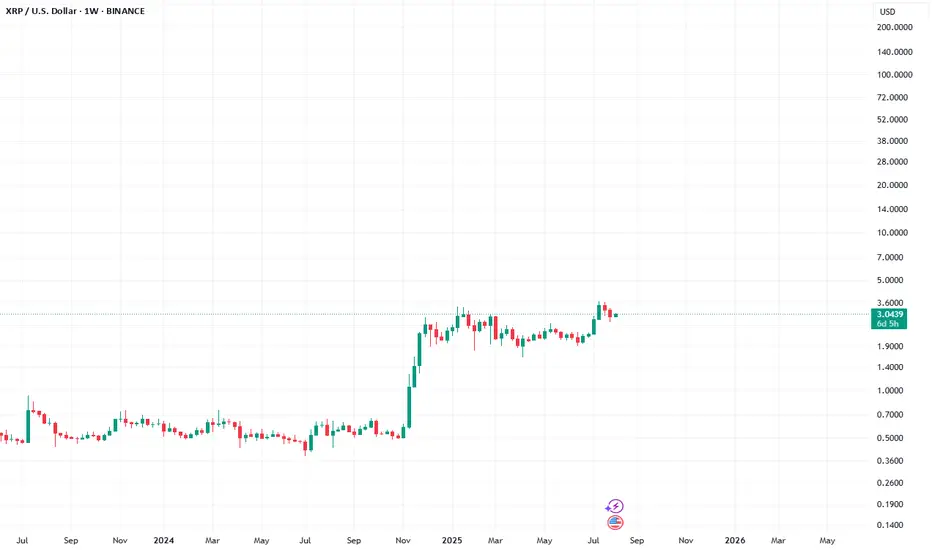
After a consolidation of an incredible seven years, Xrp is finally about to create new all time highs. With this monthly candle of +40%, bulls are totally taking over control, which means that an altcoin season is likely to happen. And the major winner will simply be our lovely coin of Xrp.
📝Levels to watch:
$3.0
🙏🏻#LONGTERMVISION
SwingTraderPhil

Xrp - This is the bullrun breakout!🔑Xrp ( CRYPTO:XRPUSD ) breaks the triangle now:
🔎Analysis summary:
After the recent bullish break and retest, Xrp managed to already rally another +100%. This is a clear indication that bulls are still totally in control of cryptos and especially Xrp. It all just comes down to the all time breakout, which will then lead to a final parabolic rally.
📝Levels to watch:
$3.0
SwingTraderPhil
SwingTrading.Simplified. | Investing.Simplified. | #LONGTERMVISION

Xrp - It all comes down to this!🚀Xrp ( CRYPTO:XRPUSD ) has to break structure:
🔎Analysis summary:
After Xrp created the previous all time high in 2018, we have been seeing a consolidation ever since. With the recent all time high retest however, Xrp is clearly showing some considerable strength. It all comes down to bulls being able to push price higher, above the massive horizontal structure.
📝Levels to watch:
$3.0
SwingTraderPhil
SwingTrading.Simplified. | Investing.Simplified. | #LONGTERMVISION

SHORT ZONE-XRP structure shiftThere was an XRP structure shift last week.
📉 It’s been bleeding ever since.
Now, another bearish setup is forming.
If XRP nears that descending trendline and fails to break through — it enters the SHORT ZONE.
🚫 No breakout? No mercy.
This isn’t the end for CRYPTOCAP:XRP — but a purge may be necessary before liftoff.
A proper cleansing to prepare for the next ascension.
🫡 xrpArmy, forgive me…
But hey, feel free to earn your keep.
Stay Sharp. Regulate Yourself.
🚫 100% NOT financial advice.
🎭 Edutainment purpiz only.
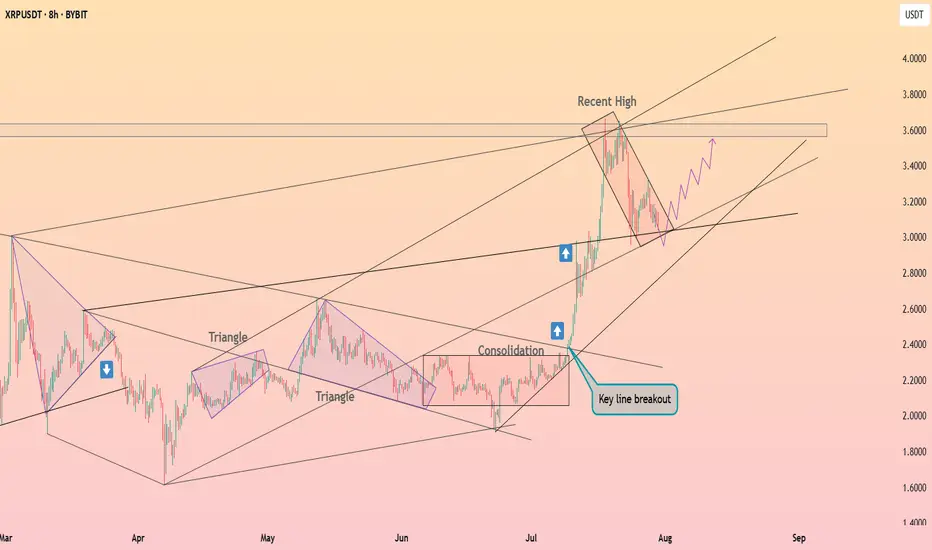
XRP is testing a support ┆ HolderStatBYBIT:XRPUSDT recently broke out of a long consolidation and triangle setup, rallying into the 3.60 region. It is now forming a falling channel — a common bullish continuation pattern. Price must hold the 3.10–3.20 support area for a renewed move toward 3.80–4.00. The broader structure remains bullish until invalidated.