LTC Litecoin Could Do One More Round Of Bouncing Within WedgeThis is a possible scenario here. This is in line format not candles so wicks could be lower than than this. Lines remove all the wicks and are just on an open and close basis, kind of cleaning up the noise. This is not guaranteed to happen but it is a possible scenario before we break out again around the end of March. I'll post below a candle chart as well so you can see those levels. As long as we stay within this wedge on a closing basis and within the channel on the candle format then we should be fine. If we break down below the wedge or channel and close below it then thats not going to be very good. I don't see this happening thats just worst case scenario.
Follow me for more updates. Not financial advice. Thank you
Xrp

$XRP: Ripple’s Rocket – Ready to Soar or Facing Turbulence?(1/9)
Good evening, everyone! 🌙 CRYPTOCAP:XRP : Ripple’s Rocket – Ready to Soar or Facing Turbulence?
CRYPTOCAP:XRP ’s up 8.4% despite a crypto crash, with SEC rumors fueling hope—but will adoption or regulation steer this rocket? Let’s dive in! 🔍
(2/9) – PRICE PERFORMANCE 📊
• Recent Trend: Gained 8.4% despite a crypto market down 20.57% in Feb, per U.Today 📈
• 2025 Context: Speculation of SEC appeal dismissal boosts sentiment 📏
• Sector Trend: Crypto market down, but CRYPTOCAP:XRP bucks the trend 🌟
It’s a fighter, shaking off the bears! ⚙️
(3/9) – MARKET POSITION 📈
• Ranking: Remains a top 10 cryptocurrency, per CoinMarketCap 🏆
• Use Case: Leading in cross-border payments with RippleNet ⏰
• Trend: Regulatory clarity hopes rise, potentially unlocking more adoption 🎯
Firm, a key player in the altcoin arena! 🚀
(4/9) – KEY DEVELOPMENTS 🔑
• SEC Case: Closed-door meeting Feb 27 fuels dismissal talk, per Ripple CEO’s X post 🔄
• Adoption: RippleNet partnerships expand, with new banks joining for faster payments 🌍
• Market Reaction: Up 8.4% amid market turmoil, showing resilience 📋
Adapting, with legal and adoption catalysts! 💡
(5/9) – RISKS IN FOCUS ⚡
• Regulation: SEC case uncertainty persists, appeal process ongoing 🕳️
• Market Volatility: Crypto market’s unpredictable swings can hit hard ❄️
• Competition: Other blockchain platforms vying for cross-border payment dominance ⚖️
Tough, but risks are part of the game! 🛑
(6/9) – SWOT: STRENGTHS 💪
• Resilience: Up 8.4% when others fall, showing strong investor confidence 🥇
• Utility: RippleNet’s fast cross-border payments attract banks and institutions 📊
• Community: Robust support from holders and Ripple’s strategic partnerships 🔧
Got fuel in the tank! 🏦
(7/9) – SWOT: WEAKNESSES & OPPORTUNITIES ⚖️
• Weaknesses: SEC case not fully resolved, adoption slower than hoped 📉
• Opportunities: Potential ETF approval, expanding CBDC projects, and new partnerships 📈
Can it break free and soar? 🤔
(8/9) – 📢 CRYPTOCAP:XRP ’s up 8.4% despite market crash, SEC buzz grows, your take? 🗳️
• Bullish: $3+ soon, legal win sparks rally 🐂
• Neutral: Steady, risks balance ⚖️
• Bearish: Below $2, regulation stalls 🐻
Chime in below! 👇
(9/9) – FINAL TAKEAWAY 🎯
CRYPTOCAP:XRP ’s resilience amid a market crash shows its mettle 📈, but SEC uncertainty and competition pose challenges 🌿. Volatility’s our friend—dips are DCA gold 💰. Grab ‘em low, climb like pros! Gem or bust? S

XRP - Strong Support Ahead!Hello TradingView Family / Fellow Traders. This is Richard, also known as theSignalyst.
📈XRP has been in a correction phase trading within the falling orange channel and it is currently retesting the lower bound of it.
Moreover, the green zone is a strong structure and round number $2.
🏹 Thus, the highlighted blue circle is a strong area to look for buy setups as it is the intersection of structure and lower orange trendline acting as a non-horizontal support.
📚 As per my trading style:
As #XRP approaches the blue circle, I will be looking for bullish reversal setups (like a double bottom pattern, trendline break , and so on...)
📚 Always follow your trading plan regarding entry, risk management, and trade management.
Good luck!
All Strategies Are Good; If Managed Properly!
~Rich

XRP ShortThe tools that will be considered as part of the forecast are kept secret.
Pay attention: This is not investment advice.

XRP Approaching Critical Resistance—Breakout or Major Rejection?Yello, Paradisers! Is #XRP gearing up for a massive breakout, or is this just another bull trap? Let’s break it down before the market makes its move!
💎#XRPUSDT has been respecting a major ascending channel, holding firm at key support levels. The recent price action has even formed a morning star-like pattern around support, signaling a potential bullish push ahead. But here’s the catch—bulls need to clear the $2.80 resistance first to open the path toward $3.00–$3.10, a major battle zone that could either fuel the next rally or lead to another rejection.
💎If buyers manage to break through the $3.10 resistance, we could see an explosive move toward $3.50–$3.60, aligning closely with the 1.272% Fibonacci extension—a historically significant level where profit-taking could kick in.
💎On the flip side, XRP is still getting solid support from its ascending trendline, which has held strong since December 2024. As long as this structure remains intact, bulls remain in control, and dips will likely be seen as buying opportunities. However, if this support breaks, expect a deep pullback before the next leg up.
Remember, Paradisers, trading is a game of patience and discipline.
MyCryptoParadise
iFeel the success🌴

Bitcoin - Bitcoin, waiting for another decline?!Bitcoin is located between the EMA50 and EMA200 on the four-hour timeframe and is trading in its descending channel. Bitcoin's downward correction and its placement in the demand zone will provide us with the opportunity to buy it again. It should be noted that there is a possibility of heavy fluctuations and shadows due to the movement of whales in the market and compliance with capital management in the cryptocurrency market will be more important. If the downward trend continues, we can buy in the demand range.
Donald Trump has issued an executive order on digital assets, directing the Presidential Task Force to move toward establishing a strategic cryptocurrency reserve that will include XRP, SOL, and ADA. He emphasized, “I will ensure that the United States becomes the cryptocurrency capital of the world.” Trump further added, “We are making America great again!”
He also highlighted Bitcoin and Ethereum as other valuable digital assets that will be central to this reserve, stating, “I love Bitcoin and Ethereum!” Following this announcement, Bitcoin responded positively to the news of the executive order.
On February 28, BlackRock made headlines after Bitcoin (BTC) dropped below $80,000. Amid speculation, some claimed that the company had sold $500 million worth of Bitcoin, playing a significant role in the price decline.
However, a closer analysis contradicts these claims. Data shows that BlackRock’s iShares Bitcoin Trust (IBIT) still holds 577,919 BTC. While this fund saw an outflow of 2,274 BTC on February 27 and a total of 10,595 BTC over the past week, this does not imply that BlackRock itself is selling Bitcoin.
These ETF outflows result from investors selling shares of the fund. In such scenarios, the ETF is required to sell Bitcoin proportionally to meet liquidity demands. Therefore, these movements are not directly tied to BlackRock’s own decision to offload BTC but rather reflect investor behavior.
Contrary to circulating rumors, BlackRock is not exiting Bitcoin; in fact, it has been increasing its exposure. Recent financial filings reveal that the company now holds a 5% stake in MicroStrategy (MSTR), up from 4.09% in September 2024.
Additionally, it has been announced that BlackRock plans to integrate its Bitcoin ETF into the firm’s $150 billion portfolio. This move suggests that rather than pulling out of the market, BlackRock is strengthening its position in Bitcoin-related assets.
Ultimately, this situation highlights how quickly rumors and speculation can spread during market downturns, but a detailed analysis of the data always provides a clearer picture of reality.
Meanwhile, Ronaldinho, the former Brazilian football star, has announced plans to launch his own cryptocurrency. He also warned his fans to stay vigilant against fraudulent meme coins.

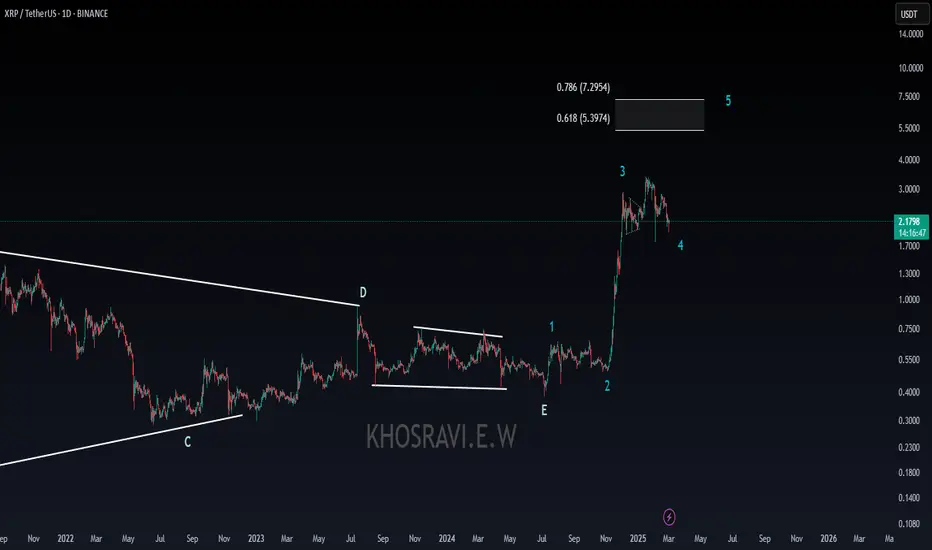
XRP Long-Term: Full Analysis—ATH Potential, Support & ResistanceWe are good with the short-term. We secured a great entry. It is time to consider how far up XRP will go and bull-market dynamics. How is XRPUSDT likely to behave in this 2025 bull-market.
The first data point to consider is the fact that XRP peaked early in 2021, it did so in April. This time around, this won't be the case. XRPUSDT is likely to go the full cycle together with the rest of the market. That is because the action that led to the April 2021 peak started in March 2020, strong bullish action for more than a year. In this cycle, XRP started growing in November 2024. An entire year growing would put a final peak around November 2025. This is the date that I am looking for most of the projects to peak. I will adapt and change if necessary as the action develops but I am still thinking that the bull-run will run into late 2025 and even into early 2026.
➖ Support & Resistance
There is a very strong resistance at $3.00.
$2.35 is the main support.
In December 2024, XRPUSDT peaked at $2.90, right below three. After a small retrace, it pierced the $3.00 barrier but closed below. Twice in January $3.00 worked as resistance and the third time a correction showed up.
The action is now happening below $3.00 and this is the final resistance, the last barrier. Once this level break, ALL-IN, full force. XRPUSDT will produce a major advance and produce several new All-Time Highs.
After the $3.00 barrier is broken, the main range were resistance will be found is between $4.44 and $4.68. This is a take profits target. Even if higher prices materialize later down the road, there will be a strong reaction around this level.
I am only mentioning the main levels. Next, we have $6.15 and $6.36 as the strongest resistance. This one should be monitored carefully. Whales and advanced traders will be watching this level for massive profit taking. If this level is conquered, there is no limit as to how high prices can go. We can enter a parabolic cycle. Some extremely bullish event would need to develop to support this type of growth. Or, the fifth wave is the speculative wave, so anything goes.
➖ Market Talk
The market will become tricky. Daily action will be erratic. Volatility in short. The big players will produce all sorts of moves in an attempt to remove weak hands, this will happen non-stop on the way up. It will be very hard to know what is going on and it will be easy to lose focus. To stay centered and grounded, just think long-term. When you zoom-in too close and start to get anxious, just remember the bigger cycle and the fact that the bull-market lasts the entire year. Detach, reduce leverage and hold. Once you are centered resume the game. Do not trade when you lose focus or you can end up closing your position on an impulse and there is no way to recover the great entry price.
➖ Speculation
Looking at the chart structure, I think it will be easy for XRP to move beyond $8. If we consider 2025 fully bullish, then much more is possible but I don't want to get in too deep, if you know what I mean. But I sure want to say that the conditions are extremely good and hyper-bullish. If you are going to err, err on the higher end. Aim high, aim up.
Thanks a lot for your continued support.
Namaste.

XRP strategic reserve announcment! UPDATED FORECASTAs indicated in prior post (see: ) we have now reached the near term liquidity target at 2.8-2.9 zone; this news of a strategic reserve is highly likely to be sold off to trap both bulls & bears who are over-leveraged.
They rarely waste a good PR for such price action.
Expecting one more liquidity sweep below 1.70 for a final discount buy opportunity!! Looking to enter with LIMIIT buy orders at 1.65 area; its possible that we extend as low as 1.35 but my mentality is its best not to be idealistic, perfectionistic, or entitled at those levels! The market does not owe you the best or lowest price on anything! For that reason, consider anything below 1.70 to be a huge gift with a big big bow wrapped around it!

We had told you, 'March gonna be BIG'Crypto Market Update – March Momentum in Full Swing! 🚀🔥
Alright, traders, March is here, and the market is pumping! No surprises here—I mentioned back in early February that I expected a strong March due to the delayed cycle effect, and here we are. The news followed the charts, not the other way around, which is why we stay ahead of the game! 📊🔍
Bitcoin (BTC/USD)
📍 Support levels:
$91,000
$91,206 (key short-term level)
$91,353 (minor support)
📍 Breakout zone:
Above $96,000, price is totally free to explore higher levels. Watch out for resistance clusters on the way up.
Ethereum (ETH/USD)
💎 Major resistance:
$2,627 - $2,634
📍 Breakout target:
Over $2,634, we should see a run toward $4,000. 🚀
Ethereum remains extra bullish—momentum is strong!
Solana (SOL/USD)
📈 Key levels:
Support: $166.72
Resistance: $215 - $223
Solana has broken back into its channel, showing strong momentum. A better entry is now possible, given solid support at $166.72.
Cardano (ADA/USD)
🔥 Trade of the week!
Major support: $1.00, $0.98
Target: $1.19, with bullish continuation potential
If we lose the $0.98 support, then it's time to consider shorting. Otherwise, the momentum is strongly bullish.
XRP (Not my top pick, but here’s the setup)
📍 Support: $2.48, with additional support around $2.66
📍 Resistance: $3.11 - $3.30
Wouldn't be my preferred trade right now, but price action will tell us more.
🚨 Breaking News: Market Liquidity Surge!
Over $330 billion added to the crypto market in just 4 hours! 💰🔥
Trump announces a Crypto Strategic Reserve 💎🇺🇸, consisting of Bitcoin and other top cryptocurrencies, aligning with Executive Order 14178.
The market is picking up steam, and levels are holding strong. Keep your eyes on these key support/resistance zones, set alerts, and trade smart. Exciting times ahead! 🚀💡
One Love,
The FXPROFESSOR 💙
🔗 Stay updated on my TradingView!

...And Back to Trump Pump againTrading Fam,
Just Friday I made a video titled, "Trump Pump. Trump Dump." The Trump pump occurred b/c of the election. The Trump dump occurred b/c of the Tariffs. And now, we are back to a Trump pump cycle b/c of promises to a crypto reserve. I have a feeling that this may be how it goes for crypto for a while until the community can observe actual tangible action vs. verbal accolades and promised use. But enjoy those gainz now.
✌️Stew

Cryto Bull run StartingCrypto Strategic Reserve News sparking a Crypto Bull run? Seeing nice push across several crypto assets. How long will the bull run last?

SONIC ( PRE FTM )Analysis of the FTM OR Sonic currency
It seems that a trend reversal has formed and has completed 5 microwaves in the form of a larger wave 1
Next we need to see if it can break the major ceiling to confirm the new move
If you liked the analysis, share it with your friends and write down your comments

XRP ANALYSISVery important #XRP analysis on the daily time frame
Which in my opinion is one of the most important time frames to understand and comprehend the next movement of this currency.
So stay with us to be aware of the Ripple trend
If you liked this analysis, share it with your friends
Thank you
$XRP/USDT is testing a strong support zone around $1.80 - $2.00,$XRP/USDT is testing a strong support zone around $1.80 - $2.00, aligning with the Point of Control (POC) and the 200 EMA ($1.80), which acts as dynamic support. This area has historically been a high-volume demand zone, making it a crucial level for a potential reversal.
If buyers step in and defend this level, XRP could rebound toward $2.50 - $3.00 in the coming weeks.
However, a break below $1.80 would weaken bullish momentum and could lead to a deeper correction, possibly toward $1.50 or lower.
DYOR, NFA

The key is whether it can rise after receiving support at 2.1453
Hello, traders.
If you "Follow", you can always get new information quickly.
Please also click "Boost".
Have a nice day today.
-------------------------------------
(XRPUSDT 1W chart)
After the sharp rise, the HA-High indicator on the 1M chart is showing signs of being newly created due to this decline.
Currently, the new point where the HA-High indicator on the 1M chart is being created is 1.5467.
Accordingly, if it is definitely formed at the 1.5467 point next month, it seems possible that it will fall to around this point.
As the M-Signal indicator of the 1M chart is rising near 1.5467, an important support zone is expected to be formed near 1.5467.
-
However, if it receives support near the M-Signal indicator of the 1W chart and rises near 2.5641, the M-Signal indicator of the 1M chart may disappear from its appearance.
Therefore, the key issue at present is whether there is support near the Fibonacci ratio 2.24 (2.1563).
-
(1D chart)
The key issue is whether the price can be maintained within the lower line of the Price Channel indicator and rise above the M-Signal indicator of the 1D chart.
If not, and it falls,
1st: 1.902(1.8762) ~ 0(1.9954)
2nd: 1.5467
You should check if it is supported near the 1st and 2nd above.
-
Thank you for reading to the end.
I hope you have a successful trade.
--------------------------------------------------
- Big picture
I used TradingView's INDEX chart to check the entire range of BTC.
(BTCUSD 12M chart)
Looking at the big picture, it seems to have been maintaining an upward trend following a pattern since 2015.
In other words, it is a pattern that maintains a 3-year upward trend and faces a 1-year downward trend.
Accordingly, the upward trend is expected to continue until 2025.
-
(LOG chart)
Looking at the LOG chart, you can see that the upward trend is decreasing.
Accordingly, the 46K-48K range is expected to be a very important support and resistance range from a long-term perspective.
Therefore, we expect that we will not see prices below 44K-48K in the future.
-
The Fibonacci ratio on the left is the Fibonacci ratio of the uptrend that started in 2015.
In other words, it is the Fibonacci ratio of the first wave of the uptrend.
The Fibonacci ratio on the right is the Fibonacci ratio of the uptrend that started in 2019.
Therefore, it is expected that this Fibonacci ratio will be used until 2026.
-
No matter what anyone says, the chart has already been created and is already moving.
How to view and respond to this is up to you.
When the ATH is updated, there are no support and resistance points, so the Fibonacci ratio can be used appropriately.
However, although the Fibonacci ratio is useful for chart analysis, it is ambiguous when used as support and resistance.
This is because the user must directly select the important selection points required to create Fibonacci.
Therefore, since it is expressed differently depending on how the user specifies the selection points, it can be useful for chart analysis, but it can be seen as ambiguous when used for trading strategies.
1st : 44234.54
2nd : 61383.23
3rd : 89126.41
101875.70-106275.10 (Overshooting)
4th : 134018.28
151166.97-157451.83 (Overshooting)
5th : 178910.15
-----------------

XRP/USDT 8H chartHello everyone, let's look at the 8H XRP chart to USDT, in this situation we can see how the price moves in a local inheritance trend much lower than the trend line itself.
However, let's start by defining goals for the near future the price must face:
T1 = $ 2.29
T2 = $ 2.39
Т3 = 2.50 $.
T4 = $ 2.65
Let's go to Stop-Loss now in case of further declines on the market:
SL1 = $ 2.14
SL2 = $ 2
SL3 = 1.77
Looking at the RSI indicator, we see
As we bounced again from the lower limit of the range, similarly to the MacD indicator with we go down and lower which in the coming time can end the correction.

XRP pushing back up?XRP is currently trading at 2.235, hovering near a potential rising wedge breakdown, which often signals a bearish move. However, a key support zone between 2.17 and 2.27 could act as a safety net, potentially triggering a bounce if buyers step in. If this support holds, XRP might push back toward the resistance zone at 2.50–2.80, with a breakout possibly targeting 3.00. But if the price slips below 2.17, it could drop toward a deeper support at 1.77. These levels are critical, think of support as a floor and resistance as a ceiling where price action often reverses or stalls.
Technical indicators are leaning bearish but not overwhelmingly so. The price is near the 50-hour moving average (MA), staying above it would be bullish, while dipping below could invite more selling. The RSI is below 50, indicating weak momentum, and the MACD shows a bearish crossover, suggesting downside risk. Volume is steady, but a spike could confirm whether a breakout or breakdown is real. Watch these tools closely: a price bounce from support with rising volume and improving RSI/MACD could flip the short-term outlook.
Market sentiment is mixed, clouded by the ongoing SEC lawsuit against Ripple, which keeps some traders cautious. On the flip side, rumors of ETF approvals or new partnerships could spark a rally if confirmed. Social media reflects this split, some see a breakout to 2.80–3.00, others brace for a pullback to 1.77. To stay ahead, set alerts at 2.17 and 2.50, monitor volume for confirmation, and keep an eye on crypto news for updates. With uncertainty high, consider using stop-losses below 2.17 (if long) or above 2.50 (if short) to manage risk. Don't forget: patience is key.

XRPUSDT - LONG FROM POI 4HTechnically, XRP looks good for a mid-term trade!
The sloping line breaks through, but there is no volume as such due to market uncertainty. Therefore, I plan to wait for a local correction as opposed to retail traders and in the POI range , I will consider a long position
If my personal expectations are confirmed, I will consider the position in the format as indicated on the trading chart.
Targets:
$2.2695
$2.3663
$2.4492
Risk management - 1% on stop order

XRP REJECTED FROM RESISTANCE Analysis 🚨
CRYPTOCAP:XRP is testing the red resistance zone 🔴 and is getting rejected. The next target is the green line level 🟩.
🎯 Target: Green line level

DOGE The Next To Die In This Flush Of Crap Down The ToiletDoge had an amazing run, those who made money and got out I applaud you. Those still holding these bags of coal are about to get wrecked. Memes are dying, no one cares about them anymore. People are beginning to realize that these things have ZERO utility and no future. No ETF will ever get approved, its too inflationary. Take a look at the Grayscale trust thats a great insight to how many institutional investors want this thing. Its Total assets under management are less than $2 million dollars. Thats laughable compared to their other holdings. So even in the slim chance this turd gets an ETF it'll be an epic failure.
Your messiah Elon has abandoned this thing, the onyl real hope you all had for real world utility. Litecoin miners are dumping this as soon as they get it. The meme coin frenzy has died down. In January alone this year there were 600,000 meme coins created thats an all time record for a single month. That meme bubble is about to collapse as people move toward more utility driven cryptos and this space gets wrangled in a bit. Many people including myself have made a bunch of money playing in the meme coin casino, it was fun when it first started. 100x's everywhere. Now its pretty much over. The future for Doge is a slow and steady decline back to NAV under a penny. It was a great pump and dump. Dont marry your investments especially ones that are just memes with no utility they are made to get in and out, make money and rotate into something of value to preserve your wealth.
None of this is financial advice, just my opinion.

LTC Litecoin Fireworks Are About To Start ETFs Loading UpHello my friends, Im sorry for not being here for a while, my life was very busy over the past year. Im hoping now that things are settled down I can do these charts again regularly.
That aside lets get into Litecoin. Litecoin has been outperforming almost the entire market lately moving from 25th position on Coinmarketcap to now 12th position over the course of just a couple months or so. Litecoin is showing big time strength over all the others. Every day its holding onto more and more of its gains while others are making new lows or lower highs. We are at the apex now. Litecoin must break over $147 and close that candle on at least the 2 day to be confirmed. Once that happens I don't think there will be many pullbacks from there and if there are they will short lived.
The ETFs for Litecoin are really gaining steam. Charlie Lee did an interview back in I believe it was December with The Litecoin Forecast YouTube channel and Charlie was saying that if anyone had large amounts of Litecoin and wanted to help seed the Canary ETF to contact him directly. The ETF is coming 100% there is no question about that. Once these ETFs get approved Litecoin has such an illiquid supply the price of Litecoin will skyrocket so fast and so high it'll leave everyone in disbelief and with their mouths dropped. Miner reserves are at an all time low, so no serious dumping or resistance levels along the way like previous runs. People and institutional buyers are realizing that Litecoin is the second Bitcoin. they realize that Litecoin is THE Altcoin and the rest are just clones, copies and junk. The fact that Litecoin is te most used crypto worldwide and has been for a long time shows that the PEOPLE chose Litecoin over all those other chains to transact in, even over Bitcoin. People are realizing that Litecoin is the better Bitcoin and was made to be that way. There is no denying that Litecoin is the chosen crypto, its provable with on-chain metrics! No hype, no advertising, nothing just pure organic adoption. Thats what make a winner in this space. We dont need a tweet from Elon or constant promises and upgrades to keep Litecoin relevant. Litecoin will move to the #2 spot under Bitcoin.
Once this move starts and Litecoin starts going parabolic you will see the pump chasers and fomo rotating out of the already extremely overvalued trash they bought the top in to get into Litecoin. All the non believers, all the haters, all the wounded who sold angrily, everyone will pile into Litecoin. You will hear a lot of language especially from the haters saying that its just a pump and dump along the way. Eventually they will all change their tune when Litecoin continues to rise and rise and rise and wont stop. Dont be fooled and dont sell early, Litecoin is going to shock the entire world and thats not being dramatic. It will be on every news channel. Big institutions will be talking about it. Blackrock will get in along with all his buddies. Its coming I promise that. I had made my previous predictions not really knowing what the catalyst would be other than the charts and some on-chain data. Now I know why Litecoin will make that move I was predicting. The ETFs are going to bring in a flood of money like no one has see before and the world will realize that Litecoin is Bitcoin #2. The ones who missed Bitcoin at $1000 are going to flood into Litecoin for their chance to get the second faster Bitcoin.
I know I was wrong on the timing of the last predictions I made thinking that maybe it could have happened in 2024. I didnt expect the market to be this drawn out, I dont think anyone did. It is different this time despite what everyone else says. The cycles are getting longer and longer as more and more people enter the space. There isnt a huge rotation from Bitcoin into Alts anymore because now the ETFs are locking it up. No more Alt seasons like we were used to . I believe that my chart showing 13K for Litecoin is just the beginning. Litecoin will be worth 1/4 of Bitcoin in the future. I dont want to say that Litecoin could overtake Bitcoin but it might you never know this market is wild. Litecoin in these next few years and over the course of a couple cycles within this larger cycle we could see Litecoin at $50k each. Once all the money drains out of the overhyped and overacalued trash thats currently out there, they will eventually move into Bitcoin, and Litecoin. Maybe a couple others that are competing for the smart contract side of things but as far as Cryptocurrencies go Litecoin and Bitcoin are the only two that will remain relevant. The rest are just projects and platforms and wanna be Cryptocurrencies all the way down the line. Litecoin is about to create so many millionaires in such a short period of time its going blow everyone's mind.
Eventually Litecoin network will be so busy because of real world use, it'll have to stop mining Doge which is just a leech off the network. Miners wont waste energy on that. Doge will eventually move back down to where it came from. XRP holders will eventually realize that they have been duped into keeping the rich lifestyles of the Ripple team going for so many years on just hype. The meme coins are losing interest. All those holders are going to lose everything, literally. I cant believe how many have their entire investment in these silly Fartcoin, Titcoin and all the other ridiculous coins with zero value. They were fun to make quick money on but they are no longer as profitable and the risk is way higher than the reward now. Frogs, Dogs, Cats, Squirrels all are going to die and go to zero. The crypto market will be wrangled and only the strong will survive. All that capital will flood out of the trash and there will be a mad dash for actually utility. In the Dot com boom there were so many internet companies it was crazy but at the end of it only a few strong ones survived and thrived and became the powerhouses that we see today. Thats exactly what I see for the cryptospace.
Litecoin holders will soon be vindicated!
None of this is financial advice, this is just my opinion.

Be careful with RIPPLE !!!The price has formed a bullish wedge on the 1h time frame, and if it breaks out, it can drive the price up to around $2.8.
Give me some energy !!
✨We spend hours finding potential opportunities and writing useful ideas, we would be happy if you support us.
Best regards CobraVanguard.💚
_ _ _ _ __ _ _ _ _ _ _ _ _ _ _ _ _ _ _ _ _ _ _ _ _ _ _ _ _ _ _ _
✅Thank you, and for more ideas, hit ❤️Like❤️ and 🌟Follow🌟!
⚠️Things can change...
The markets are always changing and even with all these signals, the market changes tend to be strong and fast!!

XRP has TOPPED. you wouldnt believe it thoughxrp has topped. and should bottom around 65-75c.. just like in 2018 , 2021, no one thought the top was in.. just like what will happen now... oh well
