#XRP Update #2 – July 15, 2025#XRP Update #2 – July 15, 2025
XRP had previously completed the correction of its first impulsive move. Now, it has also completed the correction of the second impulsive leg. The current target for XRP stands around the $3.15 zone.
However, before reaching that level, it first needs to break through the $3.00 resistance area, which previously acted as a strong support/resistance zone. If XRP fails to gain enough volume and momentum for a strong breakout, there is a risk it may reverse from this level, potentially forming a double top pattern.
Because of this uncertainty, I do not recommend taking a long or short position on XRP at this stage.
Xrp

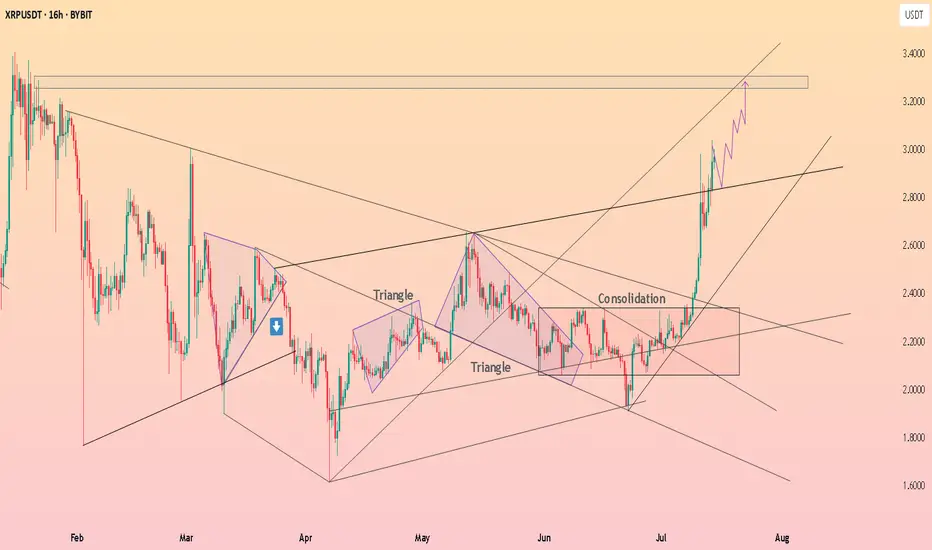
HolderStat┆XRPUSD explosive growthBYBIT:XRPUSDT rallied out of consolidation and triangle formations, driving price quickly toward the $3.20–$3.40 range. The trend remains bullish with structure pointing toward continued upside as long as support holds above $2.80.
$XRP All Tie High After Shallow Pullback?CRYPTOCAP:XRP had a fantastic week smashing all resistances. I am looking for a shallow pull back to test the High Volume Node support at $2.7 at the .236 Fibonacci retracement before continuing to challenge the all time high.
Wave (3) of a motif wave appears complete adding confluence to a shallow retracement for wave (4).
Daily RSI is extremely overbought.
Safe trading

XRP $6.5, $9.5, $12.5 & $15.5 · Which One?XRP broke a small local downtrend and managed to close above a small resistance zone around $2.76. It managed to do this on a full green candle with rising volume.
XRPUSDT weekly is currently trading above all moving averages, extremely bullish: MA200, EMA377, EMA233, EMA89 and the rest.
If we look at a bull market cycle as a series of three steps, we have the first two missing the last one. Compare current action with 2021 while noticing the 1,2,3 numbers on the chart. This leaves us wondering about the next target: How high can XRP go in its next bullish move?
It seems something extraordinary is brewing behind the scenes, I can feel it. What we've been saying all along but rather than just words, a new feeling came up. "It is not the same to live through an event vs talking about it." That kind of feeling.
I can continue to say that market conditions are extremely positive now especially when we compare it to several years ago. But we have not seen the effect this positive conditions will have on the market, the price of the different projects and the charts, but we are getting close.
XRP has big plans and continue to grow, expand and evolve.
The 2021 bull market from bottom to top produced more than 1,800%. In 2025, if we start counting from the July 2024 low, a target of $6.50 would mean a total of ~1,585% growth. Market conditions are better now so we can aim higher, expect more.
A target of $9.51 sounds great, this would mean a nice ~230% from current price and from the same low as before, a total of ~2,400%. This sounds better but we can do more.
The next two targets based on an extension of the current trend would lead to $12.5 and $15.5. I'll let you calculate the potential yourself.
$6.5, $9.51, $12.5 or more; whatever the market ends up giving us, we are happy to be part of this adventure and we are always grateful for the amazing results.
Aim high. I will be here reading the charts live when we are getting close to the top. There will be time to sell, time to adapt, time to decide. There will be enough time for everything if you start now. Prepare now and success is yours.
We are early for the last phase of the XRP 2025 bull market. The first half is in, we are due the second half; it will be great.
Namaste.

XRP SHOOTS UP TO $3! 🌠 Wow, we'll, we've done it. We've hit $3 once again. Before I start this idea just want to give my thanks for tuning in, appreciate it.
🌠 This month has been pretty incredible for Ripple to say in the least from the BNY-Mellon Custodian Deal to Trump's Media company filing for a crypto Blue Chip ETF of which included the likes of XRP. With all the news and positive sentiment around XRP and Bitcoin which itself has hit a new All-Time-High hitting $123,000! Below I'll add a Bitcoin chart for reference:
🌠 To say in the least it's been a golden month for Crypto and Digital Assets. And one important thing to note is that as of today the Fedwire Funds Service is set to go live with the ISO 20022 standard starting July 14, 2025. The implementation will replace Fedwire's dated (FAIM) format with the ISO 20022 message format with the change happening over a single day.
🌠 For those that don't know ISO 20022 is a global messaging standard for financial transactions meant to reduce cost and fraud alongside automate transactions and reduce transactional costs. What this means for XRP is that it could become a much bigger player in cross-border payments now through RippleNet as XRP is one of the selected assets for the ISO 20022 standard.
🌠 ISO 20022 and global institutions will start utilizing XRP and it's ability to process transactions seemingly instantly and efficiently while significantly cutting down on cross border and transaction costs making it a considerably solution for banks and financial institutions. After all, if your objective is to make money, and you can make more money while cutting down on costs and making transactions, record keeping much simpler, then why not? Especially in an age where everyday things are continuously advancing and improving nobody want's to be left behind. Especially the big financial players.
🌠 Curious to see if prices can hold and keep pushing but just going off technical, we already know $3 is a tough point. At $3 just over 95% of XRP holders are in profit which makes a good reason for many to sell and take profit but with all the news and ISO now really kicking in we may not see as much selling, especially as holders are more confident and less likely to be swayed in letting go of their XRP. So it'll definitely be interesting to see how things play out.
🌠 Main thing will be Bitcoin, even if XRP holders hold I can't guarantee the same for Bitcoin, especially should it start to reverse, we know how financial institutions play taking advantage of the news. Just be cautious and set some price level alerts whether your trading XRP or Bitcoin.
🌠 In the long run things look very good regardless of what happens in the next week or two so keep that in mind. I'll be watching XRP to see if we can continue and break $3 but in my experience, with these impulse waves we usually see a big move up followed by some retracement as traders look to test support and liquidity so the waters may turn choppy but again like I said, we're here focused on the long term, whatever happens happens. We'll still be here for that but nonetheless the main objective is the longterm. $3 may seem like a lot but it's nothing compared to what XRP has in store.
🌠 This week is also 'Crypto Week' for lawmakers in DC as U.S lawmakers get ready to potentially pass changes in the regulatory setting when could push even more institutional demand further adding to the hype and optimism the crypto space has been running with as of lately.
🌠 Have to run but thanks as always for tuning in, really appreciate it and hope everyone is doing well! thanks as always and all the best till next. Feel free to keep posted and follow for more as always.
Best regards,
~ Rock '

XRP – Dual Trends Active, Ready to Outperform - $7 Incoming
Two active trends on CRYPTOCAP:XRP right now—monthly and weekly confirmations are in, which significantly boosts the probability of hitting the first target.
Honestly, I see this outperforming CRYPTOCAP:ETH , though both are worth holding.
With both timeframes aligned, I’m expecting a strong move.
Targeting $7 on CRYPTOCAP:XRP and over $7k on $ETH.
Xrp cup and hundleChart Xrp/usdt (4h)
Classic cup&hundle breakout in play. price broke above the neckline $2.5 with strong volume, followed by a clean retest of the breakout zone

$XRP Macro Tiangle Final Thrust ContinuationCRYPTOCAP:XRP completed a macro triangle pattern last year. Triangles proceed a terminal motif wave which already completed a wave 3.
Wave (3) of (5) is underway with a terminal target around $5.7 after price broke out of the pennant / wedge pattern.
Weekly RSI confirmed bullish divergence.
Safe trading
ATH Mode On => Request Your Altcoin Analysis NowThe bulls are back in action, and momentum is building fast! ⚡
To celebrate this major milestone, I’m opening the floor to YOU 👇
Request any altcoin in the comments, and I’ll personally share my technical analysis on it! 📊✅
Let’s make the most of this market together — it’s altcoin season waiting to happen! 🚀
📚 Always follow your trading plan regarding entry, risk management, and trade management.
Good luck!
All Strategies Are Good; If Managed Properly!
~Richard Nasr

XRP Ready To Grow: $4.5 w/ 5X Lev = 475% Profits PotentialThe last time XRP moved above EMA55 daily was in early November 2024, you know pretty well what happened right after. Just a few days after EMA55 was conquered as resistance XRP grew from a price of $0.54 to a peak of $2.90 in less than one month. It continued to rise and peaked again but this time at $3.40. The market turns bullish above EMA55 and this same signal is active, valid, live today.
XRPUSDT has been fighting with EMA55, fluctuating around this level, since late April. Now, this resistance is no more. The bullish bias is fully confirmed after a decisive higher low. This is it... This is all we need, the next target is up.
» 95% is the easy target at $4.50. With 5X lev. we get 475%.
We've done this together many times before... This is not the last target but since this is a strong resistance we can wait for the retrace and enter again once support is found. That is, there will be a stop at this level.
This is a strong chart setup. The price is not the best ever, it would be better to enter lower and that is why we have only 5X. With a lower price we can do 7X, 8X and even up to 10X. Hardly ever I recommend more than 10X, it just isn't necessary and the risk is too high.
I am wishing you great profits and continued success.
This is a friendly reminder to let you know that XRP is ready to grow.
Thank you for reading.
Namaste.

XRP SKYROCKETS AND BREAKSOUT PRICE RANGE! ⭐️In a pretty crazy twist and turn of events we're seeing XRP absolutely skyrocket and breakout with this morning's announcement on behalf of President Donald Trump with his Truth Social media platform announcing it had filed for a Crypto Blue Chip ETF with the SEC.
⭐️ The Blue Chip ETF proposal includes 70% holdings in Bitcoin, 15% in Ethereum, 8% in Solana alongside 5% in XRP and 2% in CRO which is from Crypto.com. This notably has led to the breakout with XRP that we're currently seeing with the crypto already up 12% since the day started and news broke out. It's still early morning too so we'll see how the market reacts as the day continues and traders wake up to the news.
⭐️The past few weeks have seen XRP stuck within this horizontal channel and constant tug a war between $1.90-$2.30 with this breakout and the last week signaling bullish optimism towards the crypto alongside news of the BNY-Mellon deal with BNY Mellon set to become the Custodian for Ripple's RLUSD Stable coin. And for those that don't know BNY-Mellon is America's oldest bank having been founded in 1784 and with an estimated $45.7 trillion in assets under custody and/or administration. To say in the least this is a big step for Ripple showing more institutional growth.
⭐️To note also is this as I'll show below on Bitcoin's chart:
⭐️ It's crazy to say but we've just seen Bitcoin form a new All-Time High at $118,100 alongside the Crypto Blue Chip announcement, more than likely with investors and institutions flocking to buy in before the ETF get's approved and likely in anticipation of a bullish shift.
⭐️ We've already seen the crypto space weather the storm through the last few weeks and months with everything that's happened from global escalations to all the new bills and changes in the government. Through thick and thin the crypto space has proved resilient and investors are taking note.
⭐️ Have to run for work but wanted to get a quick idea out there, especially since this news just broke out. Some pretty crazy stuff and I'll be watching these levels here to see if things continue or if the news has simply given us a breakout, regardless it's a win-win with all this news only pushing the directive and story towards crypto and digital assets for many. I'll attach a link below to an article on the Blue-Chip ETF for reference as well.
⭐️ Thanks so much as always and all the best till then, feel free to keep posted for more updates and ideas as we continue on this journey we've been riding the last few years already. It's been a lot but it's got much more to go. Let's keep at it and keep our heads up.
⭐️ Reference on Crypto Blue Chip ETF:
apnews.com
Best regards,
~ Rock'

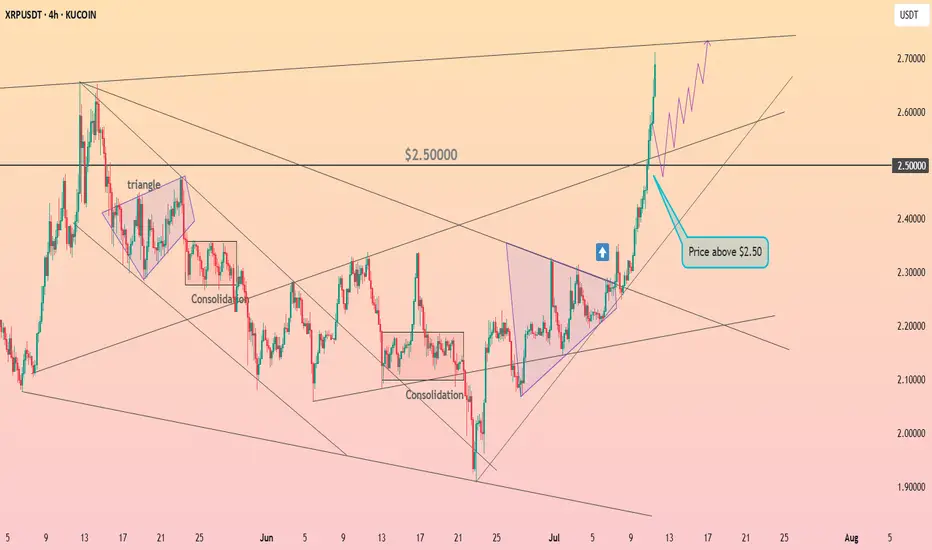
HolderStat┆XRPUSD above the $2.5KUCOIN:XRPUSDT has rallied sharply, breaking above the key $2.50 resistance following multiple consolidation and triangle patterns. Momentum remains strong, and price structure supports continuation toward the $2.75 resistance zone.
BITCOIN's PUMPs are Getting LARGER this Bull Market...However, it may take a bit longer to realize those expansionary moves.
If Bitcoin adheres to the established cycle pattern, we can anticipate a minimum surge of 103% that should carry us into the fourth quarter of this year.
Consolidation ----> Fake breakdown ----> then expansion.
Are you ready?

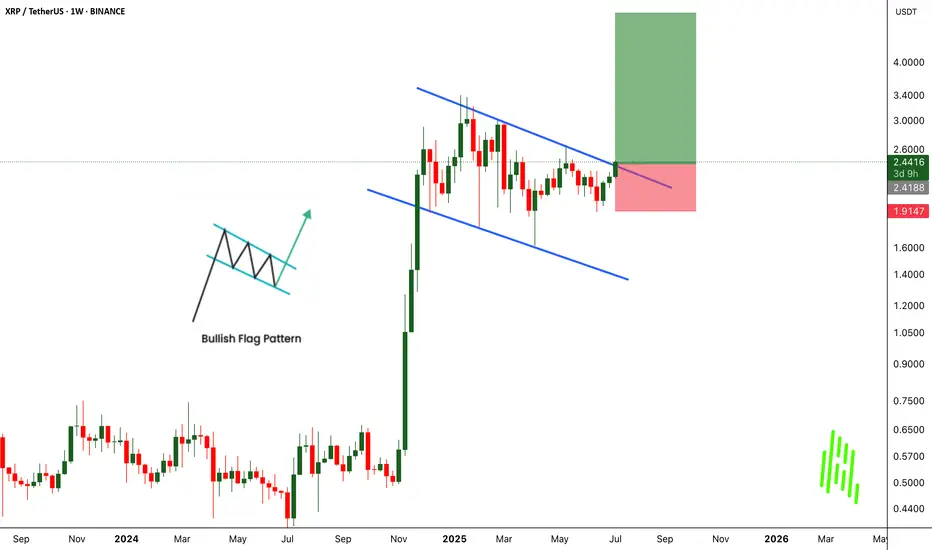
XRPUSDT Breaks Out of Bullish Flag - Big Moves Ahead!BINANCE:XRPUSDT has broken out of a classic bullish flag pattern on the weekly chart, signaling a strong continuation to the upside. This textbook setup is known for its high success rate, and the breakout suggests the potential for significant gains if momentum continues.
The CRYPTOCAP:XRP community remains strong, with long-term holders showing confidence and resilience. With the current market structure and support from loyal investors, there’s a real possibility for the price to double from this breakout zone.
The strategy is simple. Buy and hold for the long term. But as always, traders must manage risk carefully and use a proper stop loss. Let the flag fly high. CRYPTOCAP:XRP could be ready for a major pump from this level.
BINANCE:XRPUSDT Currently trading at $2.43
Buy level : Above $2.4
Stop loss : Below $1.9
Target : $5
Max leverage 3x
Always keep stop loss
Follow Our Tradingview Account for More Technical Analysis Updates, | Like, Share and Comment Your thoughts
XRP/USDT Monthly Chart: History Repeating Itself?Hey traders! Let’s dive into this monthly XRP/USDT chart. I’ll be honest — I’m skeptical about this outcome, but let’s break it down because it could actually happen!
The chart screams déjà vu, with XRP’s price action mirroring the 2014-2018 period. Back then, XRP broke out from its 2014 ATH in 2017, leading to a massive rally. Fast forward to now, and we’re seeing a similar setup, but with a twist. XRP is struggling to break through the 2018 ATH resistance zone around $3.31, which reminds me of the Breakout Consolidation phase we saw in 2017. Historically, this consolidation led to a breakout, and the chart hints at a potential repeat!
If XRP breaks out soon, we could see a parabolic move, potentially targeting much higher levels. However, the current resistance is a tough hurdle, and if it fails, we might see a pullback to lower supports.
Key Levels to Watch:
Resistance: $3.31 (2018 ATH)
Support: $1.643 (previous consolidation low)
Breakout Target: To be determined (potentially parabolic)
Breakdown Risk: $0.650
I’m not fully convinced, but the setup is intriguing — could this be XRP’s moment to shine? What do you think? Let’s discuss below!

XRP - Wait For It!Hello TradingView Family / Fellow Traders. This is Richard, also known as theSignalyst.
📈 Is history repeating itself? 🤔
XRP is now back at the $1.75–$2 support zone and forming a fresh inverse head and shoulders pattern.
As long as this support holds, we’ll be on the lookout for new long opportunities. 🟢
For the bulls to take over in the short term, a break above the green neckline is needed.
And for long-term control, a break above the red structure is essential. 🔺
For now, we wait patiently! ⏳
📚 Always follow your trading plan regarding entry, risk management, and trade management.
Good luck!
All Strategies Are Good; If Managed Properly!
~Rich

XRP - Time to buy again! (Update)It seems the price is forming a head and shoulders pattern, which, if correct, suggests a good price increase in the coming days. However, we should wait for the pattern to fully complete.
Best regards CobraVanguard.💚

XRP $1.95DISCLAIMER:
This analysis is for educational and informational purposes only and does not constitute financial advice. I am not a licensed financial advisor or professional trader. Always do your own research and consult with a qualified financial professional before making any trading decisions.
XRP is showing clear signs of weakness as price approaches the long-term descending trendline. Back on May 14th, we saw a strong bearish reaction — a thick-bodied candle rejecting directly off the trendline. Since then, price has struggled to revisit the trendline, failing to even tap it again.
Most recently, XRP has been leaving repeated upside wicks, suggesting aggressive sell orders are filling around the 1.27 extension, which I believe is being defended by a hidden bearish order block. Price action confirms that buyers are being absorbed before a full retest of the trendline.
This reinforces the short bias with a setup targeting a break below $1.95.
• Entry: Below $2.22
• Stop Loss: $2.2675
• Take Profit: $1.95

Congress passes H.R 1 into law. About the new bill.🔵 In what's been an eventful last few weeks congress passed H.R 1 which is essentially Trump's 900 page mega bill Act. Both Democrats and Republicans ultimately united against each other over the bill with Vice President Vance casing the tiebreaking vote giving Senate Republican's the large legislative victory.
🔵 To note is that independent-minded Republican Lisa Murkowski, senator of Alaska had some concerns with the bill before GOP negotiators we're able to acquire her vote for the 50-50 votes. Murkowski's primary issue was with the legislation's changes to Medicaid and federal food assistance funding which she was concerned would hurt her home state understandably. Republican's originally tried to sway her vote by adding language to shield Alaska from the full effect of the legislation's Medicaid and SNAP cuts.
🔵 Parliament opposed that as it violated the Byrd Rule which is there to determine the legislation that can go into a budget reconciliation package as well as passing with only GOP votes. Least to say the amendment was reworked many times in order for the waivers for the SNAP funding cuts to apply more broadly than just Alaska and Hawaii. Parliament rejected the prior amendment and language which targeted just the two states understandably.
🔵 With the rework the new SNAP provisions are planned to reduce food assistance funding more slowly in about 10 states with the number ultimately being decided by a formula and based on the error rate in delivering food assistance benefits in a year. After an arduous process the amendment was passed and Republican's secured the vote with Murkowski saying it was an agonizing process.
🔵 When speaking with reporters afterwards Murkowski noted that the process was stressful with them operating under an artificial timeline in reference to the pressure Trump put on the Senate to pass the bill.
🔵 Her concern was as follows: “Rather than taking the deliberative approach to good legislating, we rushed to get a product out. This is important. I want to make sure that we’re able to keep in place the tax cuts from the 2017 Jobs Act,” said Murkowski when asked about her support for the bill and why it was hard for her to come around to giving her vote.
🔵 “I struggled mightily with the impact on the most vulnerable in this country when you look to the Medicaid and the SNAP provisions,” said Murkowski. This point highlights just how the effort to push the bill through was met with haste and pressure notably.
🔵 The bill itself is projected to add $2.8 trillion to the federal deficit by 2034. Main reason for that would be thanks to a reduction in revenues as well as interest cost which could have the deficit rise by a potential $5 trillion if some temporary provisions become permanent. Interest payments on the national debt are also expected to increase significantly by 2034.
🔵It should be noted that these numbers and estimates are based on a "current law" baseline and are largely thanks to tax cuts in the bill with Economist having differing opinions on the economic impact of the bill. Time will tell us how estimates go but least to say this is a large turnaround from what many we're expecting with even DOGE's Elon Musk opposing the Bill and forming a new party in strong opposition.
🔵 The tax and spending bill will see spending increase and phase in a cut to Medicaid of an estimated $1 trillion over the next decade with the CBO projecting roughly 11.8 million more American's t hat would become uninsured within the next 10 years compared to the current law. This could lead to many losing healthcare services due to medical cost with states as well likely needing to adjust their own programs and having to take on a larger share of the cost whether that means reducing services or even closing some facilities.
🔵 The bill has many key changes but in summary it solidifies many tax breaks from Trump's first term with an estimated $4.5 trillion in tax cuts alongside tax deductions on tips, overtime and auto loans with deductions for adults that make under $75,000 and a boost to the child tax credit from $2,000 to $2,200 though millions of families at lower income levels would still not receive the full credit as one of the credit's, requirements is a minimum earned income of $2,500. In 2022 alone an estimated 18 million children under age 17 (26 of all children) were ineligible for the full child Tax credit because the family income was not high enough as reported by Columbia University's Center on Poverty and Social Policy.
🔵 To say in the least the new bill has many implications for the country and the next few months and years will definitely represent those changes and how the country shifts and adjusts to this with many having differing opinions understandably. I'll definitely keep you guys posted through it all but definitely a lot to see so much happen so quick and only time will tell and show us just how things play out simply put. The market itself is still continuing within this ascending channel, especially since we got that convergence with the 200 EMA and broke that $6,130 resistance. $6,300 is what I'm expecting resistance to hit the strongest so definitely gonna keep an eye there as traders process the news and changes.
🔵 Have to go but grateful as always for the support, definitely a long idea here but wanted to focus on some important points though the bill itself has so many changes it's hard to go over every one but you get the point. This is a big changes and we'll definitely see things shift a lot over the next few months and years and as always we'll keep posted with things. Thanks as always and all the best.
Best regards,
~ Rock'

HolderStat┆XRPUSD got out of the consolidation areaBYBIT:XRPUSDT is building strength within a wide consolidation range after multiple triangle breakouts. Price is eyeing the 2.60 level, and structure suggests bulls are preparing for the next push.

XRPUSDT BINANCE:XRPUSDT Price broke above the downtrend line but faced resistance at 2.2770 dollars and started correcting. Key supports are at 2.1900 and 2.0800 dollars. If it bounces, resistances to watch are 2.2770, 2.3600, and 2.4620 dollars. Price is currently between key levels.
Key Levels:
Support: 2.1900 – 2.0800
Resistance: 2.2770 – 2.3600 – 2.4620
⚠️Contorl Risk management for trades.

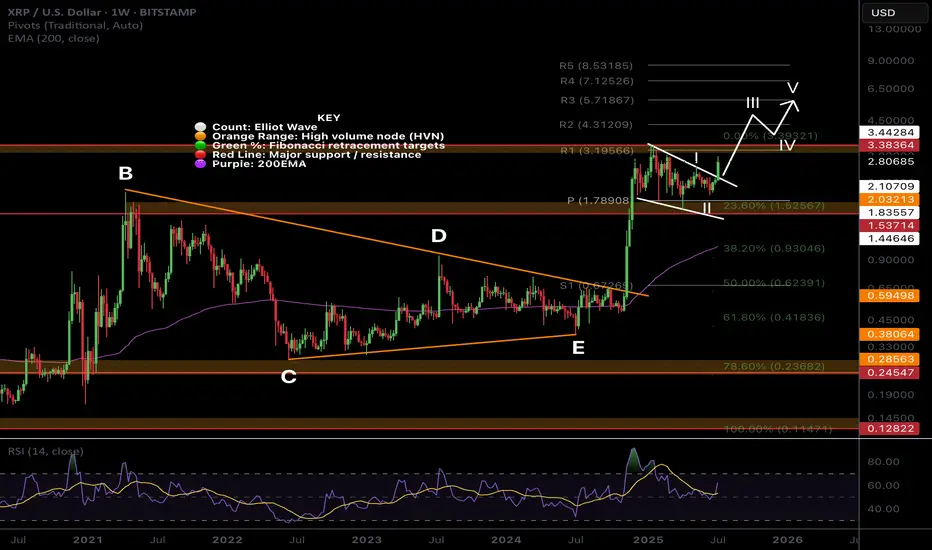
$XRP Bias Change: Bullish Elliot Wave CountCRYPTOCAP:XRP is breaking out the descending resistance causing me to take another look at my WXYXZ corrective Eliot Wave count expecting lower. I have adjusted the count to WXY and a 1-2 new motif wave with a target of $3.8
Price is well above the daily 200EMA and daily pivot after testing both as support including the High Volume Node. Closing above the descending resistance today will be a bullish signal but a retest of that resistance as support before continuing onwards its what to look out for.
Analysis is invalidated below $1.8
Safe Trading

XRPBTC 303% Bullish Wave in the Making (Or Higher)One of the most unique charts in the entire Cryptocurrency market, XRPBTC produced very little retrace after its major late 2024 bullish breakout and recovery. This small retrace is a signal of strength. When prices produce a strong advance but fail to move deep once the advance is over—consolidation happening at high prices—this is one of the strongest signals the market can offer.
XRPBTC started at a low of 674 satoshis in mid-November 2024. The peak happened two months later at 3419 satoshis. Mid January 2025. Now, the retrace lowest point in June was 1928 satoshis. This is 185% higher compared to the November 2024 low, that's what I mean by strength.
The fact that there wasn't strong selling pressure after a 400% bullish wave, signals that participants are ready to hold long-term. And this is a great choice, people are smart. They are holding because they know XRP will continue to grow.
When it comes to Fibonacci retracements, the correction found support right at 0.5. When the market is weak, it tends to move below 0.618 and reach 0.786 or lower before recovering.
The rounded bottom is already in and the candles are starting to curve. Three weeks green, we can expect XRPBTC to produce a new wave of growth. The targets can be found on the chart.
Namaste.
