Something Like ThisI believe the charts are pointing towards the market gearing up for a play somewhat like this.
The timing may well be off, but the levels and sequence seem broadly predictable.
Xrp

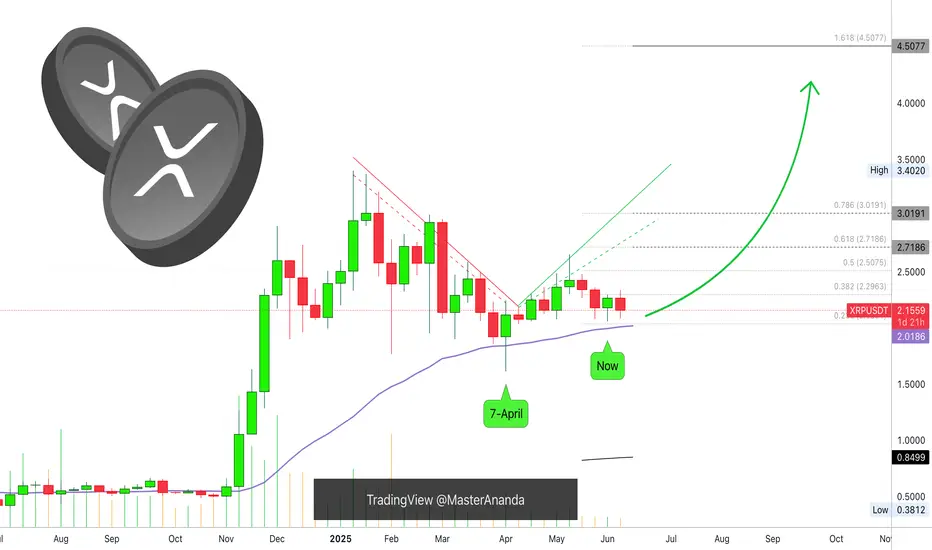
Xrpusd cup and handle targetIf xrp triggers the current bullflag its in on the daily chart it should take price ell above the neckline of the cup and handleshown here on this chart and trigger its breakout as well which has a breakout target around $6.70. *Not financial advice*

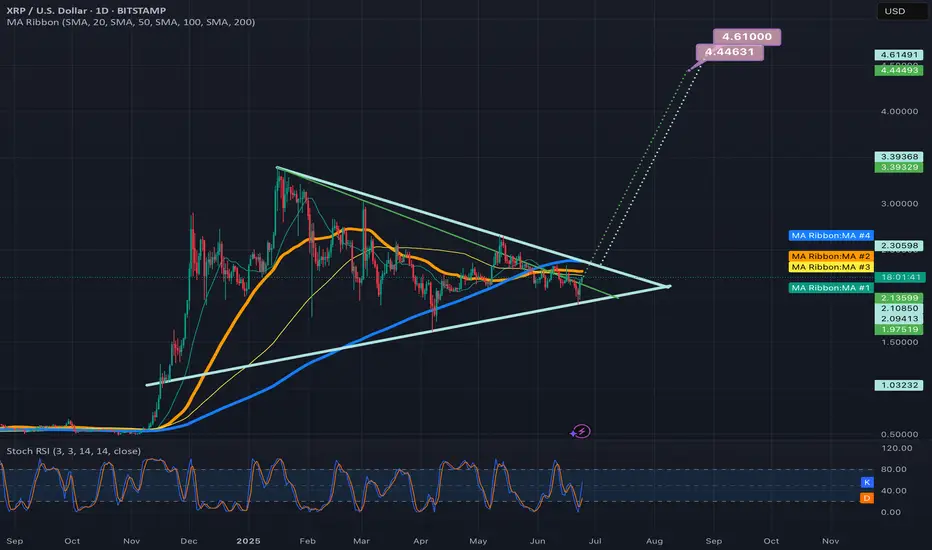
2 potential breakout targets for the symmetrical triangle on xrpDepends on if the green trendline is the more valid top trendline or the light blue one is. *not financial advice*
Get Ready To Load Up For The Upcoming Institutional Altseason! Since the explosive high of $3.40 on Jan 16, 2025 📈, XRP has been sliding inside a persistent downward channel 📉. The trend remains bearish, with bulls struggling to break resistance at every turn.
Today, XRP trades near $2.04, but momentum is weak and the channel shows no signs of reversal yet. If this bearish pressure continues, a drop toward the $1.49 level is on the table—a zone that could offer a textbook buying opportunity for patient bulls! 🛒🔥
🔻 Key Chart Signals:
Downward channel intact since Jan 16, 2025 📆
Lower highs & lower lows dominate the structure 📉
$1.49 is a major support & potential reversal zone 🛑
👀 Strategy: Let the bears do their work. If XRP dips to $1.49, get ready to load up for the upcoming Institutional Altseason! 🚀

XRP M30 Chart Analysis "XRP Short.
Target: 123.01B. Stop: 127.09B.
Let's see if this plays out. 👀
#XRP #CryptoTrading"

XRP road map (Daily)This could be the last chance for Ripple; if the triangle breaks downward, the price could enter a channel below $2.
Best regards CobraVanguard.💚

HolderStat┆XRPUSD correction from the trend lineOKX:XRPUSDT found footing at 2.09 and now grinds beneath descending resistance. Regaining 2.18 should unlock a glide toward 2.25-2.35 inside the larger bull channel, whereas failure to defend 2.05 risks a trip to 1.95 reload territory.

XRPUSDT Forming 2017-Style Flag — Major Breakout Loading! BINANCE:XRPUSDT is currently forming a classic bullish flag pattern, a setup that looks strikingly similar to what we saw back in 2017 before CRYPTOCAP:XRP went on a massive run. The price has been consolidating within a tight range, and this could be the calm before a powerful breakout.
Back in 2017, a similar flag formation led to a parabolic uptrend once the resistance was broken. While history doesn’t repeat exactly, this pattern suggests the potential for a significant upside move if the breakout confirms. Traders and investors should keep a close eye on this structure — a breakout from this flag could reignite bullish momentum and open the door for a sharp rally.
This is a buy and hold scenario for those who believe in XRP’s potential, but remember — risk management is key. Always use a stop loss below the flag support to protect your capital. Momentum could build quickly, so stay alert and watch for volume confirmation on the breakout.

XRP: You Have What it Takes, Success is Yours!It seems XRP has been trading at the same price for more than 7 months. The mean price since XRP broke above $2 back in December 2024.
Can you see what I am referring to? Good if you do.
If you don't, continue reading, everything will be clear in a few seconds.
Price action
Is neutral price action at this point bearish or bullish?
Bullish.
Most of the action has been happening above $2 and this is clearly bullish.
The upswings are bigger than the down-swings.
Buy volume is higher than sell volume.
The main move is an advance that started in November 2024.
The bigger picture and major trend is bullish.
The fundamentals are getting better everyday; there is nothing bearish on this chart.
Where to next?
New all-time high and higher prices.
How to approach the market
Start with 3-5X. When the bullish action is fully confirmed, the market starts to move higher supported by high volume and marketwide wide action, go all-in. That's the only way to win.
Make the winners pay big. Keep the losers small.
If you don't take risk you can't win in this or any other game.
Thanks a lot for your continued support.
Trading tips
Only risk money you can afford to lose and make sure to do a calculated risk. Not crazy risk nor gamblers risk. 2-3X. As the market advances, 3-5X. When the trend is confirmed, go higher and continue to increase until you max everything out. When our target hits sell everything and never look back. You can buy again when there is a crash or a retrace. Opportunities are endless.
If you secure profits and the pair continues to grow; who cares! Buy one that is safe and secure. Buy a new one that is trading low. Don't go back to the same pair just because you won. Detach. Take some time out. Secure profits. Comeback refreshed and the market will bless you with endless opportunities, it is not going away.
Motivation
Just make sure to win-win-win.
If you can win small, you will eventually win big.
Win, win, win. Make a habit of winning.
Go step by step.
Many people overestimate what they can do in a year but underestimate what they can achieve in a decade. Think long-term.
Instead of tomorrow, next week or next month, think how much money you are going to make in a decade if you start preparing now. What if everything you are doing does not need to yield an instant result? Now you can relax your mind. It will all come to you, but let it come, there is no rush.
Even if you hurry, life will continue to give you what you need, what you earned and not what you think is best. Whatever situation you are in right now is the result of past action. Take responsibility and watch everything grow.
Your future can change if you make the right choices today. You can change everything, start now; what can I do today to make my day better? What is the best action to take? Should I go out and get drunk, sniff a bunch of drugs, or, should I exercise and eat clean, do what it takes to reach my goals?
Choose wisely and watch your profits grow.
Whatever results you get when trading is just a reflection of your mind and the choices you make in your day to day live. Belief and take control.
You have what it takes.
Success is yours.
Namaste.

XRP - Straight HorseSight!XRP Vision is quiet clear - The two areas are areas of hold and from this side straight up move can be seen, though slow death move can be seen on the line marked, but its mostly due to liquidity sweeps!

XRP - Trade The Range!Hello TradingView Family / Fellow Traders. This is Richard, also known as theSignalyst.
📈XRP has been trading within a range between $2 and $2.35 in the shape of a flat rising broadening wedge pattern in red.
🏹 The highlighted blue circle is a strong area to look for buy setups as it is the intersection of the green support and lower red trendline acting as a non-horizontal support.
📚 As per my trading style:
As #XRP approaches the blue circle zone, I will be looking for bullish reversal setups (like a double bottom pattern, trendline break , and so on...)
📚 Always follow your trading plan regarding entry, risk management, and trade management.
Good luck!
All Strategies Are Good; If Managed Properly!
~Rich

HolderStat┆XRPUSD reboundBYBIT:XRPUSDT is carving higher lows off 2.03 support through a wedge break, morphing base into bullish momentum. Holding the rising line sustains upside tilt; clearing 2.35 unlocks 2.55 and breakout buzz 🌊

XRP It will grow soon...The XRP chart shows a Triangle pattern, approaching a resistance level at 109k. A breakout above this level could confirm the next bullish target, but watch out for a potential reversal!
Best regards CobraVanguard.💚

xrpusd - fractal from the beginning Everything is fractal: big repeats small, and small repeats big. So if you want to do something big, you start small, then go a little bigger to understand how it works and how forces of nature affect it. As a result, small machines were designed first, then large ones. The same applies to graphs and patterns. Strength lies in simplicity.

XRP 4444 day mega pump/cycleI used geometric progression by cycles to gain a deeper understanding of what is happening on the graph, apart from what can be seen from the fractals. The fact that the graph repeats itself means that it is cyclical. Cyclicality in infinite time is infinite, which means it has no angles. The circle is the only thing in which one thing is known, namely the ratio of the circumference to its diameter, which allows us to extend the graph into the future using the number Pi. This can also be used in our work by applying mirror zones 69 96, calculating them from the circle.
I expect the start of strong growth on day 4444 in this time range and a breakout at zone 4144, followed by a retest with further growth, according to the fractal.
Translated with DeepL.com (free version)

XRP | SHORT CRIPPLE to $2XRP is currently trading BEARISH, since we're seeing a trade right on top of the current support level.
The more times a support level is testes, the weaker it becomes. Therefore, the current support may break and then it's a free-fall to $2.
Additionally, with the price trading UNDER the moving averages in the 4h, we can confirm a bearish sentiment from a technical indicator perspective.
With a fairly tight SL, and a modest TP, the risk is low with this short setup:
___________________
BINANCE:XRPUSDT

XRP Weekly UpdateThe line on the chart stands for EMA34. Notice two things about this level: 1) It was challenged 7-April but the action closed above. 2) The action "now" remains above this level but it has not been tested again, this is a bullish signal.
When it comes to the weekly timeframe, long-term, XRPUSDT continues bullish, with a bullish bias aiming higher. What we are seeing now is consolidation, accumulation, nothing changes and we can expect more growth.
Yes, the market shakes a little bit but this is the classic short-term noise. Zoom out, what do you see? You see just a few candles, red and green, but no change at all. The market is advancing to the side, after this side-advance, it will advance up; a bullish jump.
EMA34 sits at $2.01. We are strongly bullish above this level. We can expect growth in matter of weeks. Can be 1-3 weeks but it can also happen within days.
The retrace was small, consolidation has been going long enough. We are ready to start the next bullish wave.
Namaste.
HolderStat┆XRPUSD narrowing of volatilityCRYPTOCAP:XRP
→ Higher-low ladder pushes into falling-wedge roof
↳ Daily close > 2.40–2.45 = breakout to 2.55–2.65
⇢ Rising base holds at 2.10
⤴ Break < 2.10 opens 2.00–1.95 liquidity pit

#XRPUSDT #4h (Bitget Futures) Descending channel near breakoutRipple just printed a dragonfly doji resting 50MA regained support, looks ready for short-term recovery.
⚡️⚡️ #XRP/USDT ⚡️⚡️
Exchanges: Bitget Futures
Signal Type: Regular (Long)
Leverage: Isolated (8.0X)
Amount: 5.2%
Entry Zone:
2.2438 - 2.2088
Take-Profit Targets:
1) 2.3535
2) 2.4493
3) 2.5450
Stop Targets:
1) 2.1199
Published By: @Zblaba
CRYPTOCAP:XRP BITGET:XRPUSDT.P #4h #Ripple #MadeInUsa xrpl.org
Risk/Reward= 1:1.2 | 1:2.1 | 1:3.0
Expected Profit= +45.7% | +80.1% | +114.5%
Possible Loss= -38.2%
Estimated Gaintime= 1-2 weeks

The Charts Never Lie [Well, almost never]So many reasons to be Bullish on Alts right now.
Historically, BTC will peak first, and then ALTS will have their turn. It looks like they are prime for a run at least to the middle of the range, although why stop there?

XRP Showing Some Weakness But...Here the bearish signals are not as pronounced as they are on Bitcoin or some other pairs which are basically trading near their all-time high, XRP is in a different situation. Still, a lower high is in place and trading volume is really low right now. This low volume always works as a continuation signal, which means it has no value. Whatever the chart is doing that is what is happening for real.
The main high happened 12-May and then a retrace. The lower high happened 9-June but then again today. Today's session wicked higher but it is already full red. Again, the signals are weak but we know the market is all the same. The big cap. projects move together, if Bitcoin goes down, Ethereum goes down, if Ethereum goes down, Cardano goes down, if Cardano goes down XRP is going down, etc. But we can also look at the charts individually.
On the other hand, smaller pairs can be growing strong and thriving, some will grow while others move down, why? Because we are in bull market zone. When the market is bearish, a bear market, Bitcoin goes down and everything follows. When the market is bullish, many can grow while some go down. This is what is happening today.
Wait patiently (SHORT), once support becomes established we can enter again.
We don't know if the market will produce a higher low short-term, vs 5-June or a lower low. But it is wise to secure your position because things can change in a flash. A higher low is possible which would mean a non-event, but, seeing the lower high and the low volume weakness, a market flush is likely to take place.
If we are set to experience new heights in late 2025, the correction must happen now, and with this statement the chart agrees. Down we go. It is still early though for this pair.
We will see how it goes.
Thank you for reading.
Namaste.

XRP's Consolidation with Bullish SignalsXRP has formed a higher low after rebounding from the $2.08 level. This hints at underlying bullish strength, but resistance looms near $2.55 and $2.70, levels that have capped previous rallies.
A breakout above $2.32 could signal renewed momentum, while a drop below $2.27 might test lower support.
The MACD has recently completed a bullish crossover, with the MACD line crossing above the signal line, indicating potential short-term upside. Additionally, the 50 EMA is nearing the 100 EMA, forming a mini-golden cross a pattern often associated with bullish continuation.
Market News:
Several developments are shaping XRP’s outlook. Ripple recently gained regulatory approval from Dubai, a move that could enhance XRP’s adoption and bolster investor confidence. Rumors of a spot XRP ETF, potentially launching in June 2025 with an SEC decision deadline on June 17, are also stirring excitement, approval could drive significant demand. However, the unresolved SEC lawsuit remains a dark cloud.
While Ripple has scored some legal wins, any adverse ruling could spark selling pressure. Regulatory headlines will likely play a pivotal role in XRP’s near-term trajectory.
XRP’s 4H chart presents a cautiously optimistic picture. Technicals lean bullish, with the MACD crossover and EMA alignment suggesting upside potential, especially if $2.32 resistance gives way. Positive catalysts like Dubai’s approval and ETF speculation could fuel gains, possibly targeting $2.55 or higher. That said, the SEC case introduces uncertainty—traders should brace for volatility if legal updates emerge. Key levels to watch: $2.32 for a breakout, $2.27 as near-term support, and $2.08 as a deeper floor.

XRP: Selling Pressure Could Push Price to $2.22FenzoFx—Ripple (XRP) is testing the $2.34 resistance zone, marked as a key level by the Volume Profile Indicator. RSI 14 shows bearish divergence, while the Stochastic oscillator remains in overbought territory, signaling potential selling pressure.
If $2.34 holds, a bearish wave could target $2.26, with further downside to $2.22 if selling pressure persists.
