XRP/USDT BINANCE1D hollow candlesticks
As price moves in the uptrend parallel channel,
we have bullish trend.
Support and Resistance Levels are shown a horizontal lines.
MACD sideways movement.
low volume.
Good Luck
Xrpanalysis

Don't miss the great buy opportunity in XRPUSDTrading suggestion:
. There is a possibility of temporary retracement to suggested support line (0.2139). if so, traders can set orders based on Price Action and expect to reach short-term targets.
Technical analysis:
. XRPUSD is in a range bound and the beginning of uptrend is expected.
.The price is above the 21-Day WEMA which acts as a dynamic support.
. The RSI is at 70.
Take Profits:
TP1= @ 0.24653
TP2= @ 0.28490
TP3= @ 0.34010
SL= Break below S2

XRP Shows Strong Moving Average CrossoverThe tinken-san and kijun-san moving average lines used in the Ichimoku indicator have just made an instant re-cross to the upside, suggesting a possible bull rally due short-term for XRP.

Don't miss the great buy opportunity in XRPUSDTrading suggestion:
. There is a possibility of temporary retracement to suggested support line (0.2698). if so, traders can set orders based on Price Action and expect to reach short-term targets.
Technical analysis:
. XRP/U.S. Dollar is in a uptrend and the Continuation of uptrend is expected.
.The price is above the 21-Day WEMA which acts as a dynamic support.
. The RSI is at 58.
Take Profits:
TP1= @ 0.3400
TP2= @ 0.3790
TP3= @ 0.5095
SL= Break below S2

Ripple may be on the foot of the breakoutRipple forming head & shoulders patter. Volume is right neckline is descending. We wait for the formation of right shoulder to confirm reversal.

Don't miss the great buy opportunity in XRPUSDTrading suggestion:
. There is a possibility of temporary retracement to suggested support line (0.2188). if so, traders can set orders based on Price Action and expect to reach short-term targets.
Technical analysis:
. XRPUSD is in a range bound and the beginning of uptrend is expected.
.The price is above the 21-Day WEMA which acts as a dynamic support.
. The RSI is at 65.
Take Profits:
TP1= @ 0.2521
TP2= @ 0.3278
TP3= @ 0.3785
SL= Break below S2

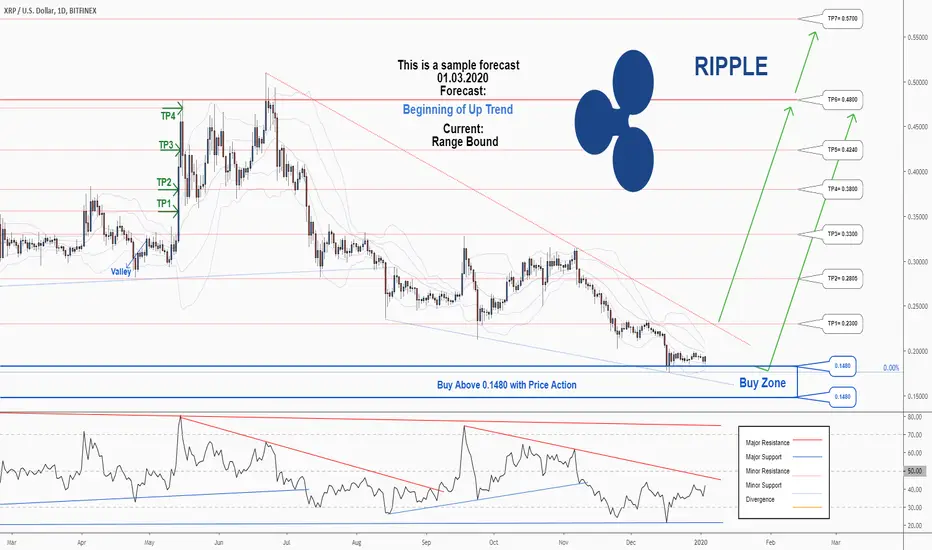
There is a possibility for the beginning of an uptrend in XRPUSDTechnical analysis:
. Ripple/Dollar is in a range bound and the beginning of uptrend is expected.
. The price is below the 21-Day WEMA which acts as a dynamic resistance.
. The RSI is at 42.
Trading suggestion:
. There is a possibility of temporary retracement to suggested support zone (0.18300 to 0.148). if so, traders can set orders based on Price Action and expect to reach short-term targets.
Beginning of entry zone (0.183)
Ending of entry zone (0.148)
Entry signal:
Signal to enter the market occurs when the price comes to " Buy zone " then forms one of the reversal patterns, whether " Bullish Engulfing ", " Hammer " or " Valley " in other words, NO entry signal when the price comes to the zone BUT after any of reversal patterns is formed in the zone. To learn more about " Entry signal " and the special version of our " Price Action " strategy FOLLOW our lessons :
Take Profits:
TP1= @ 0.2300
TP2= @ 0.2805
TP3= @ 0.3300
TP4= @ 0.3800
TP5= @ 0.4240
TP6= @ 0.4800
TP7= @ 0.5700
TP8= @ 0.7615
TP9= @ 0.9145
TP10= @ 1.37050
TP11= Free
Don't miss the great buy opportunity in XRPUSDTrading suggestion:
. There is a possibility of temporary retracement to suggested support line (0.2236). if so, traders can set orders based on Price Action and expect to reach short-term targets.
Technical analysis:
. XRPUSD is in a range bound and the beginning of uptrend is expected.
. The price is below the 21-Day WEMA which acts as a dynamic resistance.
. The RSI is at 34.
Take Profits:
TP1= @ 0.2495
TP2= @ 0.3145
TP3= @ 0.3800
SL= Break below S2

DANGER for XRP TODAY (waves) 19.11.2019For the Ripple price, we are considering a scenario with a fast rise of price in the losal wave (s).
Purchases can be viewed from current levels with take profit of 0.35, and stop loss at 0.22.
In general, the picture changed and the structure for growth was broken.
Expect a decline in the medium term to the level of 0.17.

HOT! Ripple! Update 06.11.2019Hello friends!
Our past trading idea for XRPUSD is relevant.
We are waiting for the completion of the initial wedge model, local correction and the continuation of the fast recovery cycle of the XRPUSD price after long correction.
The mid-term goal is at the level of 1 USD (on a logarithmic scale).
The long-term goal is at the level of 25 USD and higher (on a logarithmic scale).
Subscribe to our TradingView page and stay tuned for analytics from our team.
Thanks for watching, subscribing, commenting and likings.
Good luck to all!

XRP Technical Analysis:3 Things You Must KnowConclusion for today's Ripple Analysis: A close above ~$0.41 implies more bullish action in XRPUSD.
XRP technical analysis for today is carried out on the Daily timeframe using a log scale. Chart patterns are examined, as well as the 200 day moving average plotted to help in providing guidance for future price development.
Three (3) key points to keep in mind moving forward into the week of October 27, 2019 are the following:
(1) Bearish trendline: Peaks in XRPUSD on April 23, 2019, September 21, 2019 and June 22, 2019 are used to draw its bearish trendline that provides a point of reference for price and also context. A close above the bearish trendline can be employed as part of a very conservative strategy to enter long (buy) trades.
(2) 200 Day moving average: This also provides additional evidence for the current bearish swing in the price of Ripple (XRPUSD). The slope of the moving average flattening out (i.e. zero) implies indecision, and therefore requires monitoring for future development of price action.
A change from zero to positive slope is evidence of renewal of bullish strength in Ripple.
Therefore, price closing above the moving average is a good sign for continuation of bullish strength with the next challenge anticipated at the bearish trendline.
(3) Bottoming price action in XRP: August 15, 2019 and September 24, 2019 saw XRP fail to follow through with its bearish momentum and a lack of price close below ~0.22. The most recent test close to the 0.22 price level occurred on October 23, 2019 with price eventually resolving to the upside. A bullish swing in price is therefore implied, while price closing below ~0.24 diminishes the chances of higher prices.

HOT! Ripple (medium-terms perspectives)! 25.10.2019Hey!
Today, our fund will publish reports on current returns of asset management, as well as delight our clients of good profits.
Considering the medium-term prospect of Ripple prices, we recommend buying from current price levels with a hold position of up to $ 1 per coin.
With a successful set of circumstances, the rally of bulls can continue with the achievement of the most significant prices levels.
In the long run, there is a high probability of the end of the stage of long accumulation of positions by a market maker and funds.
The wave model also indicates a high probability of the beginning of a rapid exit of the price from the wedge.
The analysis used a logarithmic measurement scale, various methods for calculating volume dispersion, wave models, graphic models, and behavioral factors.
We recommend paying attention to the coin in the medium and long term right now.

XRPUSD SHORT Broke Major Support as all othe CryptosHello
right now we ahve a massive trendchnage in the Crypto
aerea,
All Cryptos are SHORT now and all have broken their
major support lines.
I have in shorttime just updates here XRP and
its easy to see what has happened, its now needed
to add more

XRP 4H TF ascending channel part2From the previous article, XRP forms a 4H TF ascending channel.
The previous article mentioned that XRP tries to break through the weekly resistance, and failed. XRP comes to the lower edge of the ascending channel.
It is also the lowest edge of the EMA ribbon. Getting support at the meet-up point of trend line and Ema ribbon, where we have recommended to open a long position there, and until today's profit on spot is about 6%.
Pay close attention to the 4H Fibonacci 1.382 0.31350, it can be the short-term goal, which may encounter the upper trend line resistance of the ascending channel.
After breakthrough the resistance of the trend line, the long-term target can be the weekly Fibonacci 0.382 0.32887, where is also the 4H Fibonacci resistance 1.618, we may encounter a strong rebound, pay close attention to whether there is a reversal pattern appear or not.
The recent event to watch, now is Ripple's annual Swell conference, held on November 7-8 this year.
The past history, there was a wave of rising prices in the two to three weeks before the Swell conference will be held.
This year is the third Swell conference. In the past the Swell 2017 conference, XRP price has risen by 64%.
In the half month before Swell 2018, XRP has risen by 115%.
Now it is already three weeks before this year's Swell conference.
Please pay close attention to the XRP trend in the next three weeks and have the opportunity to drive a new wave of bull markets of XRP.

XRP 4H TF ascending channelAfter XRP dropped sharply after 9/25, it continues to form an ascending channel.
At an earlier time, today XRP broke through the weekly Fibonacci resistance 0.236 0.28312, and failed to break the weekly pressure of 0.236.
After that, XRP will have the opportunity to come to the support of the 4H Fibonacci 0.786 0.27328, and try to break after the consolidation.
Back to the 4H Fibonacci 0.786 level, also in the trend line below the channel, there will be two scenarios.
Scenario 1: Go straight to break the weekly pressure and break through the ascending channel upper trend line.
It is recommended that investors can set up a long position if XRP break through the weekly Fibonacci 0.236 resistance.
Scenario 2: After a period of consolidation, down break the ascending channel and complete the daily TF W-bottom pattern.
If there is reverse pattern coming out with no lower-low, the support is between the 4H Fibonacci 0.236 and 0.382.
It is recommended to enter long position In the green box.
The recent event to watch, now is Ripple's annual Swell conference, held on November 7-8 this year.
The past history, there was a wave of rising prices in the two to three weeks before the Swell conference will be held.
This year is the third Swell conference. In the past the Swell 2017 conference, XRP price has risen by 64%.
In the half month before Swell 2018, XRP has risen by 115%.
Now it is already three weeks before this year's Swell conference.
Please pay close attention to the XRP trend in the next three weeks and have the opportunity to drive a new wave of bull markets of XRP.

XRP is fight to Remain near supportThe money experience the break underneath the half lie retracement level of the last forward move from the low of $0.2352 and high of $0.261, around then the cash's worth was analyzing the significant help level of $0.2450 and hourly SMA of 100. In addition, 61.8% Fibonacci retracement level of the money last forward from the low of $2352 to a high of $0.2618 is offering the help to the cash.
The specialists are anticipating that the cash's worth is diminishing today and it is probably going to go beneath the key help level of $0.2450. They are likewise anticipating that it could further go down near the help level of $0.2350. There is a help level present at the estimation of $0.2420 and the 76.4% Fibonacci retracement level of the last above move from the low of $0.2352 to a high of $0.2618.
News Source: TheCoinRepublic

XRP Bulls trading sideways1-hour XRP/USD Value Chart: XRP is exchanging the level channel and the worth is halting at both long position and misfortunes for the present moment. The following opposition level lies the estimation of $0.25100 and it is normal that the money will soon retest the worth. On the off chance that the money breaks out the estimation of $0.25100, at that point the following objective or the opposition level is at the estimation of $0.2600.
Then again, in the event that the bearish weight again put the incentive down underneath the $0.24, at that point the money will demand the help level of $0.23400 and further, it could reach up to $0.2300. It will go further to discover the stop misfortunes at the low degree of the exchanging channel and furthermore go upward to discover the obstruction.
News Source : TheCoinRepublic

XRP Continue to Struggle at $0.23
Priorly, Ripple dipped under $0.2650 bolster line and kept falling underneath the $0.22501 bolster line also against the USD. It contacted close $0.2062 USD and the value switched and began to climb upwards. It handled the obstruction levels at $0.2250 and $0.2300 and now swell has territorialized the $0.2300 mark as its new help base.
In any case, it is seen that swell has protections at $0.2450 and $0.2500, swell could move until $0.02550 or $0.2650, at that point it would fall down the obstruction at $0.2440 demonstrating a bearish conduct. $0.2244 was the low imprint before Ripple moved back, it moved over the $0.2350 obstruction level.
News Source : TheCoinRepublic

XRP Analysis: Downtrend (Sell Off) Not Yet Complete? Conclusion for today’s XRP technical analysis: Price closing above 0.29237 implies resumption of bullish strength in Ripple (XRP).
XRP chart analysis for today is carried out using a log scale on the 6 hour timeframe. June 22, 2019 price peak of ~0.51 and the downturn in price is highlighted using a bearish trendline. The July 6, 2019 crossover of the 50 moving average (MA) below the 200 moving average (MA) also provided additional bearish bias and sell off.
Formation of a symmetrical triangle between July 16, 2019 and August 6, 2019 was part of the move to the downside with confirmation of the pattern on August 7, 2019.
Another symmetrical triangle that formed between August 14, 2019 and September 6, 2019 was confirmed with an upside breakout on September 7, 2019. However, there has been a lack of follow through in bullish momentum following a breakout from the pattern, suggesting that another leg of bearish action is a possibility in Ripple (XRP).
Current support for XRP lies between 0.23630 and 0.24547. A break below the lower boundary implies lower prices to follow. Current reflex point that is considered to provide a sustainable bullish momentum is when price closes above ~ 0.29237 and above its 200 moving average.
Added confirmation and/or bullish bias also involve a bullish crossover of the 50 moving average above the 200 moving average (MA).


First Breakout Confirmed. Second Is Right Around The Corner.XRP has broke out of the falling wedge and has been in an uptrend since August 9th. The next MAJOR resistance is the thick red line. This resistance dates back to the ATH. The MACD on the 1D has flipped bullish and is so close to flipping bullish on the 1W. (Look at my previous analysis for that. RSI is about to flip above 50, which is bullish as well. If price can break through this upper resistance we will see some real fireworks! First target is a 2X. It is definitely worth owning some XRP right now just in case of a breakout since this coin can run wild.
*This is not financial advice. I am not responsible for any losses of money.*
