XRP IS GOING TO $0.29 (£0.24p)- WOW haha this market is volatile.... I am still BULLISH!
- Guys please don't FOMO in unless your HAPPY for your portfolio to go down further and not react emotionally.
- Always invest what your willing to lose!
- STAY level headed, go to the gym, eat healthy, talk to people communicate, please don't let this market affect your mental health!
Xrpanalysis

XRP forecast - how to trade in a falling market?For 7 weeks in a row, the price of XRP has been falling steadily. Unfortunately, we couldn't find a more positive start to our forecast. The sellers managed to break through the global range of $0.55 . So far, the breakdown of this range can be fixed on the daily timeframe. Weekly candle has not closed yet. Taking into account the breakdown of the global critical point of $0.55, buyers can be more active and start a rebound to the level of $0.80.
However for such a scenario to occur it is necessary:
1) Close the weekly candle above $0.57
2) Not to allow the sellers to renew the local low during the trading week of May 16.
Only after these conditions are met, it is possible to buy XRP with low risks with the final target of $0.80 . However even in such trading situation stop order should be placed below $0.47.
The prospect of XRP falling as low as $0.24. How the price can reach this mark (slowly or LUNA) is unknown. It should be understood that the cryptocurrency market is not in the state that you need to risk your deposit for long-term positions now. There should be a separate deposit for such trading.
There is no light at the end of the tunnel in the XRP market on the daily timeframe.
The sellers confidently broke through the $0.55 range on May 9. The breakdown was on high volumes. On the same volumes, the buyers began to form a rebound. However the daily candle of May 10 was no competition. This fact shows that the sellers are very strong at the moment. Even if the XRP gets to $0.55-$0.58 , that will be the last target before the new wave of decline begins. That's why if we look for long position in XRP cryptocurrency, we should go 8-10% up with a short stop order.
It will be clear from what the next wave of decline looks like whether the sellers are exhausted or not. If the sellers have a harder time renewing the local lows, with trading volumes increasing, we expect a medium-term bounce of the XRP price from $0.43. That is the range where we will look to buy XRP in the medium term. However, we do not place limit orders, as it is important to see the dynamics of price movement in the range of $0.55-0.43.
The importance of the current critical point in the XRP market is underscored by the weekly chart of XRPBTC price movement:
The chart shows that the critical point (base 0.000015) is under buyer control. If this range is held during May, buyers will have a very high chance of starting a new wave of growth without sinking the cryptocurrency into a global bottom.
In addition, the price of BTC has not yet broken through the main range of $29,000 and may start a new local wave of growth within the global consolidation (29,000-60,000).
We posted our long-term bitcoin forecast about this recently:
However, if on the weekly timeframe of XRPBTC we see that the price consolidates below 0.000015 - we should run away from XRP market for a long time. In that case, the minimum downside target is 30%.
The conclusions of our forecast:
1) For spot trade in intermediate-term range we should expect either fixing of the price above $0.55 or test of $0.43 (conditions of price movement in the range of $0.55-0.43 should be met)
2) At the moment of forecast writing we may consider a short-term long position till $0.55 (counter-trend agreement with a stop order lower than $0.48)
3) The probability of XRP falling to $0.24 is quite high in the long term. This scenario will become relevant if buyers fail to take control of the $0.55 range after starting to bounce back from $0.43.
Be careful when trading a highly volatile falling market . In case of little experience, in such a market the main task is to save the deposit!

XRP SUPPORT LEVEL MET, KNOW WHAT ?- Keep it simple we either break below and head further down and cause extreme fear for a couple weeks, followed by a massive pump.
- If your a clever investor, you will NOT react EMOTIONALLY!
- EMOTIONAL investors LOSE MONEY / SMART INVESTORS WHO de-tach their emotions from their investments always win!

XRP IS A TICKING TIME BOMB!- Understand the use case and what XRP is designed to do.
- The new FINANCIAL SYSTEM IS READY AND SET BY 2025 NOVEMBER
- The Utility BULRUN will begin after 2025+ (That's just my opinion

Powerful impulse of XRP price movement soonToday we bring to your attention the global schedule XRPUSDT
Roughly speaking, last 12 month, the price of XRPUSD in broad consolidation.
The main question is whether the consolidation will continue in the form of a triangle or the price XRP will update the lows to $0.44 and move in the form of a channel.
After today's sharp fall in the cryptocurrency market, the price of Ripple is at an interest point, where you can get a good medium-term trade.
Entrance to the position in the area of $0.59
Stop below $0.55 (-5% of entry point)
Take profit around $0.77-0.80 (+ 30% of entry point)
Profit / loss ratio 6/1
_______________________________
Since 2016 , we have been analyzing and trading the cryptocurrency market.
We transform our knowledge, trading moods and experience into ideas. Each "like under the idea" boosts the level of our happiness by 0.05%. If we help you to be calmer and richer — help us to be happier :)

XRP COULD DROP FURTHER!- I look at this crypto market on a long term scale, however in the short term I do believe a shake out is coming, some sort of negative news will send the overall crypto market down, but remember when there's blood on the streets you buy the DIP!
- RULE NUMBER 1: Only invest what your willing to lose
- RULE NUMBER 2: Always DOLLAR COST AVERGAE in your positions in crypto
- RULE NUMBER 3: Never be emotionally attached to your crypto wallet/portfolio

#XRP/USDT 1HOUR UPDATE BY SANDERS!Hello, welcome to this XRP/USDT 1Hr chart update by CRYPTOSANDERS.
I have tried my best to bring the best possible outcome to this chart.
Show some support do hit the like button, follow and comment in the comment section. this motivates me to bring this kind of chart analysis on regular basis.
CHART ANALYSIS:-
In the above-mentioned chart, it is evident that BNB is trading inside the channel pattern for many days and bounced four times from the lower trend line support and following the mid support trend line.
In the current scenario, XRP broke the channel pattern and currently retesting an upper trend line which is the signal or confirmation for some % gain that can be seen in the upcoming hour.
If breaks down the upper trend line and moves back inside the channel then the mid support trend line will be the must hold support zone.
Mid-trend line break will be the invalidation of this chart.
This is not a piece of financial advice.
Sorry for my English it is not my native language.
Do hit the like button if you like it and share your charts in the comments section.
thank you.

XRP COULD BOUNCE BACK UP!-- As you can see XRP previously broke out of the trend line when XRP got sued by the SEC.
- We may see another break out and close and then a massive upside.

XRP BROKE & CLOSED TO THE DOWNSIDE!- As you can see we have broken out of the daily triangle pattern to the downside and a couple candles have closed outside the triangular pattern.
- This could mean a further drop for XRP, but if you know what you hold, you will keep holding and DCA (DOLLAR COST AVERAGE) into XRP on a monthly basis.
- NOT FINANCIAL ADVICE!

XRP DAILY ANALYSIS!!- As we can see thw 50/100 EMA crossed to the downside and now are crossing back to the upside....so lets wait and see if the market recovers or keeps dropping.

XRP DAILY ANALYSIS!!- As I mentioned in my previous posts we could see XRP move lower, It could potentially break to the downside like it did before and then continue up!
- Or we could see a last shake out to $0.30 before we continue higher.

XRP DAILY ANALYSIS!!- Hey everyone as I mentioned XRP will most likely touch $.68/0.70 before we continue upwards.

XRP DAILY ANALYSIS!!- As you can see the 50 / 100 Moving Average have crossed over to the downside, we could hit the support level around $0.70 before we continue consolidating within the $0.70 - $0.80 range.
-

XRP DAILY ANALYSIS!!- XRP could retest is previous SUPPORT LEVELS before it takes off!
- Always be ready for anything, markets are volatile and unstable atm, but once regulations kick in a lot of nonsense cryptos will die and the markets will be a little more stable.

JUNE XRP SHOULD BREAK OUT!- XRP may consolidate up and down in this weekly chart triangle, but once this lawsuit is over and the triangle pattern ends we could see a massive breakout!

XRP Analysis (Start the Uptrend)Hi guys ...
| After checking the Ripple chart:
- The downtrend of Ripple is over!
- The best point to buy was the price of 0.663
But now that the price of bitcoin has dropped, Ripple has the opportunity to buy again!
Let's go to raise the price 🚀
Thanks :)

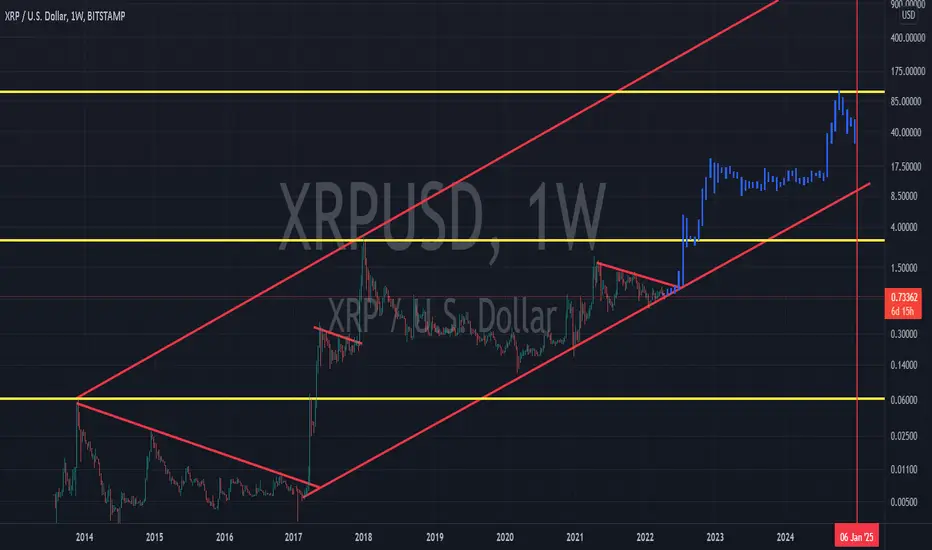
XRP DAILY ANALYSIS!!- As you can see we are still within the long term trend.....XRP has stuck to this trend line so perfectly.
- Once this case is over we could see XRP reach around $90 (£70) before 2025!
- Just a quick reminder, TESLA went up after the lawsuit by 3,200% within 3 years!
- My message here is that don't expect XRP to fly to 2-3 digits straight away, it could take some time, just hold, accumulate more and HODL!
XRP DAILY ANALYSIS!!- Hello everyone, hope your all having an amazing weekend so far!
- As you can see we broke out of the small triangle that XRP has formed.
- This happened before aswell and then we shot right back up, there is way too much utility and upside for RIPPPLE as a company, we will see a breakout soon guys.
- HODL STRONG and keep stacking your bags!
- NOT FINANCIAL ADVICE!

XRP longXRP broke trough off the upper boundary of descending channel. Bullish movement to support level at 0.9 is expected to happen.

XRP DAILY ANALYSIS!!- As you can see XRP is still consolidating, once the lawsuit is over, whether XRP WINS OR LOOSES, the price will still go up, take KIN coin into consideration, they got sued by the SEC, lose the case, was fined around $5 million dollars, was deemed a security and the price still shot up around 17,000% within 3 years!

XRP DAILY ANALYSIS!!- As you can see we potentially could be sitting inside this trend, remember everyone the markets don't move your way, so be prepared for anything to happen, this is crypto haha.
- Long term I do see double digits, but lets see how bitcoin performs as its the leader in this BULLRUN!
- Also XRP under $1 is always a bargain :D
- NOT FINANCIAL ADVICE!

XRP DAILY ANALYSIS!!- Hope you all are having a wonderful weekend :D
- As you can see on the daily time frame XRP broke to the downside and now is consolidating between the yellow Support and Resistance lines.
- We could potentially touch the $0.60 before a breakout to the upside!

XRP BREAKS BELOW SUPPORT A LOT!- XRP is a volatile asset, but where there is volatility there is reward
- As you can see XRP has always broke below the support levels and caused scarcity within the markets
- We could potentially see something like this again, so be prepared
