Xrparmy

XRP USD soon the pump - Elliott wave analysisWe are finishing our WXY correction of wave 1. Target in bold green on the chart, it will be followed by a wave 3 and a big pump, be ready. I would long XRP at this target and place a stop just under, so that the R:R is quite high. if the price goes under the beginning of wave 1, the scenario is invalidated and it means that wave 1 is in fact a corrective wave.
Happy trading!!!
#xrp
#xrpusd
#xrparmy

Patience Will Pay Off For XRP HodlersPatience is a virtue, XRP hodlers understand that statement. XRP has been in a massive downtrend since January of 2018 and no amount of news or announcements has been able to break it out of the downtrend. BUT, it has been in a slight uptrend since mid August 2018! XRP is strong, fundamentally speaking, and I believe it will continue to be a Top 3 blue chip cryptocurrency. I have marked my first 4 price targets with my fifth (T5) being a return to its weekly ATH close at $2.76 (800% increase). It's time to start buying small amounts of XRP until the downtrend is broken. You're never going to time the bottom of a stock or coin, that's why DCA is so helpful, especially when prices are this low. Everyone is scared to buy XRP and that's the time to buy. When XRP runs, it runs fast and hard, don't get left behind because of greed for a lower price.

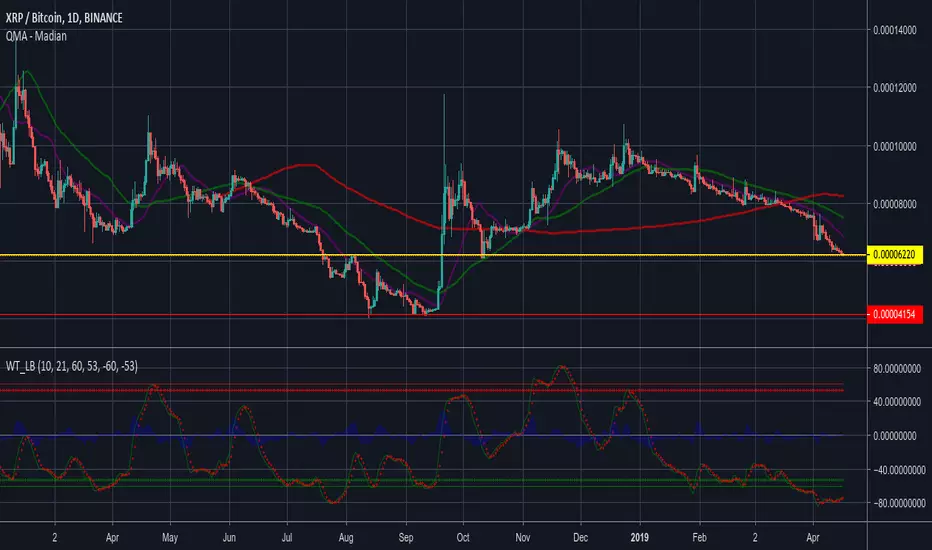
There Is Hope For XRP To Reverse!XRP/BTC has looked extremely bearish in 2019 but a reversal could be on the way soon. A falling wedge is forming on the weekly chart. The bottom of the wedge appears to end right in the buy zone (a full retracement of price in Dec. 2017). The top of the zone starts ar 2300 sats and ends around 1500 sats. If price breaks below that, who knows how low this can go.
I see a reversal coming due to the price decrease combined with decrease in volume as well as the reversal on the MACD. If BTC doesn't go on a ridiculous run, we could see MASSIVE gains from XRP.
*THIS IS NOT FINANCIAL ADVICE. I AM NOT RESPONSIBLE FOR ANY LOSSES OF MONEY*

XRP heading for 40cents - First target is 37centsWe've broken to the positive on the symmetrical triangle pattern and we are seeing good volume. My target is 37cents. Volume is significant right now so I think we will see 35cents very soon, some consolidation at this resistance level and with enough volume a push back up to 37cents in the short-term.

XRP/BTC to ZeroNot advice for your financials, only for entertainment, my opinion.
A few months ago I made an XRPBTC Chart that had a little bit of potential and optimism, but even to my surprise it sunk below 3850 sats significantly into the mid 2000s. Even with Ripple announcing slower dumps on the market, I think it's too little too late and enough people have realized it for the scam that it is. XRP ultimately will not be useful or necessary for international banking or anything else other than pumping Ripples pockets until someone can prove it was illegal. Even then the fine will be nothing compared to what they've stolen from you.
If your coin isn't decentralized, it's poopoo.
This chart is a bit of a meme, but maybe this is the curve that no one else is looking at. A curve perpetually averaging out to zero, which is what XRP is intrinsically worth.
Thanks for coming to my TEDx Talk.
Buy bitcoin you fools.

xrp game planlooking at the day chart we have momentum today but only bullish if we break above the descending channel imho since its nearly a month long of declining lasting 25 days now as of writing. .. its the safest trade also from a traders perspective. xrp to me will have to close above .37 cents which would also close above the 50 & 200 MAs before i make a big trade.


XRPBTC The Last Hope ! (40 Bar Rule !)Hello XRP army ;D
I think this week is the last hope of XRP to jump,,
If we look at weekly chart and by some interpolation,
I found that XRP cycle start every 40 Bar (Weekly) or 280 Bar (Daily),
MACD indicator agree with me as explained on the chart,
I think this week -or next- is the last hope for XRP !
Targets on the chart:
40%
67%
92%
120%
There is some diffirent in prices because of so many exchanges
Enty: 0.00003500 or below


XRP Weekly, Time to Moon!No Just Kidding. XRP and Ripple technology is primarily used in banking and money transfers. Banking does not want volatility here. XRP needs to maintain slow steady gains, and tries to stay as stable as possible. When everyone was looking for "the next bitcoin" and flooded the xrp market with speculation, sure it pumped well and a few people made out while dumping it on their cult followers. It's be consolidating back to it's ideal range between 30 and 50 cents ever since. It's important to know company fundamentals and purposes of the coin before throwing money at it. Plenty of alts worth getting into for currency speculation. Take that $100 and put it in bitcoin. Even if you bought every week since the top, you'd be in a better position.
Any way,
this is not financial advise, this is for entertainment purposes only.

we still on track compared to last analysis. buckle up XRP armynot much to say here. dbl bottom is forming nicely as expected from last analysis and great volume today. im looking for big upward movement to start after daily close (UTC time frame) within the first 2-4 hrs. all that needs to happen is a break above the downtrend. this move out of the dbl bottom will definitely hit $.80 if it shoots up with a parabolic move imho...

double bottomxrp formed a double bottom on the hour. should push us back above .45500 range once complete

XRPUSD FORGET A GOLDEN CROSS, TAKE A CLOSER LOOK AT THE CHART.Over the last few days there has been a lot of hype about a "golden cross" and now a "cup and handle". While these indicators do exist in the world of TA, they are not used as much as people think they are. Looking at pure price action and retracement levels, you can see a clear breakdown of what is happening. On a larger scale, price has held the 61.8 level while at the same time holding intraday 61.8 level again. I remember using the "Golden Cross" indicator around 7 years ago and soon realized that it is not an end all be all technical indicator as well as MACDs or RSIs and even cups of tea with handles. Focus on price action and not silly indicators to get a closer look at what price is telling you. I am still BULLISH on XRP. Let's keep all the silly $5 price predictions overnight down a bit yea?Cheers!

BTC - Major overhead resistance!BTC, despite all odds, continues to push onward and upward. Be careful... we just ran into major overhead resistance @ the $6100 level. I think a reversal is coming, perhaps to the bottom of the upward trend channel, in light blue. However, there is always the chance that BTC could continue to rally all the way to the angular resistance (white line) and thus be rejected from there. This would be mark a 100% retrace from the November lows, but a major selloff would ensue, probably taking BTC back down to the ~61.8 level. The RSI also looks exhausted and is flirting with oversold territory. We did have a golden cross at the end of April, however a fractal from the 2015 bear market similarly indicates that there is a strong possibility of rejection from the "major overhead resistance" zone.
Pullback is likely. We havent even begun to unravel the Tether/Bitfinex scandal. BCH is looking scammy as well w/ over 50% of recorded transactions coming from one address for the entire last month. None of this is good for the cryptospace.

XRP Army is ready...Buy Area = Above 28 cent.
TP-1 = 34,8 cent (will be next stop p.)
TP-2 = 44 cent
TP-3 = 55 cent

XRP FractalXRP has printed an interesting fractal. It looks like were going to continue to test 0.30-0.34 cents, where XRP is very stable, until we either break up or down out of the triangle continuation pattern. This similarities in movement are pretty staggering when represented by the various shapes. We can only expect the pattern to continue based on the available chart information.

XRPBTC bullish scenario #xrparmy will come and play this setup 100%, they are already buying xrp. This is can be the bottom of wave 2, whoever is buying from here to 5600 satoshi will make nice $$. I know I've bought some xrp at this level. Remeber, this is a long term play, not going to up at the previous high overnight, let it play 1month or 2.
Good luck!

XRP is dommed.Xrp is not looking good and if it doesn't held it's support level around 6150 then we might see a new lows about 4151 . In moving average we saw a death cross also beaish TK cross below kumo cloud indicating us we might see new lows, but only is this current level breaks also many indicators are showing oversold position. Watch carefully this level and then if this level holds then buy it otherwise sell your bags, to buy back cheaper. And no xrp is not going to $589 :).

XRP Bullish trend cross on 4H QRsi, long TF's signal *a move*XRP is getting tighter, and as much as I fundamentally dislike the coin, I will trade it.
There is a bullish trend cross on the 4H QRsi. First target is ~2.15% up from here. SL is ~ 1.25% down.
There is a good chance of continuation here, this trade might be worth holding.

Waiting for volume - very little riskXRP is ready to GO - but volume will dictate when. If we get volume in next few days the breakout will be nice. Golden cross on 100/50 already happened, 200/50 is closing in. For the record, I dislike XRP unless profit
