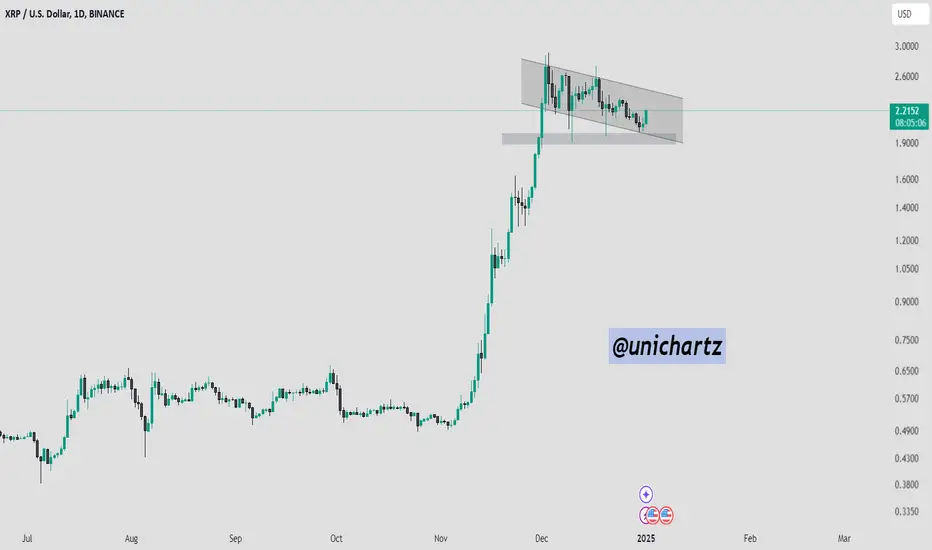
XRP Price Prediction: Breakout Above $2.25 or Further Downside?The XRP/USDT chart is displaying a descending channel following its impressive rally. The price action is consolidating, respecting both the upper and lower boundaries of the channel.
The support zone around $1.89 to $1.98, as previously highlighted, remains intact.
DYOR, NFA
Xrpbreakout
XRPUSDWe will see a boost towards the uptrend. we have retest the level. be patience and you will be happy with the result. my upside target is 5$ by the end of the January or maybe more then 8 to 10$.

Feast your eyes on THE XRP MOON CHART!I've seen a metric ton of charts explaining why XRP is going to break out soon and run to new all-time highs, but I think this chart is the single most compelling chart of them all!
This is the 3-month chart, and although it doesn't provide us with an accurate breakout date, it does present a solid pattern that has been exhibited in the current wedge formation numerous times.
In the previous wedge, a drop below the trendline signaled a massive run up to the top trendline. From the previous wedge to the current wedge, and within that same wedge, each time the price dropped below the lower wedge trendline, it appreciated greatly, significantly piercing the top trendline area.
The current 3-month candle has dropped below the current wedge trendline, signaling another period of significant price appreciation to come. Since the current candle is very near the end of the wedge, it will most likely be the final appreciation period of the current pattern, not only piercing the upper trendline but also appreciating to the point that it establishes the beginning of a whole new, much higher-priced wedge in the process.
In the coming months, I believe there will come a point where XRP investors and spectators alike will all be picking their jaws up off the floor! If this plays out, it’s going to be incredible!
Enjoy the ride! It’s not getting to the top of the mountain that counts; it’s the journey that got you there that you will remember!
Good luck, and always use a stop loss!

The roadmap to $365 XRP in the next two years.If the fractal pattern in XRP continues, you can expect to see something similar to the following.
Many will enjoy counting their MILLIONS, but others will be counting BILLIONS!
Enjoy the ride!

Breakout confirmed, retest supported!We've retested the support after initial break up from the downside, and I expect a little bit of action back upwards and still furthermore sideways action heading towards New Years. 55 cents averages before the pump!

Bull flag break sideways?It appears we've broken a clear sideways out of this flag structure. We did see a false breakdown and immediate break to the upside before heading out sideways. Still moreover a bullish outcome than a bearish. We may see some sideways action before continuing more higher.

Early breakout??It looks like Xrp has had an early breakout upwards. Anyone else think so? 🤔
If this is the case, expect over 60+ cents minimum Xrp in the next run up.

We've come to the end.. bull rally incoming!!It seems we've come to the end of an apparent small frame fractal. It is a fractal that is a higher high fractal. And now we're onto a new frame that I believe most likely will go higher into a possible breach and into a breakout causing a bullrun for Xrp! 😀 Let's hope it's finally here!!! 🚀🥳

XRP must break UP or DOWN!!!! ↕️Xrp is now being tight squeezed! Something BIG incoming!
This is also a huge falling wedge and a falling wedge is more so likely a bullish scenario as the sellers lose selling pressure.
If Xrp breaks up through this falling wedge we could see huge potential gains for the XRP Community 💪
Brad Garlinghouse said it just the other day that he believes the SEC lawsuit will end early 2023. This most definitely coincides with this bullish falling wedge scenario. A catalyst for Xrp to reach all time highs!
Strong bullish longterm resistance begins @ 0.34 usd!!
It's all playing out nicely! Make sure to buy up before this breaks!!! 🚀🚀🚀🚀🚀🚀🚀🥳🥳🥳🥳🥳🥳🥳

xrp Break outyestersay i said we would see a break out and seams its happening.
this is the 5th Leg of elliot.
next step 2$

XRP/USDT 4HOUR UPDATEWelcome to this quick xrp/usdt analysis.
I have tried my best to bring the best possible outcome me in this chart.
Reason of trade :-xrp/usdt is bullish falling wedge retest conform
Entry:- cmp and buy the dip
Traget:- 5% to 10%
Stoploss:- $1.10
Remember:-This is not a piece of financial advice. All investment made by me is under my own risk and I am held responsible for my own profit and losses. So, do your own research before investing in this trade.
Happy trading.
Sorry for my English it is not my native languages.
Do hit the like button if you like it and share your charts in the comments section.
Thank you...

XRP - Spike incoming?XRP has a history, at least since July 2020, of explosive runs after the 1D 20MA crosses above the 1D 50MA, and it usually begins from a relatively high position on the RSI between 50 and 60 and the MACD MAs above the zero line.
In the case of the most recent cross, it occurred with the RSI at 59 and the MACD MAs above the zero line, so this current structure, if I can call this current confluence of factors a structure, is completely consistent with past price spikes. These spikes have resulted in gains from 73% to 260% from the time when the event occurred.
Could we be seeing a similar breakout occur now?
Let me know what you think.

XRP/USDT xrp neutralXRPUSDT
Friends, we are witnessing the fall of Ripple, right up to the area where
We considered it as support in previous analyzes
Now for wanting to resume its uptrend
He must break the resistance line upwards
And for the shorts position is enough that the price range is low
If the blue color closes, the currency trend will decrease

xrp can go up and gain 50% xrp broke out the rectangle from up now if xrp back to rectangle it can break out it again but it take time
otherwise if xrp don't back to rectngle it can have sharp profit

XRPBTC BULLPEN OPEN!!No oped on this one -- figured I'd keep it short & sweet. Head & Shoulders indicator coupled with massive volume surge led me to dig futher.
Green Horizontals represent TP1-3 with TP3 a midterm sweep.
Red horizontal worst-case stop.
Markt VOLATILITY: HIGH
Keeping this publication NEUTRAL as next move is contingent on BTC price volatility.
Risk/Reward: 25/75
BB / KC / VOL / Sqz & RSI all seem to bolster this bullish breakout (long overdue IMHO) as XRPBTC has been looming around trading sideways since the middle of last quarter.
Peace & Love all
@A1mtarabichi

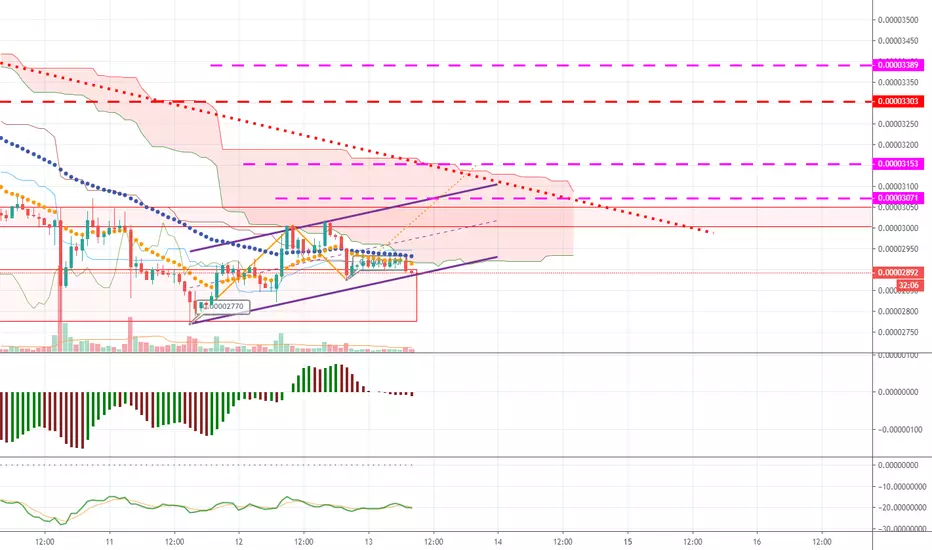
XRPBTC formed bullish BAT pattern for another bullish moveHi folks hope you are doing good, in my previous idea of Ripple with Bitcoin pair we have seen that the XRP had formed a complete bullish BAT pattern and on 2 day chart. The formation of that pattern was started on 6th September 2019 and completed in December 2019 and we have seen that on 2nd Feb 2020 the price action moved up with the powerful divergence and produced more than 32% profit.
Another bullish BAT pattern has been formed:
This time on 12 hour chart after successful formation of previous bullish BAT pattern the Ripple with Bitcoin pair has formed another bullish BAT pattern and entered in potential reversal zone and ready to move up at any time.
Let’s dig the pattern deeper to see how perfect it has been formed.
After initial leg (X to A) the A to B leg is retraced between 0.382 to 0.50 Fibonacci and then B to C leg is projected between 0.328 to 0.886 Fib of A to B Fibonacci projection area and last leg (C to D) is retraced between 0.786 to 0.886 Fibonacci and now entered in potential reversal zone.
Buying And Sell Targets:
The buying and sell targets according to harmonic BAT pattern should be:
Buy between: 0.00002573 to 0.00002519 sats
Sell betweeen: 0.00002703 to 0.00002896 sats
So this short term trade can produce upto 14% profit.
Stop Loss:
The potential reversal zone area that is up to to $0.00002519 can be used as stop loss in case of complete candle stick opens and closes below this level.
Note: This idea is education purpose only and not intended to be investment advise, please seek a duly licensed professional and do you own reaserch before any investment.

XRPUSD LONG - INVERTED HEAD AND SHOULDERS INCOMINGXRPUSD LONG - INVERTED HEAD AND SHOULDERS INCOMING
First - Bullish Breakout - Ascending Triangle after that, we will create the right shoulder for the breakout.
In my opinion, we saw the bottom of XRP.
Thank you, merry Christmas and leave a like.

XRPBTC Has Formed BAT Pattern And Ready For Upto 38% MovePriceline of Ripple / Bitcoin cryptocurrency has formed bullish BAT pattern and entered in potential reversal zone.
This PRZ area should be used as stop loss in case of complete candle stick closes below this zone.
Lets have a look on the pattern's move:
After inertial leg (X to A) the A to B leg is retraced between 0.382 to 0.50 Fibonacci and then B to C leg is projected between 0.382 to 0.886 of A to B Fibonacci projection and last leg (C to D) is retraced between 0.786 to 0.886 Fibonacci and now the price action is moving in potential reversal zone of this BAT pattern now we can expect bullish divergence at any time which will lead the priceline between 0.382 to 0.786 Fibonacci projection of A to D leg , but if after this bullish divergence the candles sticks will be closed above the 0.786 Fibonacci projection then it can also lead to the long term bullish move, so as per Fibonacci sequence method we can set our targets as below:
Buy between: 0.00002668 to 0.00002527
Sell between: 0.00003005 to 0.00003509
Regards,
Atif Akbar (moon333)


XRP is getting crushed. Weekly wedge rejection candle, dump downAlthough the whole Crypto markets are dumping with Bitcoin.
The XRP is clearly getting sold off.. rather dumped on the markets.
Probably by new deals from Ripple who get XRP and sell it for Fiat to run new businesses.
Maybe new businesses will use advantages of XRP.
But most of it will be exchanged for Fiat.
As XRP only has a small short quick holding time to exchange this won't drive price up.
Looking for XRP to move lower from here, until weekly outlook changes, this doesn't look good for the XRP holders.

XRP/BTC : Another Crashes in AltsBUY & SELL As Per Above Given Chart or
You Can Also set Own Risk reward.
Let see what Will be Next Move.
Warning- I m Not a Financial Advisor this idea Only For Educational Purpose Only.
Thank You !

Fibo Wedge Reveals opening on both SHORT and LONG XRPBTC
For whatever reason; chart is not publishing as it is on my screen so I've reprinted the SS above ^
T1-4 with TP1 & 2 being SHORTSELL exits (48-80 hrs)
TP3 a mid position (timeframe 3-5 days)
TP4 a LONG position (>7 days -- pointless to speculate)
OFC stop @ 3151 <-- MOST IMPORTANT FIGURE!!
So I'm leaving this a neutral publication as there is virtually an entry/exit for whatever position (contingent on what type of trader) you are.
Personally; when BTCUSD is sideways/bearish I always like to snipe whatever quick shorts on alts I can...so I usually pivot from my typical EMA50/EMA21 and venture into lower, high-risk/high-reward entries and toe the line between day/swing trading (if I have the extra time) for pairing against ANYTHIHNG other than FIAT USD is a TERRIBLE DECISION and something I would NOT ENCOURAGE AMATEURS TO DO! If you are not an experienced trader; let me reiterate, DO NOT BOTHER EXPERIMENTING WITH OTHER PAIRINGS BESIDES USD UNLESS YOU ARE WILLING TO LOSE, as these are very difficult trades to pinpoint timeframes/exits seeing as how you need not only BTC to decrease but the coin you're pairing it against to increase in volume/priceaction: so your normal indicators don't typically apply in certain contexts.
This is why I only stick to top 25-50 market cap coins & I don't trade in any coin (nothing in my portfolio) that I don't know everything about -- from the whitepaper, dev team, roadmap, updates, etc. everything...
I never understood how forextraders could take a position on a cryptocurrency when they haven't read the whitepaper...it makes absolutely no sense and boggles the mind!
Would you invest in a product/service if you had NO IDEA what it did ? Just because the charts look decent? If so than you're a fool!
With that being said, have a wonderful day.
Peace & Love.
- @a1mTarabichi
DISCLAIMER
NOT FINANCIAL ADVISE

XRP BTC long We have so many resistance from up ahead, and the only couple supports from down.
There is a problem that big whale or even RIPLE management funding this price drop, as we see that constant sell-off coming again and again.
If we check lower TF like 5 min or even 1 min, we will see that the market manipulated by high trading bots.
What I see does not make me happy, as it means we may dive down with massive strength.
Why long, because there is a tight SL, we still keep a channel low TF uptrend.
Who does not have a position, wait for confirmation of bounce and enter with a tight SL.
I have a theory that this time will not be any of pumps and all will go slow upward as it was with Bitcoin. ANy resistance level breach and we keep going slowly and painfully, to throw out all passengers who enter on a short pump rocket.