XRP Price Targets and Stop LossXRP/USDT
Entry Range: $0.79 - 0.86
Price Target 1: $1
Price Target 2: $1.10
Price Target 3: $1.28
Stop Loss: $0.73
XRPBTC

IS XPR READY TO ROCKET!- Breakout of a long term trend line, next targets will be the blue support and resistance lines!

XRP Fireworks SoonOn left XRPBTC has dropped from a previous resistance and later reestablished support trendline. This is the monthly timeframe .
All timeframes are becoming more and more bullish , the daily a good example, with a bullflag priming itself right above the bottom support line, ready to move up
I have added XRP based on its position right now, the fabled bull days are within reach

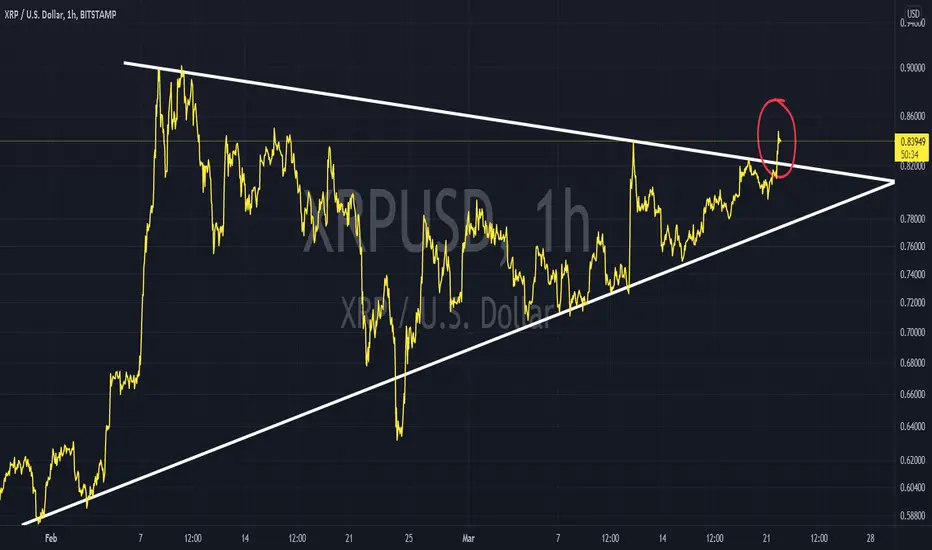
XRP has broken out and closed above the triangle on the 1HR TF- A breakout and close outside this triangle is a bullish signal, lets see how it plays out!
XRP FAKE OUT before we breakout - We can see a break above the trend line on the 4 hour time frame, could we possibly see XRP return back into the triangle before taking off again?
- LET'S WAIT AND SEE!!!

XRP Double digits this year is possible- I personally believe that when the lawsuit for RIPPLE is over, the price of XRP will move but not by a lot straight away.
- Just like CRO (crypto.com) did, it was heavily being advertised on F1 cars and UFC rings and the fighters where also wearing the t-shirts with crypto.com advertised on it.....however the price of CRO did absoulotlly nothing.
- So my point is that the company and the stock/crypto doesn't move together, think of it as a lag between the 2 and eventually when the market picks up the prices in crypto skyrocket, as this is crypto not the stock market!

XRP Potential Breakout!- The lawsuit is still hanging over RIPPLE, clearly the sec has lost, its only a matter of time before we see an explosion!

XRP/BTC IDEA.... Looking for XRP / BTC Breakout soon... When XRP/BTC gets above the next level we should see 1.33 XRP USD levels.

XRP potential targetxrp is looking great to accumulate down here,
could potentially be close to breaking the down trend
hope u got in when i posted a week earlier

XRP - Flag Reversal?Hi Everyone, been a while since I posted on here!
We see a potential flag forming on XRP. This could indicate a reversal is near, as the flag formed after bottoming out at 0.55c.
For now, I expect us to continue trading in this range/channel. The lower highs indicate that we are building up buying volume under the sell-wall/resistance zone at 0.86c.
Phoenix Ascending is looking bullish from a 1W timeframe.
Best Regards!

$2 XRP SOOOONNNNXRP UPDATE!! WHY WE ARE BULLISH UP TO $2
#XRP Has given us higher timeframe and lower tf bullish strength while the market could run from currently levels were looking for that high low printed in .66 before further upside

BUY XRPUSDT TODAYGOOD EVENING,
1)we are above the VWAP .👌
2)the correct order and strong condensation of the 4EMA.👇
3)bull divergence confirmed by MACD .💪
4)protected by the last support. 💪
all these indicators say buy in a loud voice.
so BUY and open your wallets.🤑
GOOD LUCK.❤️

JUNE XRP SHOULD BREAK OUT!- As we can see XRP is coiling up, we will have a reaction around JUNE so be ready for a breakout.
- 10 % chance of it breaking down
- 90% chance of it breaking to the upside!

XRP close to breaking outxrp is looking great to accumulate down here,
could potentially be close to breaking the down trend

XRP (XRP) - March 13Hello?
Welcome, traders.
By "following", you can always get new information quickly.
Please also click "Like".
Have a good day.
-------------------------------------
(XRPUSD 1W Chart)
(All: )
If support is found in the 0.71097-0.88410 range, I would expect a reversal to the uptrend.
However, careful trading is required as the uptrend is expected to accelerate only after breaking out of all downtrend lines.
-------------------------------------
(XRPBTC 1W chart)
(All: )
Above 0.0000 2365 point: Expected to create a new wave.
However, the upward trend is expected to accelerate when it rises above the 0.0000 3909 point.
1st resistance section: around 0.0000 5885 point
Secondary resistance section: 0.0000 8230 - 0.0000 9413
When the BTC price rises or falls, you need to check which section of the BTC market chart supports or resists the price.
This is because when BTC price rises or stops falling, altcoins will start to move.
------------------------------------------
We recommend that you trade with your average unit price.
This is because, if the price is below your average unit price, whether the price trend is in an upward trend or a downward trend, there is a high possibility that you will not be able to get a big profit due to the psychological burden.
The center of all trading starts with the average unit price at which you start trading.
If you ignore this, you may be trading in the wrong direction.
Therefore, it is important to find a way to lower the average unit price and adjust the proportion of the investment, ultimately allowing the funds corresponding to the profits to be able to regenerate themselves.
------------------------------------------------------------ -------------------------------------------
** All indicators are lagging indicators.
Therefore, it is important to be aware that the indicator will move accordingly as price and volume move.
However, for the sake of convenience, we are talking in reverse for the interpretation of the indicator.
** The MRHAB-O and MRHAB-B indicators used in the chart are indicators of our channel that have not been released yet.
(Since it was not disclosed, you can use this chart without any restrictions by sharing this chart and copying and pasting the indicators.)
** The wRSI_SR indicator is an indicator created by adding settings and options to the existing Stochastic RSI indicator.
Therefore, the interpretation is the same as the traditional Stochastic RSI indicator. (K, D line -> R, S line)
** The OBV indicator was re-created by applying a formula to the DepthHouse Trading indicator, an indicator disclosed by oh92. (Thanks for this.)
** Support or resistance is based on the closing price of the 1D chart.
** All descriptions are for reference only and do not guarantee a profit or loss in investment.
(Short-term Stop Loss can be said to be a point where profit and loss can be preserved or additional entry can be made through split trading. It is a short-term investment perspective.)
---------------------------------


buy signal on xrp to $7+we have only ever seen a few long signals on xrp that have delivered big gains - buy today and hold for 1200% (12x) return

XRPUSDT Resistance Trend Line breakout!XRPUSDT (4H Chart) Technical analysis update
XRP Price Multiple times touched its resistance trend line, now the price breaks its major trend resistance line I'm expecting a good up move in XRP.
Buy level: Above $0.750
Stop loss : $0.6921
Target 1 : $0.798
Target 2 : $0.851
Target 3 : $0.900
Target 4 : $0.95
Always Keep Stop Loss
T
Thanks
Hexa

Linda P Jones 10% of Swift - XRP $1,200- As Linda P. Jones stated Swift settles $1.2 QUADRILLION A YEAR!
- Swift is SLOW, CLUNKY and OLD!
- WHO IS LINDA P. JONES: Responsible for Morgan Stanley Investment Management (MSIM) Institutional funds, mutual funds, and hedge fund sales by Morgan Stanley Financial Advisors in 8 states. Marketed investments to financial advisors and their high net worth clients. Over 25 years of financial industry experience in sales, management, and marketing with various financial organizations.

XRP - Its almost time on the btc pairTriangle is until ~ half april
Very long consolidation, USDT pair is also bottoming out
USDT pair > no weekly close under 0.58 and we are fine.
Lets root for the big pump. almost everyone is silent now about XRP.

XRP ( Ripple ) $9 Potential in Long term #XRP/USDT TA Update:-
$XRP current price = $0.74
As per chart Bullish pennant formed.
Breakout Point is $1
But Imo Ripple is bullish for Long term.
Best Entry:- $0.55-$0.75
Targets:- $1.57/$4/$9
1500% Potential in Long term as per My opinion.
My opinion is not Financial advice.
Stop Loss:- If any Weekly candle close below $0.5 then Exit.
Support:- $0.55
Resistance:- $1/$1.22/$1.57

SEC HAS LOST THE CASE :P- GARY has accepted defeat now lets wait for the settlement before we sky rocket
- But knowing how manipulated these markets are we may see A FINAL CRASH before we go to the upside, the same thing happened in 2017 we saw a massive drop so many people got shaken out and then green light boooom!!

