XRP Sell the descending triangle.Ripple - Intraday - We look to Sell at 0.759 (stop at 0.772)
Daily signals are bearish.
There is no clear indication that the downward move is coming to an end.
Trades with a bearish descending triangle formation.
Trend line resistance is located at 0.760.
Preferred trade is to sell into rallies.
Our profit targets will be 0.722 and 0.712
Resistance: 0.740 / 0.760 / 0.780
Support: 0.720 / 0.710 / 0.700
XRPBTC

XRP back in the gameXRP is holding a new uptrend and is slowly going up, the market is taking a break from the negative influence of BTC, the situation is developing and it is important to keep an eye on the developments every day, because BTC can wake up and repeat the correction or just strongly rebound upwards

XRP unpredictable directionXRP is experiencing a slight rebound in price and temporary calm, but this can change rapidly and we will see more days with high activity on the chart, BTC unfortunately deals the cards

XRP The explosive 3/3/3!If we don't get a new low bellow .51 we have to assume this move up from the low of .51 is a 1-2 of its own. If that is the case we would be working on the wave 3 of a wave 3 of a wave 3. Which I would expect to be very explosive. We have a lot of confluence between the 3 fib extensions. If .51 is broken then I would eliminate the red count and would have to assume the C wave of the blue count is still alive. For now we hope for a huge momentum push up so we can be clear of the current count.

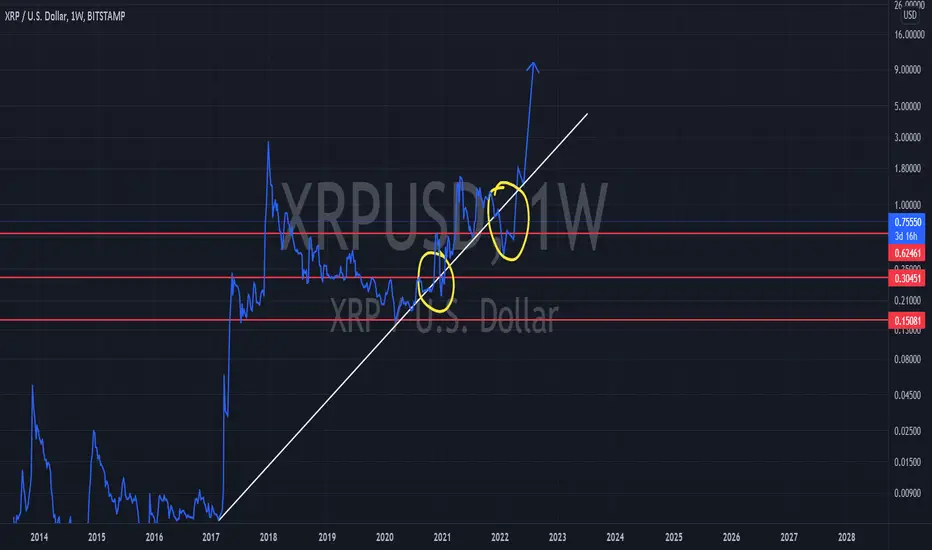
XRP $13 OR $0.30 ???- As you can see XRP is still within the long term TREND line.
- It could potentially consolidate between now and September, however it will need to break up or down!
- With the SEC case XRP is still being supressed as they don't have the green light yet and I know the governments in this world are full of corruption and greed, they want to remain the elites, they want control over out money....BUT the XRP ARMY has strong diamond hands, we know what XRP is and what value it holds for us and our future!!
- These are the ONLY scenarios I see playing out!!
- Please DO NOT use this as financial advice, I am here to just give my opinions on the market, do your own research and only invest what you are willing to lose :D


XRP potential targetxrp looking great to accumalet down here
putting in dailly bull divs
great risk reward down here

XRP COULD BREAKOUT OF THE TREND AND THEN CONTINUE UP!!- As we can see the trend line is broken and we could drop down a little before we continue up!!
- There has been too much good news and ODL adoption, where I believe XRP will show this on the charts!
- The Bull market is still on we sill have not broken the ATH!!!

XRP WHATS NEXT?????????????- As you can see we are on the edge of the trend line
Scenario NO 1: We break the trend line for a short period of time like we did when the SEC sued RIPPLE, then we work our way up again.
Scenario No 2: We continue to the upside and continue consolidating until the case is over or if BTC starts dumping, however I believe we could be in a short term correction before we move up, I personally do not believe BTC has topped of, if it has then we should see a ALT season.
Scenario No 3: We continue breaking to the downside and go low as $0.30 or continue down to $0.14, which could mean a bear market!!
Scenario No 4: We may be entering a bear market but I do not believe that to be the case at all!!!!!!

XRP triangle breakout 📐Ripple is breaking out of this local range up and I think it will also break up this triangle 📐later on. Then there would be a chance for run to 2.29 and even higher. Setting BUY LIMIT order to catch the pullback.❌R P come on!
ENTRY : local high @ 0.9361
STOPLOSS (SL) : local low @ 0.7601
TARGETS (TP) : TP1 - resistance @ 1.41 | TP2 - resistance @ 1.70 | TP3 - resistance @ 2.22 right below of the projection (height of the triangle projected from midpoint of the local range (BUY LIMIT - SL))
REWARD RISK RATIO (RRR) : TP1 - 2.7 | TP2 - 4.3 | TP3 - 7.3
INVALIDATION : when SL level hit
Will the history repeat itself? 👇
Check my other stuff in related ideas.
Please like👍, comment🗣️, follow me✒️, enjoy📺!
⚠️Disclaimer: I'm not financial advisor. This is not a financial advice. Do your own due dilingence.

XRP we're going after BTCXRP the same as other cryptocurrencies, received a negative impact of BTC and thus the correction, the support line will probably be broken (but it is not so sure) the whole situation should be treated as another promotion for long-term purchases

XRP POTENTIAL DROP TO AROUND $0.45 (£0.33)- We could see a miner break out down to around $0.45 (£0.33), before we make our move to $6.60 (£7.41)
- Anything can happen!!
XRP/USD - Downtrend may end soon. Until then stuck in channel!XRP has so far failed to reverse the downtrend and is found just above the key support.
Key Support levels: $0.75
Key Resistance level: $1
XRP had a difficult week, with the price slowly falling back towards the key support level at $0.75. While other altcoins such as Chainlink are making significant gains, XRP still struggles to find its footing. The resistance at $1 will likely not be tested any time soon considering this price action.
Technical Indicators
Trading Volume: The volume has decreased as the price went lower, showing weakness in the bearish trend. This is good news, as XRP may attempt a reversal soon.
RSI: The daily RSI has made a higher low. This also gives hope that XRP may finally return on the uptrend and attempt another break of the key resistance.
MACD: The daily MACD remains bearish, but the histogram shows a lack of conviction from the sellers. For this reason, MACD can quickly do a bullish crossover if buyers return in force.
Bias
The current XRP bias is neutral. While the price action is somewhat bearish, there is no conviction on either side to push price up or down in any significant way.
Short-Term Prediction for XRP Price
XRP may have reached the end of this correction after the sharp rejection at the $1 resistance level. The lack of volume shows this. For this reason, buyers may soon have a good opportunity soon to bring up the pace.

XRP (XRP) - January 5Hello?
Welcome, traders.
If you "follow", you can always get new information quickly.
Please also click "Like".
Have a nice day.
-------------------------------------
(XRPUSD 12M Chart)
(1M chart)
You need to break out of the downtrend line to accelerate the uptrend.
So, we need to see if we can break out of the downtrend line while holding the price above the 0.4493 point and possibly above the 0.6940 point.
(1W chart)
Above the 0.4493 point: the uptrend expected to continue
Above 0.7541-0.8294 section: It is expected to create a new wave.
(1D chart)
It must move above the 0.8744 point to turn into an uptrend.
In particular, you need to make sure you can move up along an uptrend line.
If it falls in the 0.7541-0.8744 section, it may fall below the 0.5483 point, so a stop loss is required to preserve profit and loss.
However, it can touch near the 0.4493 point and rise, so you need to think about countermeasures.
Above the 1.0424-1.1861 section is the high point section, so we need to check if the volume increases to break above this section.
In the CCI-RC indicator, as the CCI line falls below the -100 point, the possibility of turning into a downtrend is increasing.
However, as volatility may occur due to a decrease in trading volume, careful trading is required.
We need to see if we can move above the 0.8744 point before around January 17th.
------------------------------------------
(XRPBTC 1W chart)
It is on sideways in the bottom section.
------------------------------------------
We recommend that you trade with your average unit price.
This is because, if the price is below your average unit price, whether the price trend is in an upward trend or a downward trend, there is a high possibility that you will not be able to get a big profit due to the psychological burden.
The center of all trading starts with the average unit price at which you start trading.
If you ignore this, you may be trading in the wrong direction.
Therefore, it is important to find a way to lower the average unit price and adjust the proportion of the investment, ultimately allowing the funds corresponding to the profits to be able to regenerate themselves.
------------------------------------------------------------ -------------------------------------------
** All indicators are lagging indicators.
Therefore, it is important to be aware that the indicator moves accordingly with the movement of price and volume.
However, for convenience, we are talking in reverse for the interpretation of the indicator.
** The MRHAB-O and MRHAB-B indicators used in the chart are indicators of our channel that have not been released yet.
(Since it was not disclosed, you can use this chart without any restrictions by sharing this chart and copying and pasting the indicators.)
** The wRSI_SR indicator is an indicator created by adding settings and options to the existing Stochastic RSI indicator.
Therefore, the interpretation is the same as the traditional Stochastic RSI indicator. (K, D line -> R, S line)
** The OBV indicator was re-created by applying a formula to the DepthHouse Trading indicator, an indicator disclosed by oh92. (Thanks for this.)
** Support or resistance is based on the closing price of the 1D chart.
** All descriptions are for reference only and do not guarantee a profit or loss in investment.
(Short-term Stop Loss can be said to be a point where profit and loss can be preserved or additional entry can be made through split trading. It is a short-term investment perspective.)
---------------------------------

IF MARKET STARTS TO PICK UP WE COULD SEE THIS!- The Green lines are your resistance lines
- The Red lines are your support lines
- Worst case scenario we could see $0.50
- Best case scenario we could break the $1.80/90 +
- Anything can happen in these markets, you just have to be prepared !!

XRP holds the fundamental line (blue)XRP has a very strong fundamental support line (blue line), despite the many fluctuations, the price stays in this line and continues to move, this is a good sign for the future (as long as BTC does not surprise again)

XRP $6.60 POSSIBLE....- As you can see XRP broke slightly below the 50 EMA channel, indicating a sell off, however if you look carefully it did that before aswell and wat happened after that?
- We saw a 1,058% move to the upside if that plays out again, then we could see around $6.60 XRP (£4.87)!

XRP Sell into a rally.Ripple - Intraday - We look to Sell at 0.878 (stop at 0.901)
Daily signals are bearish.
Intraday rallies continue to attract sellers and there is no clear indication that this sequence for trading is coming to an end.
20 1day EMA is at 0.880.
Preferred trade is to sell into rallies.
Early optimism is likely to lead to gains although extended attempts higher are expected to fail.
Our profit targets will be 0.811 and 0.791
Resistance: 0.840 / 0.860 / 0.880
Support: 0.820 / 0.805 / 0.785

XRP, what are the preconditions for growth?The XRP chart has a very good picture on the technical analysis side.
Preconditions for growth:
- accumulation.
- squeezing near the trend line
- a fake breakout of the trend line
- liquidity collection
- volume appeared at the bottom
- bitcoin is in consolidation
In case of a false breakout there could be a good buying opportunity.
Write in the comments all your questions and instruments analysis of which you want to see.
Friends, push the like button, write a comment, and share with your mates - that would be the best THANK YOU.
P.S. I personally will open entry if the price will show it according to my strategy.
Always make your analysis before a trade.

XRPUSD 2300 % gains in 2022XRPUSD currently in a reaccumulation zone.
Make a note that it´s a weekly chart and it may take some time for the price to visit our buy zone. Patience is a key.
We expect XRP to go parabolic in Q3 or Q4 2022.
Long term target over 10 $ .
What may push the price so high? Coinbase relisting or winning against SEC. Catalyst will come and the price will surge.
Drop a comment and let us know what you think
No financial advice

XRP 2022 APRIL BREAKOUT POSSIBLE!- As you can see the money miner has called out a BUY on the 1 day time frame, I think if the case is over Q1 then we could see a breakout in April this year and XRP could go parabolic to around $15 around May!!
- NOT FINANCIAL ADVICE!
- This is what could possibly happen as there is so much suppression with RIPPLE, XRP is a ticking time bomb!!!!

XRP a quiet trend and a gradual return to the topXRP has had a very difficult time, the large loss of value and the negative influence from BTC have had a huge impact on the chart. The near term could be different as the behavior of BTC has a big impact on other cryptocurrencies, but if there is no impact, XRP should gradually rise

I expect a re-testing of the $ 0.70 rangeOn a weekly timeframe, the trend is negative, and the roof and floor are being built lower. I expect a re-testing of the $ 0.70 range. If it tests this support, be sure to enter for the medium term. If it can break the range of $ 1 to $ 1.6, the upward trend will be, and you can re-enter.
