XRP Cup & Handle forming bull-flag pattern with Fibonacci. If you've followed my charts, then you've certainly seen the cup & handle pattern that I identified many months ago in XRP. Although the breakout wasn't as spectacular as many of us had hoped for, it seems a pattern is forming within the pattern. The bull-flag, in combination with the Fibonacci sequence, and the upper trendline of the 'XRP is not a security' rally high, may be a good combination for traders to utilize in order to plot their next long position.
Good luck, and always use a stop-loss!
XRPBTC

XRP and the coming new all-time-high.XRP's price has been lagging behind the market, but it makes sense as Ripple has admitted to dumping XRP on retail's head during the rallies. As it stands, the selling of XRP is Ripple's only way to raise capital. However, XRP still remains the only single cryptocurrency on the entire market that has legal clarity. Not even Bitcoin has this, even though it is falsely touted to have such by Bitcoin shills all over the internet.
Once the lawsuit is finished, there will be nothing standing in the way of XRP finding true price discovery, and people who have gained massive amounts in other cryptos will be taking profits out and reinvesting them in undervalued assets like XRP.
I see a short squeeze from hell coming to XRP very soon!
Good luck, and always use a stop-loss!

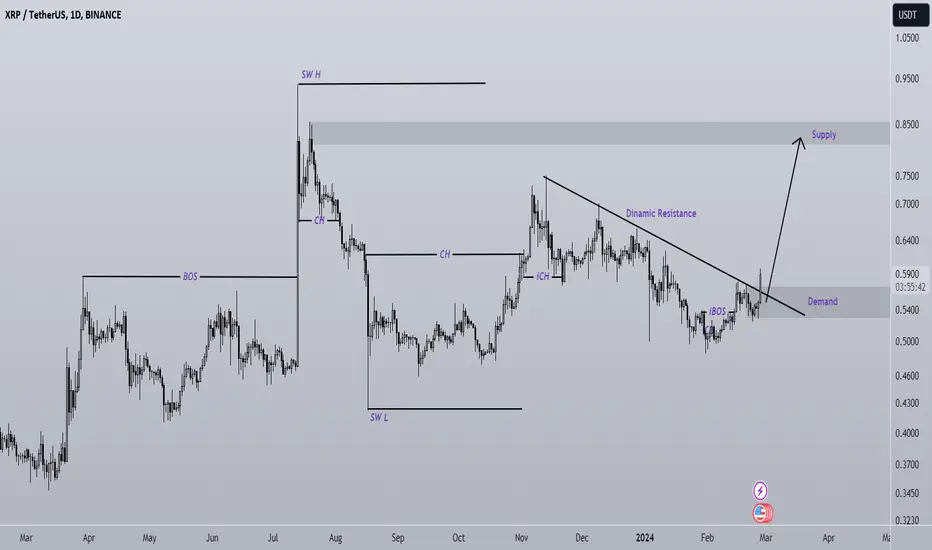
XRP has formed a Bullish setupXRP has formed a Bullish setup
🔵Entry Zone 0.6239 - 0.6514
🔴SL 0.5854
🟢TP1 0.7192
🟢TP2 0.8736
🟢TP3 1.1900
Risk Warning
Trading Forex, CFDs, Crypto, Futures, and Stocks involve a risk of loss. Please consider carefully if such trading is appropriate for you. Past performance is not indicative of future results.
If you liked our ideas, please support us with your likes 👍 and comments.

XRP "NOT JUST A CONSPIRACY" PT 2Hello everyone, this is a more in-depth XRP chart from the previous one I uploaded on March 08 called " XRP NOT JUST A CONSPIRACY"
Observations:
-Monthly chart looks best so I am using the monthly chart as my guide.
-Buy entry is whale accumulation.
-Ever since May 2022 whales have been massively accumulating and XRP has been trading sideways which proves it.
-Bit community and believers so when it decides to pump it will likely go up with strong force as this is a MONTHLY chart which makes it even stronger and better.
- STOCHASTIC looks bottomed on the monthly (what comes down has to go up)
-MACD looking like trend change and accumulation.
GIDDY UP XRP ARMY. I am coming for you Bitboy.

XRP is about to start gaining ground against BTC rapidly!BTC has been utterly dominating XRP on the BTC vs. XRP chart for quite some time, but those days are quickly coming to an end. The price ratio is now looking like it is going to breakout of the descending wedge pattern, which will result in XRP gaining in price compared to BTC.
Good luck, and always use a stop-loss!

Understanding When XRP Will MOON- Part 2 MartyBoots here. I have been trading for 17 years and I am here to share my ideas with you to help the Crypto space. The Bull market is here
Even tho the bull market is here XRP has not mooned yet . The ALTCOIN market has just hit a critical level , when this happens XRP can start its move higher . This needs to be watched carefully.
XRP To The MOON
Please watch the video for more information

XRP After the breakout will go upXRP After the breakout will go up
🔵Entry Zone 0.5908 - 0.6234
🔴SL 0.5467
🟢TP1 0.6928
🟢TP2 0.8320
🟢TP3 1.0980
Risk Warning
Trading Forex, CFDs, Crypto, Futures, and Stocks involve a risk of loss. Please consider carefully if such trading is appropriate for you. Past performance is not indicative of future results.
If you liked our ideas, please support us with your likes 👍 and comments.

[XRPUSDT] - under retesting!for weekly chart xrp going to retest the 0.382 fib level and upper side of the massive symmetrical triangle..
successfull retest meaning 1$ is our target .
don't forget to support us with ur like , comment and follow for more updates🎯

Updated and simplified XRP Cup & Handle chart.XRP has an uphill battle ahead for the bulls. Gaining ground won't be easy unless buying volume rolls in, but it is possible to break back into the .70's range fairly quickly if this is the case.
Good luck, and always use a stop-loss!

XRP has a major battle ahead to gain on Bitcoin.The XRP vs BTC chart is showing a massive stack of sell orders between the current price, and the upper, long-term trend line. Filling that gap isn't going to be an easy task, but it is possible. And, the fact that the current ratio is nearing the bottom trend line that has been in play for 3,350 days, it could be a sign that XRP is soon to start gaining ground on BTC.
Good luck, and always use a stop-loss!

XRP IS BULLISHBefore anything, pay attention to the time frame, the time frame is big and time consuming.
Ripple seems to be in a symmetrical pattern that is now about to start its upward F wave.
By keeping the green box, it can continue to pump in the coming days.
The targets are clear on the picture.
Closing a daily candle below the invalidation level will violate the analysis
For risk management, please don't forget stop loss and capital management
When we reach the first target, save some profit and then change the stop to entry
Comment if you have any questions
Thank You

Cryptolean Ripple XRP UpdateNow, XRP lacks the momentum, however, it will change soon.
Today, it again tested the key daily support at $0.593 and we saw a bullish rejection.
It has to move to above $0.65-$0.675, the key daily resistance zone, for bulls to take control and move price to the previous local high at $0.93.
A daily candle closure above $0.675 will result in a bullish rally towards $0.73 and, possibly, higher .
An inability to sustain the price action above $0.59 will result in price slowly declining towards $0.54.
IMPORTANT: XRP Satoshi Price is under pressure due to a bullish Bitcoin Dominance, while XRPUSD chart is consolidating in the narrow range. Once Satoshi price of XRP in the #XRPBTC chart finds a support that could happen at 810 Satoshi and reverses, XRP price will shoot up.
Intraday Chart
The sentiment for the #XRPUSDT 4-Hour chart is neutral
A bullish break-out of $0.628 will push #RippleXRP to the key intraday resistance zone of $0.69-$0.72, however on the way to this zone, #Ripple coin will have to deal with a resistance at $0.657.
A inability to break through $0.628 will result in another bearish dip to $0.602 or, lower, to $0.575 that could lead to a bullish rejection towards $0.69-$0.72 and higher.

Major news Ripple vs. SEC lawsuit incoming?- BTC and ETH dominances are declining.
- BTC and ETH market cap have reached 4.236 fib extension (2017/2018 high and Covid 2020 march low).
- Huge triangle/pennant on XRPUSDT daily/weekly; declining volume.
Will XRP soak up market value from every other crypto and repeat what happened last bull cycle? Let's find out!

XRP looks to be setting up for another run northward!The recent liquidation candle could be a very bullish sign for XRP price. As you can see from the chart, the Stoch MTM is showing a potential bullish crossover attempt. The last three times this happened, XRP price made decent gains shortly thereafter.
Good luck, and always use a stop-loss!

My TOP10 project list - pick number 9/10 - XRP !!XRP
Some love it - some hate it.
I have been holding this coin for about 7 years now. I have always known that it was made for greatness. My XRP holding always oscillated between 90 and 60%. I am a believer.
Fortunately I diversified somewhat and was able to make some gains with other tokens. I understood that, to be able to wait for the rewards, i had to be able to sit tight. For that I needed to have other tokens to make it through the desert. This is not a sprint. It is a marathon.
However in 2024 something changed. I felt my confidence was slightly eroding. My XRP position came down to 25% !! On one side I made good gains on other tokens. On the other side because I decided to swap some XRP for other newer projects.
The actual sentiment has become the following. Look for new tokens for the bull run ! The old tokens have already had their run ! Look for the new shiny projects (Celestia, Kaspa, Bittnsor and other AI projects, Arweave, etc.).
NOBODY is talking about 'paiments'. The narratives are AI, DE PIN, COMPUTING, GAMEFI, and so on. NOBODY is looking for old, well established tokens, that have made it through several bear markets and had the time to build behind the scenes.
I am sure this new projects will (and have already) shined. However, I would not descard older projects like XRP. It is still my belief that XRP will play a major role in the Digital Financial System. Some say: "Not today ! Not in this bull market ! Further down the road, in 2030 !".
I say: "Really ??" - Chart says otherwise !!!

XRP/BTC BULLISH FORMATION🔥BINANCE:XRPBTC
#XRP Army, here we go.
This is where I change my BTC to XRP for the next leg up, and will TP back into BTC.
As always, Stay Safe and DYOR.
#TheHopinionist

XRP is bullishThe large structure of XRP is bullish, we have a close support area for XRP, it can be pumped by maintaining this range.
The targets are marked on the chart.
Closing a daily candle below the invalidation level will invalidate the analysis
Note that the financial market is risky, so:
Do not enter any position without confirmation and trigger.
Do not enter a position without setting a stop.
Do not enter a position without capital management.
When we reach the first TP, save some profit and try to move the stop continuously in the direction of your profit.
If you have any comments please post them, comments will help us improve our performance
Thanks
XRP Cup & Handle Update.This chart is an update of an earlier post that has changed a bit.
Always use a stop!

XRP - Best time to buy is right now, here is whyXRP is currently sitting on the main support of the ascending parallel channel. This is definitely a great opportunity to buy cheap XRP. We have a leading diagonal wedge as wave (1) followed by a sharp correction wave (2). Wave (3) should be in progress. You can be sure that XRP is a big deal for huge institutions such as banks. They are already investing a lot of money into implementation of this cryptocurrency. Let me know what you think about my analysis, and please hit boost and follow for more ideas. Thank you, and I wish you successful trades!
Unlike Bitcoin or Ethereum, the XRPL uses a unique Federated Consensus mechanism as its method of validating transactions. Transactions are confirmed on the XRPL through a consensus protocol, in which designated independent servers called validators come to an agreement on the order and outcome of XRP transactions. All servers in the network process each transaction according to the same rules, and any transaction that follows the protocol is confirmed right away. All transactions are public and transparent, and anyone can operate a validator. There are currently over 150 validators on the ledger, operated by universities, exchanges, businesses, and individuals around the world.
Through the Federated Consensus mechanism, all verified transactions can be processed without a single point of failure as no single participant makes a decision independently. Let me know what you think about my analysis, and please hit boost and follow for more ideas. Thank you, and I wish you successful trades!

XRP showing a beautiful cup & handle pattern on 4hr/Daily chart.XRP is showing a very nice cup & handle pattern on the 4hr, and hourly chart. I think we could see a very powerful breakout in the coming weeks. If so, this could trigger a short-squeeze that literally blows people's minds, as a large percentage of XRP is being held short right now.
There's also a nice bullish divergence in on the hourly chart that I'll show in the comments below.
Always trade with confidence, never trade with fear, and always use a stop!

XRP Chopping Up: XRPBTC Breakout OVERDUE📉Hi Traders, Investors and Speculators of Charts📈
XRP is notorious for pumping and dumping, but even after the wallet "hack" of Chris Larsen, the price is still making higher lows.
From a macro perspective, we can clearly see the price increase - gradually, but we're stair stepping up. XRP usually dumps harder than BTC when there's a correction and the XRPBTC chart is still in prison. However, if we consider this chart, it is more likely that XRP will GAIN ground n BTC soon, instead of weakening more against BTC:
If you found this content helpful, please remember to hit like and subscribe and never miss a moment in the markets.
_______________________
📢Follow us here on TradingView for daily updates📢
👍Hit like & Follow 👍
CryptoCheck
BINANCE:XRPUSDT BINANCE:XRPBTC

XRP has formed a Bullish FlagXRP has formed a Bullish Flag. In the near future the price can break above the resistance.
🔵Entry Zone 0.5678 - 0.5351
🔴SL 0.5103
🟢TP1 0.6400
🟢TP2 0.6800
🟢TP3 0.8000
🟢TP4 0.8800
Risk Warning
Trading Forex, CFDs, Crypto, Futures, and Stocks involve a risk of loss. Please consider carefully if such trading is appropriate for you. Past performance is not indicative of future results.
If you liked our ideas, please support us with your likes 👍 and comments.

i thought id be happy with $20 XRP, im adding another 0fib channels, cyclic lines plus fibonacci circles - who would of thought about this powerful combo.
alot is pointing towards a massive xrp movement soon:
- corrective fib circle
- fib channel support
- cyclic timeline balance
...its positioned for 2024 to moon
like i said i thought $20 would be a nice pump, if retail jumps in with the same vengeance as 2017 then this could absolutely rocket into triple digits.
expansion from a 6 year consolidation will absolutely melt faces
