Ripple - Dreams and hopes about to get crushed! In our previous posts on the Ripple cryptocurrency, we pointed out the bullish breakout from the symmetrical triangle and signs of exhaustion accompanying this price action. In addition to that, we outlined a part of the legal case between the SEC and Ripple Labs, Inc., debunked a myth about the market-cap capabilities, and described an ongoing behavior in the Ripple community as merely a “buy the rumor, sell the fact” behavior.
Today, again, we would like to hint at several worrying developments about XRPUSD. First, volume continues to hover around monthly lows, reflecting little to no interest among new investors willing to propel the price higher. Furthermore, the risk appetite in the overall market continues to decline with the prospect of higher interest rates and progressing recession.
However, that does not seem to concern many market participants predicting the bottom and chasing the market with the vision of huge profits. Unfortunately, in our opinion, that is all it is - a vision of huge profits without regard for any macroeconomic factors. Indeed, we believe those on the buying spree over the past weeks will feed the ultimate selloff later as the general market progresses deeper into recession.
In accordance with that, we have no reason to change our bearish bias toward Ripple and stick to our price targets at 0.30 USD and 0.28 USD. Our other reasons for that are described below and in the attached articles.
Illustration 1.01
Illustration 1.01 shows the daily chart of XRPUSD. Yellow arrows hint at the latest technical developments. The price retracement toward the 20-day SMA catches our attention as it might potentially foreshadow a failure of the trend to continue. Therefore, we will pay close attention to the price action. If the price holds above the 20-day SMA, it will be bullish. However, if the price fails to hold above this level, it will be very bearish for XRPUSD. Therefore, to confirm our bearish thesis, we would like to see a pick-up in volume accompanying a drop in the price.
Technical analysis - daily time frame
RSI reversed. MACD turned bearish. The same applies to Stochastic. DM+ and DM- are bullish. Overall, the daily time frame reflects the loss of bullish momentum.
Technical analysis - weekly time frame
RSI turned neutral. MACD and Stochastic point to the upside. DM+ and DM- are bullish. Overall, the weekly time frame is slightly bullish/neutral.
Please feel free to express your ideas and thoughts in the comment section.
DISCLAIMER: This analysis is not intended to encourage any buying or selling of any particular securities. Furthermore, it should not be a basis for taking any trade action by an individual investor. Therefore, your own due diligence is highly advised before entering a trade.
XRPEUR

XRP breakoutPlease 1st of all click the boost 🚀 button if you want me to post more ideas and follow me to support my work! It's absolutely for free.
Ripple broke the (red) major downtrendline (click the idea below to see it the whole downtrendline)
...and then consolidated in form of triangle. Recently it broke up out of this triangle📐 and I think there is chance for run to 0.6330 and even higher. Setting BUY LIMIT order to previous range high to catch🎣 the pullback.
ENTRY : local high @ 0.5063
STOPLOSS (SL) : local low @ 0.4800
TARGET (TP) : height of the triangle projected from midpoint of the local range (BUY LIMIT - STOPLOSS) @ 0.6330
REWARD RISK RATIO (RRR) : 4.8
INVALIDATION : when SL level hit
Check my other stuff in related ideas.
Please boost🚀, comment🗣️, follow me✒️, enjoy📺!
⚠️Disclaimer: I'm not financial advisor. This is not a financial advice. Do your own due dilingence.

Ripple - We warned but nobody listenedIn our last idea on Ripple, we warned about the inevitable end of the rally and a return to reality. Indeed, even before that, we dismissed why it would not be possible for Ripple to reach sky-high valuations like 100 USD or 1 000 USD, which many market participants seem to be forecasting.
Despite that, however, our view has not changed much. We remain bearish on XRPUSD and think it will go back to its 2022 lows over time. Accordingly, we maintain our price targets of 0.30 USD and 0.28 USD.
Illustration 1.01
Illustration 1.01 shows the weekly chart of XRPUSD and two yellow rays. The bullish breakout above the second ray took place; to confirm our bearish thesis, we would like to see the price break back below the Ray 2 and hold there.
Technical analysis - daily time frame
RSI turned bearish. Stochastic is also bearish. MACD is neutral. DM+ and DM- are bullish. Overall, the daily time frame is turning bearish.
Illustration 1.02
The picture above shows the daily chart of XRPUSD within the wide range. We previously outlined that the breakout above the range would be bullish; however, once it occurred, we said we would pay close attention to volume. Subsequently, volume was declining while the price was rising, leading us to speculate about the potential top.
Technical analysis - weekly time frame
RSI is bearish. MACD points to the upside but stays in the bearish area. Stochastic points to the upside. DM+ and DM- are bullish. Overall, the weekly time frame is still slightly bullish.
Please feel free to express your ideas and thoughts in the comment section.
DISCLAIMER: This analysis is not intended to encourage any buying or selling of any particular securities. Furthermore, it should not be a basis for taking any trade action by an individual investor. Therefore, your own due diligence is highly advised before entering a trade.

XRPUSD - Loss of ≈90% from ATHAs for the rest of the cryptocurrency market, we are relatively bearish on XRP. Our view is based on several technical and fundamental factors. Technical factors are described lower in the text.
Meanwhile, fundamental factors include a strengthening dollar due to the FED's rising interest rates (which are likely to increase again during the current week), economic tightening, and a slowing global economy. These factors weigh on the stock market to which risk assets like cryptocurrencies are correlated. Therefore, we foresee weakness for both of these asset classes in the medium-term and long-term.
As a result, we think the current rally in the cryptocurrency market represents just a temporary relief before more selling takes over.
Illustration 1.01
Illustration 1.01 shows the hourly chart of XRPUSD. It also shows two trendlines. Trendline 1 connects peaks from 20th July 2022 and 22nd July 2022; this trendline acts as the short-term resistance. Trendline 2 is parallel to Trendline 1; it acts as short-term support.
Technical analysis - daily time frame
RSI and Stochastic are bearish. MACD is neutral. DM+ and DM- are due to perform bearish crossover, which will further bolster the bearish case for XRP. Overall, the daily time frame is bearish.
Illustration 1.02
Since April 2021, the Ripple cryptocurrency lost over 80% of its market cap.
Technical analysis - weekly time frame
RSI, MACD, Stochastic, DM+, and DM- are all bearish. Overall, the weekly time frame is bearish.
Please feel free to express your ideas and thoughts in the comment section.
DISCLAIMER: This analysis is not intended to encourage any buying or selling of any particular securities. Furthermore, it should not be a basis for taking any trade action by an individual investor. Therefore, your own due diligence is highly advised before entering a trade.

XRP vs BTC - Massive Upside Potential on the BreakoutXRPBTC is testing a long-term resistance trend going back to its January 2018 high. Getting past resistance here would most likely lead to a very high volume breakout. Its daily RSI is currently at 70 which is very bullish territory. As long as BTC can find support here, we should see fireworks. Failure to breakout might mean XRP will revisit the bottom of the blue falling wedge before retesting resistance again. I'm buying the breakout.

A macro view of the XRPUSD chart - WeeklyWith the lawsuit about to finish in the next few months or potentially see a settlement, here is my idea on where the price of XRP will go to.
On the weekly chart we are currently in a very tight spot where the price is coiling up for a big move to the upside. The MACD on the same time frame has also made a bullish cross and despite the recent retracement of the price that signal suggests a strong buy. I am also expecting to see the price of XRPUSD decouple from what both BTC and ETH are doing after the initial period after the lawsuit win against the SEC. The win will also trigger a bullish rally on all the alt coins too as that will be seen as a greenlight to all the markets. It is possible that even BTC will benefit from this positive outcome.
My first immediate targets are $1.30 and $1.76 in the next 4-6 weeks. If a settlement will be reached and Ripple and XRP will have the regulatory clarity in the US, then I will expect to see the price surpassing the previous all time high and go towards the $6 - $7 area. After that I will expect an initial pull back to the previous ATH $3.80 - $4.00 and then another leg up to $11 - $13 for this cycle.
For the BTC price to move substantial higher, we will need to see an approval of a spot ETF in the US or another country or countries to declare it as legal tender.
Good luck!

Understanding When XRP Will MOON MartyBoots here. I have been trading for 16 years and I am here to share my ideas with you to help the Crypto space.
Bitcoin Is trying to have a BIG move soon and we in CryptoCheck intend to be prepared for it $$$$$$
Understanding XEP chart is very important for the next bull market
DO NOT BE LEFT BEHIND
------------------------------------------------------------------------------------------------------------------------------------------------------------
If you want help trading Bitcoin or any other ALT coins hit me up , We will improve your trading . Have a look at the link below
------------------------------------------------------------------------------------------------------------------------------------------------------------

XRP triangle breakout 2 📐 Ripple is trying to break up this triangle 📐 and if successful I think there is chance for run to 1.03 and even higher.
ENTRY : local high @ 0.7693
STOPLOSS (SL) : local low @ 0.7033
TARGET (TP) : height of the triangle projected from midpoint of the local range (BUY STOP-LIMIT - SL) @ 1.03
REWARD RISK RATIO (RRR) : 3.9
INVALIDATION : when SL level hit
Check my other stuff in related ideas.
Please like👍, comment🗣️, follow me✒️, enjoy📺!
⚠️Disclaimer: I'm not financial advisor. This is not a financial advice. Do your own due dilingence.

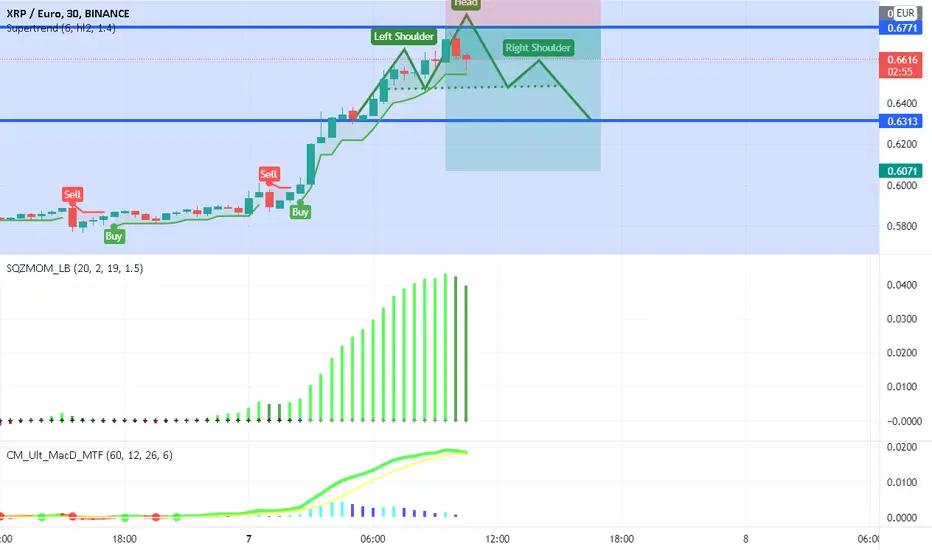
Short Vision on XRP EUR for 07/02/2022Hello Dear Traders,
You find below my analysis for XRP/EUR, this pair is in the sell zone. I expect the price to fall. According to my set of rules, in the M30 frame XRP/EUR will fall to 0.64 as I am showing in my chart. Our Daily Goal is 0.62.
Currently, XRP/EUR is moving towards the resistance level of 0.69 ,where there is some liquidity from this value we are looking for short-term selling opportunities of XRP/EUR.
Good Luck and enjoy your Bearish Market for today.
Entry:@0.68
TP1: 0.66
TP2: 0.64
TP3: 0.62
SL 0.72
As mentioned on previous posting, we oscillate daily with the market based on Human Behavior and Sentiment.
Feel free to share your thoughts and opinions in the comment section below, I will be glad to discuss my friends!
XRP Rejected by the Resistance After being overbought:
XRP was rejected by the resistance and it`s consolidating in the 0.59-0.89 range.
Looking forward to read your opinion about it.

XRP LONG,BREAKOUT SOON...Hi!, this is my XRP idea:)
TARGET - 1.0552 POTENTIAL PROFIT : 28.9%!
STOP LOSS - 0.7856 POTENTIAL LOSS : 4.03%!
Hope you guys like it!
NOT A FINANCIAL ADVOICE !!!

XRP - Bullish Pennant on the Daily, Don't Miss This Rocket Ship!This is a very simple chart. XRP has been flagging since its high in May. A nice 7 months of consolidation before the next move up. The daily MACD is showing a bullish cross over the signal line. It looks like all systems are a go once this breaks out. And when XRP takes off, you will want to be on this flight. I have already boarded and strapped myself in ;) However, keep in mind that BTC finds itself in a precarious position sub-$48k. Make sure you have an exit plan in case BTC decides to ruin the party.

XRPEUR vs BTCXRPUSD , XRPEUR , XRPBTC, XRPUSDT , XRPXMR , XRPETH , LONG aaaaaaaaassssssf ................


XRP is about to break the long-timed pattern, pump is on the wayin adaily chart as you can see it is stuck in the edge of the triangle, it is gonna break it.
For now it has more potential to break upward than downward.
IF it breaks up it will have 2 resistance where you can slightly take some portion of your profit.
First stage is 11%
2nd stage would be more profitable approx. 33%.
Bollinger Bands is also stuck, so it support the way where XRP might go
RSI is high but could be higher with the pump :))
Good Luck
NOT FINANCIAL ADVISE just educational purpose

XRP PARABOLIC = Coinbase Listing = MOONMartyBoots here. I have been trading for 14 - 15 years and I am here to share my ideas with you to help the Crypto space.
Bitcoin & ALT Coins are Setting up for a HUGE bounce and we in CryptoCheck intend to make lifechanging money
ALT SEASON IS NOW - DO NOT BE LEFT BEHIND
------------------------------------------------------------------------------------------------------------------------------------------------------------
If you want help trading Bitcoin or any other ALT coins hit me up , We will improve your trading . Have a look at the link below
------------------------------------------------------------------------------------------------------------------------------------------------------------
