I think XRP is about to take off.BTC is looking ripe for a pullback. When that happens Altcoins do one of two things. Go up or go down. Generally speaking here, most of the altcoins in this market have been pretty dead for some time and haven't seen much growth if any since BTC starting its rally in March. So its possible we might see the altcoin market grow when BTC pulls back.
That being said, Ive been following this market for years and I have always noticed that XRP lags a bit behind BTC. XRP is also one of the top altcoins that hasn't really had much growth compared to BTC. ETH has seen a good rise with BTC and it also looks like it is ready to pullback. But XRP hasn't really been doing much.
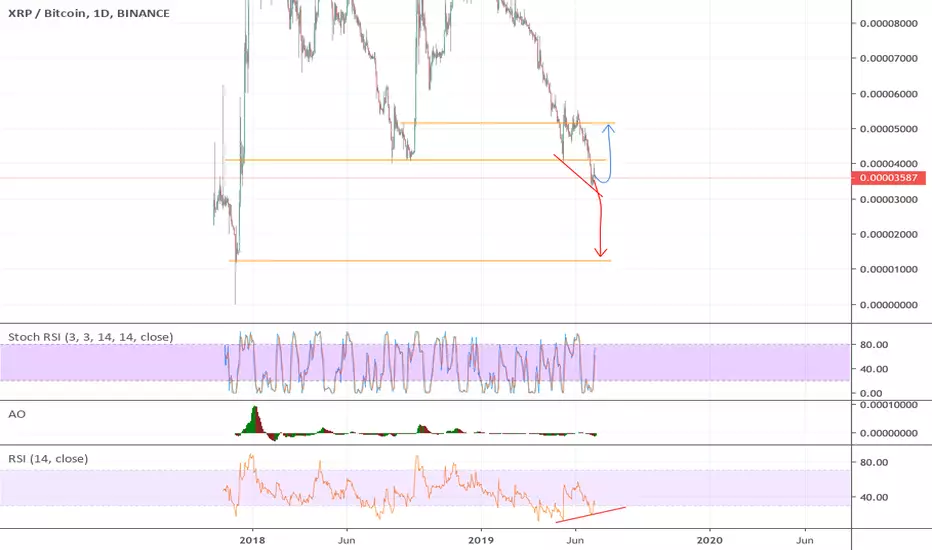
So take a look at this Daily chart of XRP/BTC and tell me what you think. Price is getting really close to the bottom trend of this triangle. Where historically it has increased in value rapidly. RSI levels are oversold. Theres some strong divergence with the RSI, unfortunately none with MACD so it's a mixed signal. But it's a nice confluence area and this is crypto, so 500% in a month is not unrealistic.
Happy trading :)
XRPLONGTERM


Xrp longs are building up ...Will we see a breakout to the top? Seems like longs are building up ...
...no trading advice!

XRP HODL Prices?If you cannot resist in wanting to buy XRP, Tron and really any marketing machine coin it looks like we have seen the yearly low. Now that XRP has retraced and made that recent move up we are now seeing some true support areas from Confluence lines made from FIb retrace and regular support/resistance through the year! The volume is dying off which also is a good time after big moved when going sideways with low volume to start accumulating some coin/stock


XRP is a buy from 0,666 devil nr doubling up towards 1,332 leetXRP is sitting on the 61.8 fib retracement for the next leg up.
Also on solid horizontal support from end 2017 and feb 2018
Worst case it could drop to 0.55 on trendline support from dec 2017

XRP longterm prediction 7 euro's, about to break outXRP is breaking out of the trendlindes within 3 days. I'm using the fibonacci retracement and extention tools and the elliot wave. 4th wave never drops into the wave 1 region.

XRPUSD "LAZY" LONG TERMThis idea has some market analysis.
BUT This is not a trade set up with a buy/sell signal.
This is simple attempt to predict future price movement for my personal pleasure! XRPUSD
using Fib, Elliot, G, Ichi, RSI, volumes and stochs on a candle chart.....
This is also granting that the MtGox whale does not short BTC soon and drag all crypto market down.
Hopefully he will short BTC in June where crypto usually peaks.
Can you ride this set-up. Of course you can!
BUT trade at your own risk!

XRP to edge lowerXRP will edge lower to a max low of 0.6$, mirroring my other prediction for a decline on bitcoin for todays trading. On the long term I am bullish on XRP but I don't think we will break out just yet!

XRP ShoppingLove to see it 0.18
RSI 14 - downtrend
MACD - just crossing - downtrend
Trend line possible to hit 0.18 or below.
Check those lines, Repetition of History.
Failed to go beyond 0.35 - in result downtrend, history.
-Personal interpretation.
-Have a nice day!
