XRPUSDT Weekly Chart Analysis | Next Bullish MoveXRPUSDT Weekly Chart Analysis | Major Resistance Levels Align for Next Bullish Move
🔍 Let’s break down the XRP/USDT weekly setup, highlighting key technical signals and major upside targets for the next rally.
⏳ Weekly Overview
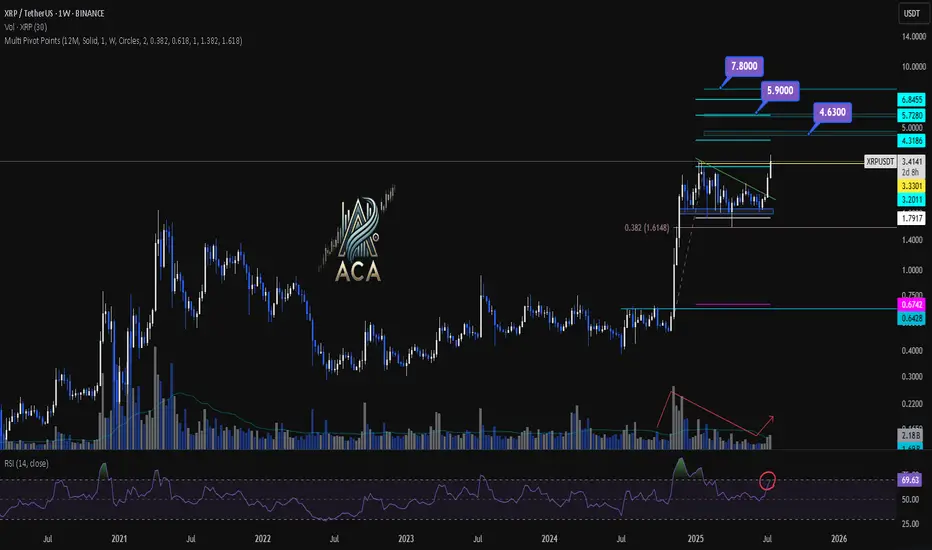
The weekly chart shows consolidation just below a major resistance, with price action tightening and preparing for a breakout. A recent correction found support near the 0.382 Fibonacci retracement level, which has acted as a springboard for renewed momentum. Notably, the R2 pivot point level aligns closely with this area, strengthening its importance as a decision zone for bulls.
🔺 Upside Targets & Confluences:
- First Target: $4.63 — This coincides with the R2 monthly pivot point and aligns with key Fibonacci extension targets, offering strong confluence for a reaction zone.
- Second Target: $5.90 — Our most realistic medium-term target, also backed by cluster resistance from both pivot analysis and fib projections.
- Final Target: $7.80 — This is the major Fibonacci extension level, marking the highest projected upside if momentum persists.
📊 Key Technical Highlights:
- Pivot Point R2 & Fibonacci Confluence: The R2 level reinforces a critical resistance, overlapping with the $4.63 Fibonacci target.
- Fibonacci Retracement: Price respected the 0.382 retracement during the latest correction, signaling healthy trend continuation.
- Volume Confirmation: An uptick in volume confirms that buyers are stepping in, supporting the bullish momentum.
- RSI Signal: RSI is entering the overbought zone, which typically indicates a strong surge in buying pressure and can mark the start of a momentum move.
🚨 Conclusion:
XRP is setting up for a major breakout as key technical levels align. Watch for a sustained move above $4.63 to unlock the $5.90 area, with a final potential push towards $7.80 if bulls maintain control. Volume expansion and an overheated RSI are both classic signs of an incoming momentum wave—keep your eyes on these levels for validation of the setup.
Xrpusdanalysis
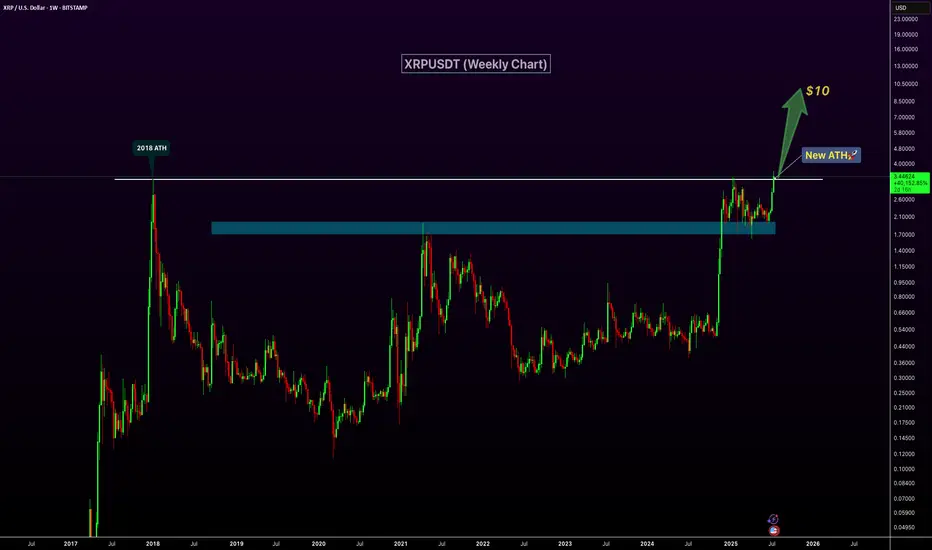
XRP Breaks 2018 High – New ATH Confirmed!XRP has officially broken above its 2018 peak, signaling a major bullish breakout and printing a new all-time high on the weekly chart. The previous resistance zone around $2.6–$3 has now flipped into strong support, confirming the strength of this move. With increasing volume and momentum behind the rally, XRP appears well-positioned for continued upside. The next key psychological target lies at $10, and current price action suggests a clear path toward that level. If bullish sentiment continues, this breakout could mark the beginning of a significant new uptrend.
DeGRAM | XRPUSD continues to move in the channel📊 Technical Analysis
● Aggressive breakout from the 8-week green consolidation box has pierced both the purple ’23 trend-cap and inner wedge roof; pull-backs are holding above the prior 2.71 swing, confirming a fresh demand flip.
● Price is now tracking the mid-July parabolic support inside the black rising channel; the next confluence lies at the channel crest / Feb supply 3.11, implied by the 40¢ measured move of the July flag.
💡 Fundamental Analysis
● CME CF announced a cash-settled XRP reference rate for institutional derivatives, boosting open interest and signalling deeper liquidity ahead of the 23 Jul SEC status hearing.
✨ Summary
Long 2.70-2.80; hold above opens 2.88 → 3.11. Invalidate on a 6 h close below 2.60.
-------------------
Share your opinion in the comments and support the idea with a like. Thanks for your support!

XRP new movement soon !XRP / USDT
XRP is on a long retest after breakout of accumulation zone weeks ago
successful retest here will result in strong bullish rally !
Keep an eye on it in the coming days 👀
XRP/USD (RIPPLE) BUYtitle: XRP/USD (RIPPLE) BUY
Asset: Crypto
Symbol: XRP/USD
Market Entry Price 1: $2.9450
Limit Entry Price 2: $2.7450
Stop Loss: $2.6450
Take Profit 1: $3.145 (close 10%)
Take Profit 2: $3.345 (close 25%)
Take Profit 3: $3.645(close 50%)
Take profit 4: $3.845 (close 75%)
Let any remaining Xrp run risk free
XRP Cools Near $3.00 Amid Overbought SignalsFenzoFx—XRP remains bullish after piercing $3.00 earlier this week but cooled near resistance. Trading around $2.90, Stochastic (~84) and RSI 14 (80) indicate overbought conditions, suggesting consolidation.
We anticipate a pullback toward $2.66 support before resuming the uptrend. Alternatively, a decisive break above $3.00 would target $3.21 next.

LIVE TRADE (XRP)Hello friends🙌
🔥Here we are with live trading Ripple, please follow capital management.
📈Given the resistance break, we can enter a buy trade and move with it to the specified targets.
🔥Follow us for more signals🔥
*Trade safely with us*

Ripple buy signalHello friends
Given the good growth we had, we entered a deep correction, and now we have the opportunity to buy step by step in the specified support areas with capital and risk management and move with it to the specified targets.
*Trade safely with us*

Xrp:The fate of Ripple in the long termhello friends👋
After a good price growth that we had, you can see that the buyers gradually exited and a triangle pattern was formed.
Now, according to the specified support, it should be seen whether buyers support Ripple or not...
You have to wait and nothing can be said until the failure of the pattern, but we suggest that you buy step by step with capital and risk management in the identified areas that are very good supports and move to the set goals.
And in the end, we must say that don't forget that we are in a strong upward trend, that the probability of the continuation of the Bister trend is the possibility of a fall...
🔥Follow us for more signals🔥
*Trade safely with us*

"XRP/USD: Bullish Raid Alert! Ride or Escape Fast!"🚨 XRP/USD HEIST ALERT: Bullish Loot Grab Before the Escape! (Thief Trading Style) 🚨
🌟 Greetings, Market Pirates & Profit Raiders! 🌟
(Hola! Oi! Bonjour! Hallo! Marhaba!)
🔥 Thief Trading Strategy Activated! 🔥
Based on ruthless technical + fundamental analysis, here’s how we SWIPE THE LOOT from XRP/USD (Ripple vs. Dollar). Follow the chart’s Long Entry blueprint—our target is the high-risk YELLOW ATR ZONE (overbought, consolidation, potential reversal). Beware of traps! Bears and cops lurk here, but we strike smart.
🏴☠️ ENTRY:
"Vault’s cracked—bullish loot is FREE GAME!"
Buy Limit Orders preferred (15-30 min timeframe near swing lows/highs).
Aggressive? Swipe instantly—just mind the cops (liquidity traps).
🛑 STOP LOSS (Save Your Loot!):
Swing Thieves: 4H recent wick low ($2.1500).
Risk Tactics: Adjust SL based on your trade size, orders, and guts.
🎯 TARGETS:
Main Take: $2.5400 (or escape earlier if momentum fades).
Scalpers: Longs ONLY! Trail your SL—no greedy holds!
💣 KEY DRIVERS (Why This Heist Works):
Bullish momentum brewing (check fundamentals, COT, on-chain data 👉go ahead to klick 🔗).
NEWS ALERT: Avoid fresh trades during high-impact news—protect open positions with trailing stops!
💥 BOOST THIS HEIST!
Hit 👍 LIKE, 🔔 FOLLOW, and 💬 COMMENT to fuel our next robbery plan. Together, we steal the market’s cash—EVERY. SINGLE. DAY.
📢 Final Warning: Markets shift FAST. Stay sharp, adapt, and CASH OUT BEFORE THE COPS ARRIVE.
🤑 Stay tuned—more heists incoming! 🐱👤🚀

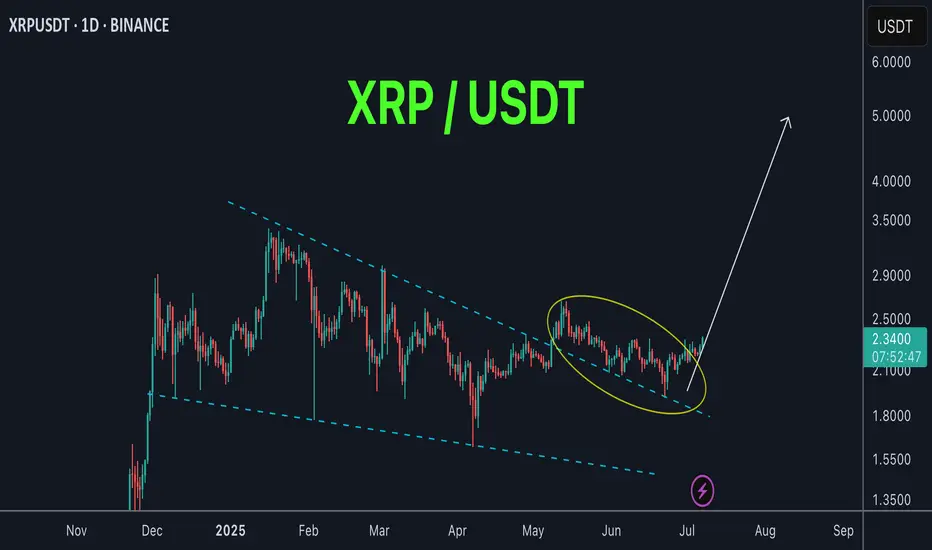
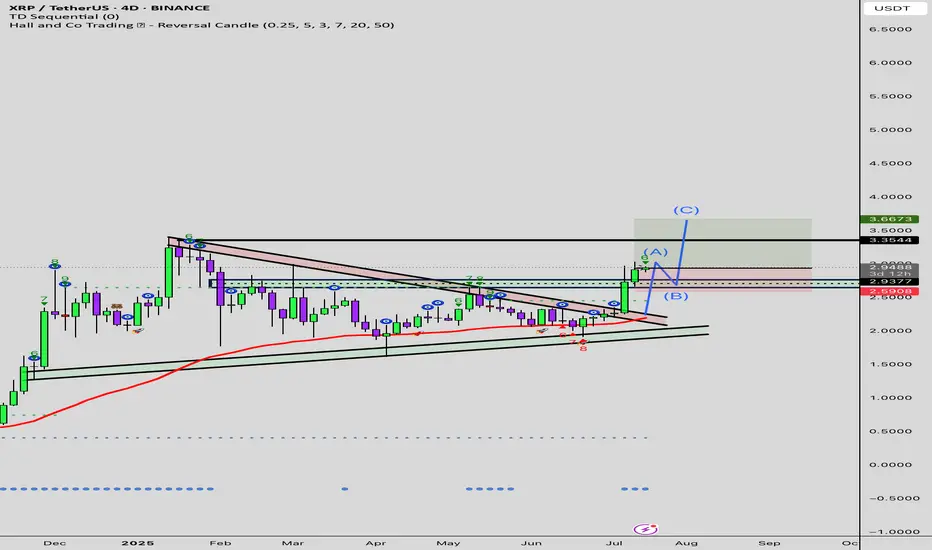
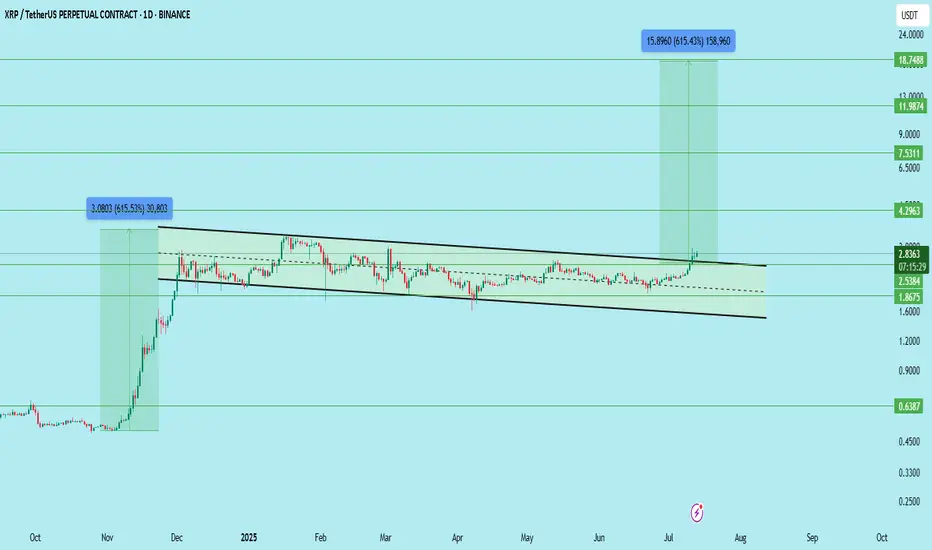
XRP/USDT – Long-Term Breakout Setup FormingXRP has broken out of a multi-month falling channel and is showing early signs of a macro bullish shift. However, price has printed a series of strong green candles, so waiting for a clean retest before entry is advised.
Key Levels:
Support Zones: 2.5384 | 2.00 | 1.8675
Resistance Zones: 2.8340 | 4.2963 | 7.5311 | 11.9874 | 18.7488
Breakout Level: 2.5384 (channel breakout and current structure retest area)
Setup Strategy:
Entry (Ideal): On retest near 2.53–2.60 support zone
Stop Loss: Below 2.00 (or tighter depending on risk appetite)
Target 1: 4.2963
Target 2: 7.5311
Target 3: 11.9874
Target 4 (Final): 18.7488
Upside Potential: Over 600% if the structure plays out fully
Structure Insight:
Multi-month falling channel breakout confirmed
Continuous green candles suggest short-term overextension
Safer entry lies in retest and hold of the breakout zone
Long-term accumulation zone forming between 2.53–2.83
This setup favors long-term investors and swing traders waiting for a macro move. Let the price come to you — avoid chasing.
DYOR | Not Financial Advice
#XRP #Ripple
XRP/USD: "Bandit’s Breakout" – MA Confirms the Profit Raid!🔥 XRP/USD HEIST ALERT: The Bullish Bank Robbery Plan (MA Breakout Strategy) 🔥
🌟 Attention, Market Pirates & Profit Bandits! 🌟
"The best traders are just thieves with a calculator."
🚨 Mission Brief (XRP/USD):
Based on Thief Trading tactics, we’re plotting a bullish heist on Ripple. High-risk, high-reward—police traps, fakeouts, and overbought zones be damned!
📌 ENTRY ZONE (Breakout or Pullback Heist)
"The heist begins at MA breakout!"
Buy Stop: Above 2.2200 (confirmed candle close).
Buy Limit: Near swing lows (15m/30m pullback).
🚨 Set an ALERT! Don’t miss the breakout.
🛑 STOP LOSS (Escape Route)
"No stop loss till breakout—then hide it like stolen cash!"
Thief SL: Nearest swing low (3H candle wick) ~2.1000.
Rebels adjust at own risk—your funeral, not mine. 😎
🎯 TARGETS (Profit Hideouts)
First Escape: 2.2400 (scalp & run).
Swing Bandits: Ride longer (trail SL advised).
⚡ SCALPERS’ NOTE:
Longs ONLY. Rich? Go all-in. Broke? Join swing heists.
Trailing SL = Your getaway car.
📡 MARKET CONTEXT (Why This Heist?)
Bullish momentum + consolidation breakout play.
Fundamentals? Check COT, on-chain, macro trends (check everything here 👉🔗🔗).
🚨 NEWS WARNING (Avoid Police Raids)
Avoid new trades during high-impact news.
Trailing stops = Your invisible cloak.
💥 BOOST THE HEIST!
"Like & Boost this idea—strengthen our robbery squad! More alerts = more stolen profits. 🚀💰
Next heist coming soon… Stay greedy, thieves. 😈

XRP/USDT Monthly Chart: History Repeating Itself?Hey traders! Let’s dive into this monthly XRP/USDT chart. I’ll be honest — I’m skeptical about this outcome, but let’s break it down because it could actually happen!
The chart screams déjà vu, with XRP’s price action mirroring the 2014-2018 period. Back then, XRP broke out from its 2014 ATH in 2017, leading to a massive rally. Fast forward to now, and we’re seeing a similar setup, but with a twist. XRP is struggling to break through the 2018 ATH resistance zone around $3.31, which reminds me of the Breakout Consolidation phase we saw in 2017. Historically, this consolidation led to a breakout, and the chart hints at a potential repeat!
If XRP breaks out soon, we could see a parabolic move, potentially targeting much higher levels. However, the current resistance is a tough hurdle, and if it fails, we might see a pullback to lower supports.
Key Levels to Watch:
Resistance: $3.31 (2018 ATH)
Support: $1.643 (previous consolidation low)
Breakout Target: To be determined (potentially parabolic)
Breakdown Risk: $0.650
I’m not fully convinced, but the setup is intriguing — could this be XRP’s moment to shine? What do you think? Let’s discuss below!

XRP Technical Analysis – Massive Breakout in Play!After months of tight consolidation inside a symmetrical triangle, XRP/USDT has finally broken out with strong bullish momentum on the daily timeframe.
🔹 Chart Pattern: Symmetrical Triangle
🔹 Breakout Confirmation: Daily candle closed above the descending trendline resistance
🔹 Support Zone: ~$2.00 – $2.20 (Held multiple times since April)
🔹 Breakout Level: ~$2.48 – $2.50
🔹 Next Resistance Levels:
▫️ $2.62 – Minor horizontal resistance
▫️ $3.39 – Major resistance from previous highs
▫️ $4.92 – Long-term macro target (measured move from triangle)
🧠 Why does this breakout matter?
✅ Strong Volume: Breakout happened with increased volume – a sign of genuine breakout
✅ Multi-month Base: The longer the consolidation, the stronger the breakout
✅ Support Respect: XRP respected the demand zone repeatedly, showing accumulation
✅ Momentum Building: A clean break could trigger trend-following bots and new buyers

XRPUSDT BINANCE:XRPUSDT Price broke above the downtrend line but faced resistance at 2.2770 dollars and started correcting. Key supports are at 2.1900 and 2.0800 dollars. If it bounces, resistances to watch are 2.2770, 2.3600, and 2.4620 dollars. Price is currently between key levels.
Key Levels:
Support: 2.1900 – 2.0800
Resistance: 2.2770 – 2.3600 – 2.4620
⚠️Contorl Risk management for trades.

DeGRAM | XRPUSD seeks to retest of the resistance line📊 Technical Analysis
● A third rebound from the rising purple support (green dots) printed a bullish engulfing that has already forced price back above the short-term grey down-trend, signalling a momentum shift.
● XRP is now coiling inside a contracting triangle capped by the purple resistance line near 2.40; the 18 ¢ consolidation width implies 2.45 on a break, while the April pivot at 2.65 lines up with the upper channel for the next objective.
💡 Fundamental Analysis
● Ahead of the 23 July SEC – Ripple status hearing, HSBC’s digital-asset unit announced a pilot using XRP for cross-border settlement, lifting social volume and spot bids.
✨ Summary
Buy 2.10-2.20; confirmed close above 2.40/2.45 targets 2.60-2.65. Thesis void on a 16 h close below 1.98.
-------------------
Share your opinion in the comments and support the idea with a like. Thanks for your support!

XRP Pattern Repeats—Next Move to $2.34?The XRP/USDT 1-hour chart is showing a compelling setup that may mirror a previously bullish price pattern. The left side of the chart highlights Pattern 1, which played out after a period of sideways consolidation followed by a breakout, resulting in a strong upward move. Now, price action is repeating a similar structure with nearly identical conditions forming.
In Pattern 1, XRP consolidated in a tight range, flipped the trend indicator from red to blue (suggesting a momentum shift), and then surged higher. This same transition is occurring again in the current market phase. Price has reclaimed the trend baseline, which has turned blue, hinting at growing buyer strength.
The idea here is that XRP could be preparing for another impulsive move to the upside, identical to what happened before. The setup is visually marked with a trade box showing entry, stop-loss, and target levels.
Trade Idea Based on Current Pattern
• Entry: 2.2849
• Target: 2.3436
• Stop-loss: 2.2520
• Reward-to-Risk (R:R): ≈ 1.78
• Potential Gain: 2.57%
• Potential Loss: 1.44%
The structure favors a long position, as long as the price holds above the 2.25–2.26 support range. A break below this could invalidate the setup and trigger the stop-loss. If the breakout is confirmed with volume, XRP could move rapidly toward the 2.34 level and possibly beyond.
This kind of fractal behavior, where patterns repeat themselves in similar market conditions, is common in crypto. With the trend indicator already flipping bullish and price forming higher lows, the probability of continuation looks solid—especially for short-term traders.
As always, trade with proper risk management, and be cautious of volatility that can trigger stop-hunts in tightly ranged zones.

XRP COIN NEXT VIEW Good Day 🌞 Folks i hope all of you are earning well 🥰
Am Still holding my #Xrp🔥🔥 CRYPTOCAP:XRP my next week View on Xrp price soon will jump above $3 so am just holding as of now ❣️🙏🏻 let's see what's next ✌🏻 those who are holding will get great 😃 opportunity to succeed. In below 👇🏻 mentioned chart 📉 you can see my holding trade still waiting for another Rocket 🚀 #xrp

XRP: A Trader's Gambit or an Investor's FortuneXRP at the Crossroads: A Trader's Gambit or an Investor's Fortune?
The digital asset XRP currently finds itself in a fascinating and precarious position, presenting a narrative so divided it could belong to two entirely different assets. For the short-term trader, the charts are painting a picture of tension and potential reversal, a technical puzzle where a wrong move could be costly. For the long-term investor, the horizon holds the promise of a revolutionary technology poised to disrupt a trillion-dollar industry, with price targets that seem almost unimaginable from today's standpoint. This analysis delves into this profound dichotomy, exploring the immediate bearish signals that tempt traders to short, while simultaneously mapping out the ambitious, utility-driven path that could lead XRP to astronomical new heights.
The Short-Term Squeeze: A Technical Tightrope Walk
Observing XRP's recent price action is like watching a high-stakes chess match. The token has demonstrated a textbook reaction to a critical trendline, a move that likely ensnared traders who were too quick to bet on a price collapse. By bouncing precisely where technical theory suggested it might, it "trapped" these early sellers, forcing them to reconsider their positions as the price stabilized and began to creep upward.
Following this maneuver, the price has embarked on a cautious ascent from the $2.20 support zone. As of early July, XRP has managed to climb above the $2.2320 mark and is holding its ground above the 100-hourly Simple Moving Average, both of which are constructive short-term signals. The immediate focus has now shifted to a key resistance level at $2.285. A decisive break above this ceiling could signal that the bulls have taken control, potentially triggering a new wave of buying pressure.
However, a significant hurdle lies in wait. On the hourly chart, a short-term contracting triangle has formed, with its upper boundary creating firm resistance at the $2.280 level. Such patterns are known to be harbingers of volatility; they represent a period of consolidation and coiling energy before the price makes a powerful move in one direction. While a breakout to the upside is possible, the bearish case remains equally compelling.
This bearish outlook is centered on a previously marked supply zone that the price is now approaching. A supply zone is an area on the chart where a glut of sell orders is historically clustered. If the price pushes into this zone without first building a stronger foundation of support by drawing in buying interest (grabbing liquidity) from lower levels, it risks hitting a brick wall. The selling pressure could overwhelm the buying momentum, leading to a swift and strong rejection. For traders anticipating this outcome, it presents a prime opportunity to initiate a short position, betting on a significant price decline. The level of $2.28 is therefore not just a resistance point; it's a critical battleground that will likely dictate the next major directional move.
The Long-Term Vision: The $35 Moonshot Fueled by Global Remittances
To truly understand the fervent belief held by long-term XRP holders, one must look beyond the flickering candles of the hourly charts and focus on the asset's fundamental purpose. The most powerful bullish argument for XRP is not based on technical patterns, but on its potential to fundamentally reshape the global remittance market.
The remittance industry—the process of individuals sending money across borders to their families—is a colossal and ever-growing sector of the global economy. Projections indicate that this market will swell from nearly $800 billion to over $1.06 trillion by 2029. For decades, this system has been notoriously inefficient, characterized by exorbitant fees that eat into the funds sent home and settlement times that can stretch for days, leaving families waiting for critical support.
This is the problem that Ripple, the technology company behind XRP, was designed to solve. By utilizing XRP as a neutral bridge asset, Ripple's payment network can facilitate cross-border transactions in a matter of seconds, not days. The cost of these transactions is a tiny fraction of what traditional banking intermediaries charge. This value proposition of speed and savings is not merely theoretical; Ripple has been actively forging partnerships to implement this technology in key remittance corridors, including those connecting to Mexico, the Philippines, Brazil, and nations in the Middle East.
The audacious price prediction of $35 per XRP stems from a model that quantifies this potential. The logic unfolds as follows: if XRP were to successfully capture a significant portion, say 25%, of the projected $1.06 trillion remittance market by 2029, the network's intrinsic value would be immense. Applying a valuation multiple similar to those of established payment processing giants, the network could be valued at over $500 billion. With a circulating supply of approximately 60 billion tokens, a simple calculation yields a fundamental value of around $8.90 per XRP.
However, the cryptocurrency market is driven by more than just underlying utility; it is heavily influenced by demand, speculation, and investor sentiment. The model accounts for this by applying a "demand premium." If widespread adoption and recognition of XRP's role create a surge in demand, this could act as a multiplier on its fundamental value. A 4x demand premium, a figure not uncommon during crypto bull markets, applied to the $8.90 base valuation, is what brings the target to an eye-watering $35.56. This forecast, while undeniably ambitious, is anchored in the tangible prospect of solving a multi-trillion-dollar real-world problem.
Bridging the Gap: Catalysts for a New Era
The journey from a price of around $2.22 to a potential $35 is long, and its success hinges on several critical factors. A major cloud that long hung over XRP was its legal battle in the United States, which created uncertainty and stifled institutional adoption. However, significant legal victories have provided much-needed regulatory clarity, affirming that XRP itself is not inherently a security. This has been a pivotal de-risking event, opening the doors for financial institutions to begin integrating and utilizing the asset with newfound confidence.
The next major potential catalyst on the horizon is the approval of a spot XRP Exchange-Traded Fund (ETF). Following the successful launch of ETFs for other major cryptocurrencies, many in the industry see an XRP ETF as a logical next step. Such a product would be a game-changer, providing a regulated and easily accessible bridge for a vast pool of capital from traditional finance to flow into the XRP market. It would allow pension funds, asset managers, and retail investors to gain exposure to XRP through their standard brokerage accounts, potentially triggering a massive wave of demand.
Of course, the path is not without its challenges. XRP operates in a competitive environment, with other blockchain projects and even modernizing traditional systems like SWIFT vying for a piece of the cross-border payments pie. Continued innovation, network growth, and the expansion of strategic partnerships will be paramount to securing its market position.
Conclusion: A Dichotomy of Destiny
In its current state, XRP embodies the dual nature of the cryptocurrency market. It is at once a playground for nimble traders, who see the immediate risks and rewards in its tight price consolidation, and a beacon for long-term visionaries, who see the blueprint for a future global financial standard. The bearish case for a short-term rejection from the $2.28 supply zone is technically sound and warrants caution. A failure to break through this level could easily send the price back down to retest lower supports.
Simultaneously, the long-term bullish thesis is one of the most compelling in the entire digital asset space. It is not built on hype alone, but on a clear and demonstrable utility aimed at a vast and inefficient market. The prospect of a $35 XRP is a testament to this potential.
Ultimately, the decision of whether to view XRP as a short-term trade or a long-term investment is a reflection of one's own timeline, risk tolerance, and belief in its underlying technology. XRP is at a critical inflection point, and whether it succumbs to short-term pressures or breaks free to pursue its grander ambitions will be a defining story in the continuing evolution of finance.

XRP: Break Above $2.338 Opens Path to $2.480FenzoFx—Ripple (XRP) eased near weekly highs of $2.338, with Stochastic and RSI 14 signaling overbought conditions. The trend stays bullish above the anchored VWAP or $2.165, but consolidation toward $2.2240 is expected before resuming.
A break above $2.338 would target the next supply zone at $2.480.

#XRP/USDT#XRP
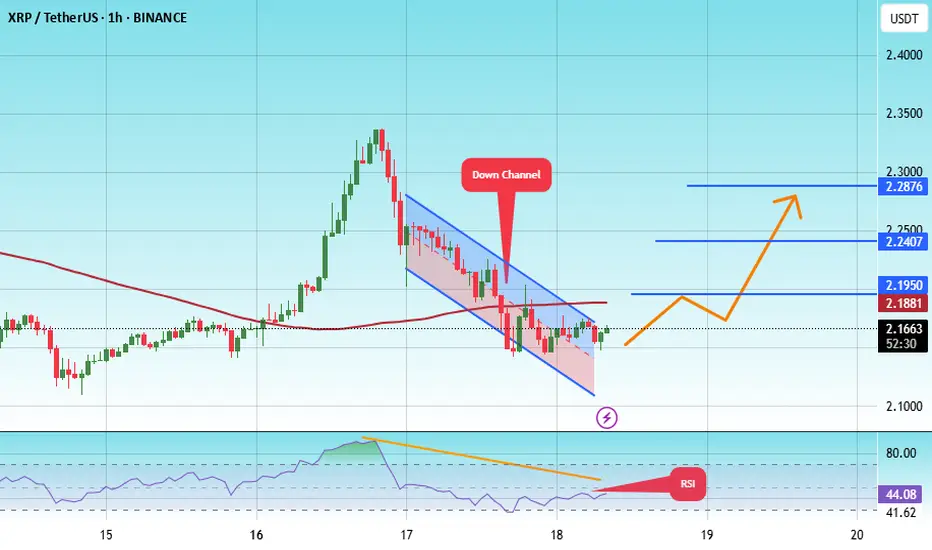
The price is moving within a descending channel on the 1-hour frame, adhering well to it, and is heading towards a strong breakout and retest.
We are experiencing a rebound from the lower boundary of the descending channel, which is support at 2.11.
We are experiencing a downtrend on the RSI indicator that is about to be broken and retested, supporting the upward trend.
We are looking for stability above the 100 Moving Average.
Entry price: 2.16
First target: 2.20
Second target: 2.24
Third target: 2.28
XRP Breakdown Ahead? Don’t Get Caught LongYello, Paradisers! Are you about to fall into a classic trap on XRP? The signs are stacking up, and if you're not careful, this move could catch a lot of traders on the wrong side of the market.
💎XRPUSDT is showing clear signs of weakness. A bearish CHoCH (Change of Character) has formed, and an inverse Cup & Handle pattern is currently playing out. On top of that, price action has decisively broken below the key support trendline. These signals together significantly increase the probability of a deeper bearish move in the coming days.
💎From the current price level, XRP is offering a 1:1 risk-to-reward setup. While this may attract more aggressive or short-term traders, the safer and more strategic approach is to wait for a proper pullback before entering. That would allow for a more favorable risk-to-reward and confirmation of the trend direction, reducing the likelihood of being caught in short-term noise.
💎It’s also crucial to watch the invalidation level. If XRP manages to break back above that zone and close a candle above it, this would invalidate the current bearish idea entirely. In such a case, it's better to stay patient and wait for clearer price action before making any decisions.
🎖Strive for consistency, not quick profits. Treat the market as a businessman, not as a gambler.
MyCryptoParadise
iFeel the success🌴

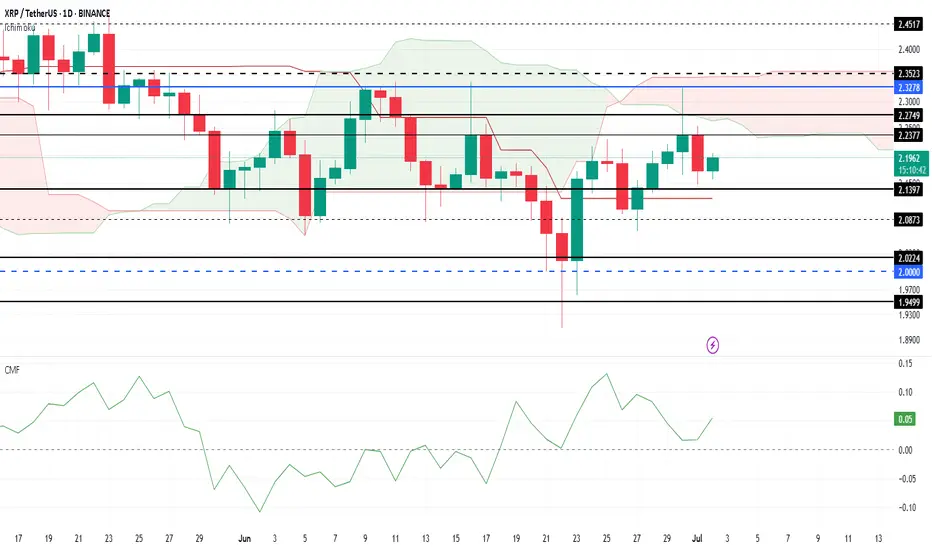
XRP Price Today: Rising Outflows Hinder RecoveryXRP has experienced notable volatility throughout June, with the altcoin failing to break through the $2.32 resistance level. Despite multiple attempts, XRP remains consolidated below this critical price point.
This price action indicates a lack of bullish momentum in the short term, making further gains challenging unless the resistance is breached.
The Ichimoku Cloud is turning negative , suggesting that bearish momentum could intensify for XRP. With the cloud positioned above the candlesticks, it signals further pressure on the price.
Additionally, rising outflows are visible on the CMF, as the indicator moves closer to the zero line, adding to the negative outlook.
If selling pressure continues to mount, XRP could fall below its support at $2.13 , potentially slipping to $2.02. This would mark a significant decline and invalidate the bullish thesis, signaling that XRP’s upward momentum could be at risk in the near future.