A complete review of the popular Ripple currency in Elliott stylAccording to the complete review I did on the previous rising trend, I came to the conclusion that this rise was done during a complete wave (ABC).
as a result :
We have to wait for the completion of a full 5 waves.
According to my research, we are now in wave 3 of decline.
Wave 3 itself is an extended wave and 5 waves, which has already completed 3 waves out of 5 waves and we are currently making wave 4 from wave 3.
This wave is erosive and with many fluctuations.
Wave 4 itself moves in the form of (ABC), which is currently being created as wave (A).
Make the most of the fluctuations of this wave.
Note: This trend is a trend (ND.A), so if you use Fibonacci, the safest level to take the price floor is 50%.
In this trend model, we see high volatility and large price shadows, so if you use 50% fibo, set your loss limit to 83%.
(be successful and profitable)
Xrpusdanalysis

XRP: If we break we buy!!XRP
Intraday - We look to Buy a break of 0.3772 (stop at 0.3659)
Short term momentum is bullish. 0.3752 has been pivotal. A break of bespoke resistance at 0.3700, and the move higher is already underway. We look for gains to be extended today.
Our profit targets will be 0.4044 and 0.4234
Resistance: 0.3700 / 0.3800 / 0.3900
Support: 0.3600 / 0.3500 / 0.3400
Please be advised that the information presented on TradingView is provided to Vantage (‘Vantage Global Limited’, ‘we’) by a third-party provider (‘Signal Centre’). Please be reminded that you are solely responsible for the trading decisions on your account. There is a very high degree of risk involved in trading. Any information and/or content is intended entirely for research, educational and informational purposes only and does not constitute investment or consultation advice or investment strategy. The information is not tailored to the investment needs of any specific person and therefore does not involve a consideration of any of the investment objectives, financial situation or needs of any viewer that may receive it. Kindly also note that past performance is not a reliable indicator of future results. Actual results may differ materially from those anticipated in forward-looking or past performance statements. We assume no liability as to the accuracy or completeness of any of the information and/or content provided herein and the Company cannot be held responsible for any omission, mistake nor for any loss or damage including without limitation to any loss of profit which may arise from reliance on any information supplied by Signal Centre.


XRPUSDT 12h Medium-term trade - our target $0,44At the beginning of the month, we published the XRPUSDT trading pair idea on the daily time frame to cover the last two years of trading and show the main liquidity zones.
Then we wrote that in the coming days the main task for buyers is to keep the XRP price above $0,30.
Well, 11 days have passed and at the moment, XRPUSD buyers have completely coped with this task.
Accordingly, those who like or believe in the Ripple project, or those who care about risk management in trades, can issue the following order:
Entrance $0,315-0,325
Stop $0,2874
TP - $0,44
P/L ratio - 3.7/1
This is the target for medium-term trade. The global growth target is higher, but more on that in our next reviews of the XRPUSDT trading pair.
_______________________________
Since 2016 , we have been analyzing and trading the cryptocurrency market.
We transform our knowledge, trading moods and experience into ideas. Each "like under the idea" boosts the level of our happiness by 0.05%. If we help you to be calmer and richer — help us to be happier :)

XRP Future | What can i say?XRP amazing one.
Now's in strong dump with all market and waiting for news about BTC to start the growing
Do not miss an awesome chance to join the trade.
Add the coin to your attention list
Best wishes
Thanks for your comments and likes

XRP vs SEC = The House Always WinsRemove any emotion you have with your XRP bag and just take a second to look at the dynamics of this entire thing.
We can all buy cum rocket, and poop bucket and even HEX or Dogecoin which are extremely risky and speculative in itself - but we can't buy XRP?
Wait a minute you're telling me we can trade all these goofy coins, but not XRP?
I can buy a bunch of trash on coinbase, but for some reason we can't buy XRP?
Look at Ripples latest tweets,
If SEC wins lawsuit, Ripple CEO Brad Garlinghouse says the company would leave the United States - Ripple CEO
(hmm - they're telling you what's going to happen - in crypto there are no read between the lines it's all out in front of you on the public ledger)
Unfortunately I see no path up. This will continue its road to 0 - ultimately getting delisted and maybe people around the world will use XRP to some extent, but most of the world has already discovered USDC, USDT, BUSD and many many other ways to send money almost instantly.
The truth is, once trust is eroded - which it has - the SEC is not going to let some random coin win against its CBDC.
Just my $.02 - feel free to tear me a new one in the comment section. BINANCE:XRPUSD

XRP: If we break we buy!!XRP
Intraday - We look to Buy a break of 0.3374 (stop at 0.3288)
Although the bears are in control, the stalling negative momentum indicates a turnaround is possible. Short term momentum is bullish. 0.3362 has been pivotal. 0.3372 has been pivotal. A break of 0.3372 is needed to confirm follow through bullish momentum.
Our profit targets will be 0.3619 and 0.3719
Resistance: 0.3200 / 0.3300 / 0.3370
Support: 0.3100 / 0.3060 / 0.3000
Please be advised that the information presented on TradingView is provided to Vantage (‘Vantage Global Limited’, ‘we’) by a third-party provider (‘Signal Centre’) . Please be reminded that you are solely responsible for the trading decisions on your account. There is a very high degree of risk involved in trading. Any information and/or content is intended entirely for research, educational and informational purposes only and does not constitute investment or consultation advice or investment strategy. The information is not tailored to the investment needs of any specific person and therefore does not involve a consideration of any of the investment objectives, financial situation or needs of any viewer that may receive it. Kindly also note that past performance is not a reliable indicator of future results. Actual results may differ materially from those anticipated in forward-looking or past performance statements. We assume no liability as to the accuracy or completeness of any of the information and/or content provided herein and the Company cannot be held responsible for any omission, mistake nor for any loss or damage including without limitation to any loss of profit which may arise from reliance on any information supplied by Signal Centre.

XRPUSDT 1D XRP buy zone for medium-term trade is already closeFor more than a year, Ripple price has been falling in a downtrend channel.
Currently, the XRP price is at the bottom of the channel and is trying to form a reversal pattern.
If in the coming days, the buyers do not allow the Xrpusdt price to fix below $0.30, it will be a good signal that the bottom has been found. And when aggressive purchases appear, as soon as the price will be approaching this level, increased trades volumes - it will be an excellent signal to switch to the side of stronger buyers. Well, then it will be possible to start working out the blue scenario
If the situation on the market allows sellers to fix the price of Xrpusd below $0.30, then the way will be opened for the continuation of the fall, at least by -20%. In this case, the liquid level from which it is worth looking at purchases again will be around $0.25
_______________________________
Since 2016 , we have been analyzing and trading the cryptocurrency market.
We transform our knowledge, trading moods and experience into ideas. Each "like under the idea" boosts the level of our happiness by 0.05%. If we help you to be calmer and richer - help us to be happier :)


XRP LONG Most assets in a level of accumulation here so again paitents will be need to take advantage with leverage, xrp hit the 4hr ob+fvg we looked at for the retrace from .37, if the market is to see a bullish week then well wait for asia/london session for the manipulation to occur then we can get ourselfes involved, wait for lower timeframe level of accumaltion once we see a clean level of EQH/EQL well wait for the manipulation then enter on the market structure shift

XRP/USD XRP currently approaching to trendline with strong momentum.
Looking for drop all the way down to 0.30$

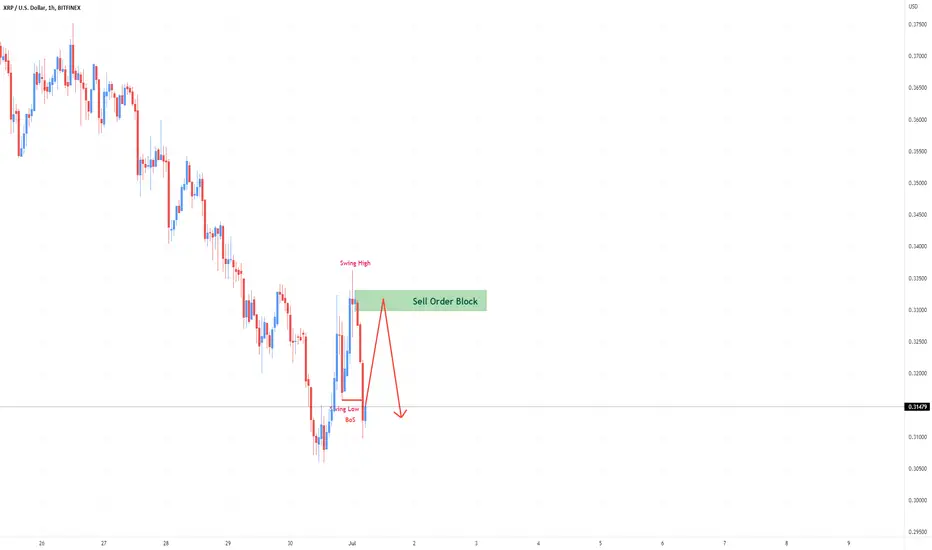
XRPUSD Chart H1Here is my view for XRPUSD on H1. The price could go down, you can put a pending order on the Order block or find an entry on LTF within OB Zone. Trade Safe!
XRPUSD Chart H1Here is my view for XRPUSD on H1. The price could go up, you can put a pending order on the Order block or find an entry on LTF within OB Zone. Trade Safe!

XRP: If we break we sell!!XRP
Intraday - We look to Sell a break of 0.3188 (stop at 0.3281)
Daily signals are bearish. Trend line support is located at 0.3190. A break of bespoke support at 0.3180, and the move lower is already underway. Expect trading to remain mixed and volatile.
Our profit targets will be 0.2952 and 0.2902
Resistance: 0.3300 / 0.3400 / 0.3480
Support: 0.3180 / 0.3100 / 0.3000
Please be advised that the information presented on TradingView is provided to Vantage (‘Vantage Global Limited’, ‘we’) by a third-party provider (‘Signal Centre’) . Please be reminded that you are solely responsible for the trading decisions on your account. There is a very high degree of risk involved in trading. Any information and/or content is intended entirely for research, educational and informational purposes only and does not constitute investment or consultation advice or investment strategy. The information is not tailored to the investment needs of any specific person and therefore does not involve a consideration of any of the investment objectives, financial situation or needs of any viewer that may receive it. Kindly also note that past performance is not a reliable indicator of future results. Actual results may differ materially from those anticipated in forward-looking or past performance statements. We assume no liability as to the accuracy or completeness of any of the information and/or content provided herein and the Company cannot be held responsible for any omission, mistake nor for any loss or damage including without limitation to any loss of profit which may arise from reliance on any information supplied by Signal Centre.

XRP LONGWhile the market looks to be offered some very short term relief we look to take advantage.
Will wait for price to come into the ote of the current range placing bids .30 which is inside the 4hr fvg also change timeframe to see.
For leverage place your SL below the low .287 DO NOT OVER LEVERAGE!!!
For spot place a sell order and the same low this allows price to close if we seek the sell side liquidity helps protect your account

XRP ForecastAfter the price target was reached:
I expect a reversal to the $0.42 level before heading lower again.
Looking forward to read your opinion about it.

XRPLikely hit a generational bottom here. A push to the 3.618% fib extension of the HTF intermediate wave count should end somewhere around $2.30 in feb 2023.

XRP/USD Multi-Timeframe Analysis ! Hello Traders, here is the full analysis for this pair, let me know in the comment section below if you have any questions, the entry will be taken only if all rules of the strategies will be satisfied. I suggest you keep this pair on your watchlist and see if the rules of your strategy are satisfied. Please also refer to the Important Risk Notice linked below.

XRPEnd of correction in sight, which might coincide with the possible end of the SEC lawsuits against Ripple.
XRP, has broken the May 12, 2022 low of about $0.33 as expected, we are still expecting it to go lower. A target of around $0.26 is expected in the coming days/week of which we should start seeing some reversal signs in the crypto market. Bitcoin & Ethereum are the ones leading the markets lower, it wouldn't be surprising to see the altcoins starting this bull run.
Alternative
$0.17 is also in sight but highly unlikely because of the structure completing at $0.26, which coincides with the 100% extension of the (W) leg in white completing (Y) leg in white, at the bottom trendline channel.

XRPUSD Chart H1Here is my view for XRPUSD on H1. The price could go down, you can put a pending order on the Order block or find an entry on LTF within OB Zone. Trade Safe!

XRPUSD Idea H4Here is my view for XRPUSD on H4. The price could go down, you can put a pending order on the Order block or find an entry on LTF within OB Zone. Trade Safe!

XRPUSD LONGI would consider this pennant/triangle as an accumulation pattern.
Open position now or when it breaks from a triangle.
SL: 0.37
TP 1: 0.52
TP 2: 0.55
TP 3: 0.58
