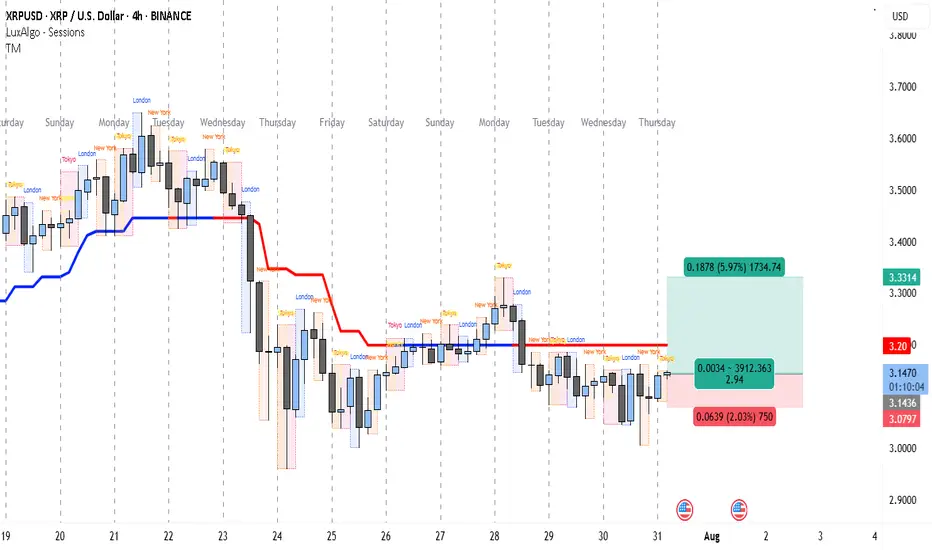
XRP’s 1:3 R:R Setup Could Pay Off FastThe 4-hour chart for XRP/USD indicates a market that has been under selling pressure since the sharp drop around July 23rd, where price broke down from the 3.40+ range. Since then, XRP has been struggling to reclaim higher levels, with the red trend indicator line (likely a moving average or trend-follow tool) acting as a persistent dynamic resistance.
After bottoming near the 3.05 zone on July 25th, the price moved into a sideways consolidation, repeatedly testing both the lower range (around 3.08) and upper range (around 3.20). This tight range suggests accumulation or distribution ahead of a bigger move.
Currently, the chart shows a potential long setup triggered around 3.1450, with a stop loss just below 3.0797 and a take profit target at 3.3314. This setup aims to capture a breakout from the consolidation zone toward the previous resistance area just below 3.35. The risk-to-reward ratio is favorable (close to 1:3), making it an attractive trade for short-term swing traders.
The target level aligns with the price area before the breakdown on July 23rd, where sellers previously gained control. Breaking through that level could signal a short-term trend reversal. However, the price still needs to clear the 3.20 resistance with a strong candle close to confirm bullish momentum.
Trade Setup
• Entry: 3.1450 (current level, inside consolidation support)
• Stop Loss: 3.0797 (below recent swing low)
• Take Profit: 3.3314 (prior resistance zone)
• Risk-to-Reward Ratio: ~1:2.94
• Trade Bias: Short-term long aiming for breakout from consolidation
Xrpusdbuy
$500 Million XRP Accumulation To Drive 15% Price Rise to ATHBINANCE:XRPUSDT is currently trading at $3.20, which places it 14% away from reaching its ATH of $3.66. The support at $3.38 is crucial, and securing it could lead to further gains.
BINANCE:XRPUSDT has been seeing significant inflows in the past three days. Over 163 million XRP, worth around $519 million , have been accumulated by investors. This buying surge suggests that a wave of optimism is returning to the market, signaling that investors are positioning themselves for a potential price increase.
If BINANCE:XRPUSDT can reclaim support at $3.38 , it will be well-positioned to push past its ATH and reach new highs. This would mark a significant milestone for the altcoin, setting the stage for further price gains.
However, should the investor sentiment shift and selling pressure increase, BINANCE:XRPUSDT could face a decline. If the price falls below $3.00, it could slide to $2.96 or lower , invalidating the bullish thesis.

Xrp - The final bullish breakout!💰Xrp ( CRYPTO:XRPUSD ) will create new all time highs:
🔎Analysis summary:
After a consolidation of an incredible seven years, Xrp is finally about to create new all time highs. With this monthly candle of +40%, bulls are totally taking over control, which means that an altcoin season is likely to happen. And the major winner will simply be our lovely coin of Xrp.
📝Levels to watch:
$3.0
🙏🏻#LONGTERMVISION
SwingTraderPhil

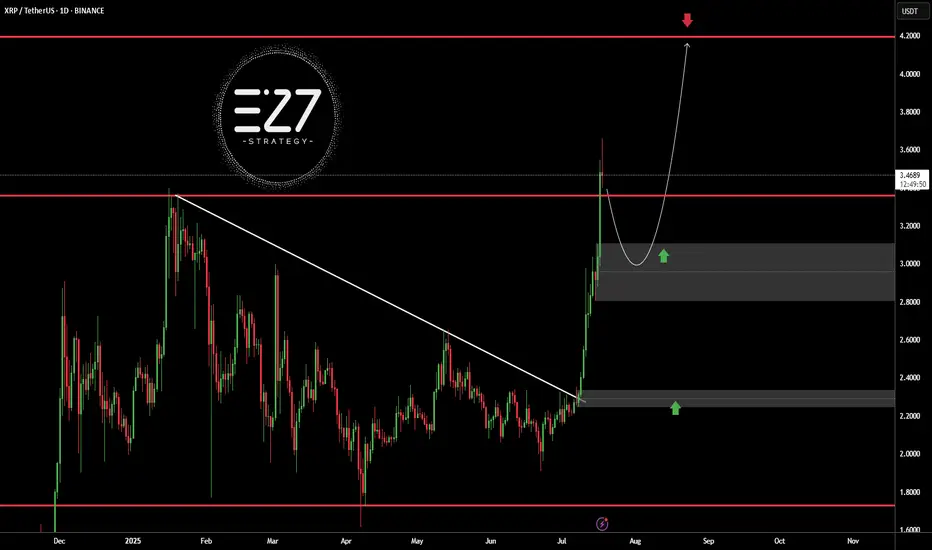
XRPUSDTBINANCE:XRPUSDT broke above its long-term downtrend line and surged to the $3.5000 resistance area, but is now undergoing a correction. The current bullish structure, with a higher high and higher low, suggests the trend remains upward. A pullback toward the $3.0000 demand zone is likely and would be a healthy retracement. Holding this area could trigger a continuation toward the key resistance at $4.2000.
Key Level Price
Main Support $2.2000
Main Resistance $4.2000
Best Buy Range $2.9500 – $3.1500
Best Sell Range $4.1000 – $4.2000
Investment Risk (Buying) Medium
⚠️Please control RISK management
XRP : Long term analysisHello friends🙌
🔊Considering the great growth that the price has had and has set a new ceiling, be careful because we are at the ceiling and when we are at the price ceiling, we should always expect a price correction...
⚠Now, given the strong upward trend we have, you can buy with risk and capital management, but our suggestion is lower prices for the possibility of a correction and the possibility of a reversal pattern.
So we have identified important support levels for you and we have also identified price targets.
🔥Follow us for more signals🔥
*Trade safely with us*

Xrp - This is the bullrun breakout!🔑Xrp ( CRYPTO:XRPUSD ) breaks the triangle now:
🔎Analysis summary:
After the recent bullish break and retest, Xrp managed to already rally another +100%. This is a clear indication that bulls are still totally in control of cryptos and especially Xrp. It all just comes down to the all time breakout, which will then lead to a final parabolic rally.
📝Levels to watch:
$3.0
SwingTraderPhil
SwingTrading.Simplified. | Investing.Simplified. | #LONGTERMVISION

The trend is your friend!Still respecting the trend. Maybe this week a push to the upside of 3.80 maybe 4.00

XRP's New Dawn: Beyond Bitcoin, Towards a Double-Digit Horizon
The cryptocurrency landscape is witnessing a seismic shift, and at its epicenter is XRP. In a stunning display of market dominance, the digital asset has embarked on a historic rally, fundamentally altering its perception and potential. Leaving the market's traditional bellwether, Bitcoin, in its wake with a colossal 277% outperformance over the past year, XRP has shattered its previous records. The token recently soared to a new all-time high of $3.66, pushing its market capitalization beyond the monumental $210 billion mark for the first time. This explosive growth, fueled by a confluence of regulatory triumphs, institutional validation, and overwhelming market momentum, has ignited the community and brought a once-fanciful question to the forefront of serious financial discussion: Is a $10 valuation the next logical destination for XRP?
This article delves into the multifaceted narrative behind XRP's meteoric ascent. We will dissect its remarkable outperformance against Bitcoin, explore the pivotal legal and regulatory victories that cleared its path, analyze the flood of institutional capital now entering the ecosystem, and examine the technical and on-chain data that suggests this rally may have only just begun.
Chapter 1: A Declaration of Independence - XRP's Decoupling from Bitcoin
For most of its existence, the cryptocurrency market has marched to the beat of Bitcoin's drum. Its price movements dictated the sentiment and direction for nearly all other digital assets. The year 2025, however, will be remembered as the year XRP declared its independence. The asset's 277% yearly surge against Bitcoin is not a mere statistical anomaly; it represents a fundamental rerating by the market, a recognition of XRP's unique value proposition, which is now unburdened by past uncertainties.
This divergence is starkly visible in recent trading. During the month of July alone, XRP appreciated more than 35% against Bitcoin, a powerful indicator of shifting capital flows and investor preference. While Bitcoin's narrative remains firmly rooted in its identity as "digital gold" and a hedge against inflation, XRP's story has evolved into one of proven utility and regulatory legitimacy. This newfound clarity has allowed its price to reflect its potential as a bridge currency for global payments and a cornerstone of a new, more efficient financial infrastructure.
The psychological impact of this rally has been profound. Prominent personalities like Dave Portnoy have publicly lamented selling their XRP holdings prematurely, echoing a sentiment of regret that is likely widespread among investors who exited their positions during the long years of legal ambiguity. This fear of missing out, while a potent market force, is not the sole driver of the current momentum. The rally is built upon a much sturdier foundation of institutional adoption and clear fundamental catalysts, suggesting a more sustainable trend than the speculative frenzies of the past.
Chapter 2: The Victory Lap - Regulatory Clarity as Rocket Fuel
The single most significant factor unlocking XRP's potential has been the definitive conclusion of its long and arduous legal battle with the U.S. Securities and Exchange Commission (SEC). The lawsuit, initiated in late 2020, had acted as a lead weight on the asset, alleging that Ripple's sales of XRP constituted an unregistered securities offering. This created a cloud of regulatory risk that kept many institutional investors and potential partners on the sidelines, particularly in the United States.
The tide began to turn with a landmark court ruling that determined XRP, when sold on public exchanges to retail customers, did not meet the definition of a security. This decision was a watershed moment, providing the legal clarity the secondary market desperately needed. The final chapter of this saga unfolded in 2025 as the SEC opted to drop its appeal and the parties moved to finalize a settlement. This resolution effectively ended the years of uncertainty that had suppressed XRP's value and stifled its adoption in the U.S.
This legal victory could not have come at a more opportune time. It coincided with a broader, increasingly constructive regulatory climate in Washington. The successful passage of several crypto-focused bills through the U.S. House has signaled a move towards establishing clear rules of the road for the digital asset industry. This favorable regulatory tailwind has not only vindicated Ripple's long-standing arguments but has also paved the way for the development of regulated financial products built around XRP, transforming it from a legally contentious asset into a compliant component of the future financial system.
Chapter 3: The Wall Street Endorsement - The Influx of Institutional Capital
With the legal clouds parted, the floodgates for institutional capital have swung wide open. The most tangible evidence of this is the enthusiastic race to launch XRP-based Exchange-Traded Funds (ETFs). An ETF is a mainstream investment vehicle that allows investors to gain exposure to an asset like XRP through their traditional brokerage accounts, representing a critical bridge between the worlds of crypto and traditional finance.
Financial services giant ProShares has led the charge, successfully launching a leveraged XRP futures ETF. The approval of such a sophisticated product by regulators is a powerful endorsement, signaling a high degree of comfort with XRP's market structure and legal standing. ProShares is far from alone; a veritable who's who of asset managers, including Bitwise and 21Shares, have also filed applications for their own XRP-based funds. The sheer volume of these filings from established Wall Street players underscores a deep and proactive institutional belief in XRP's long-term potential.
This institutional stampede is further reflected in the booming derivatives markets. Daily trading volume in XRP futures has swelled to over $235 million, while open interest—a measure of the total value of active contracts—has soared to a record high. This is the unmistakable footprint of large, sophisticated investors using these markets to speculate on and hedge their exposure to XRP. The recent price surge was amplified by a significant "short squeeze," where traders betting against XRP were forced to buy back their positions at higher prices, adding further fuel to the rally. This is not the behavior of a retail-driven fad; it is the mechanics of a market now dominated by serious institutional demand.
Chapter 4: Reading the Digital Tea Leaves - On-Chain and Whale Activity
A deeper look at the blockchain itself provides further compelling, if nuanced, insights. On-chain data reveals a fascinating dynamic among the largest holders of XRP, colloquially known as "whales." On one hand, there have been significant transfers of XRP from Ripple co-founder Chris Larsen to centralized exchanges, a pattern that often precedes selling. Throughout 2025, Larsen has moved hundreds of millions of dollars worth of the token, which could be interpreted as early insider profit-taking.
However, this potential selling pressure has been more than absorbed by a much broader trend of accumulation. Market data clearly shows a steady pattern of buying by other large, institutional-grade investors. It appears a new class of whales is confidently accumulating any supply that becomes available, creating a powerful and sustained tailwind for the price.
Adding a layer of data-driven optimism is the Market Value to Realized Value (MVRV) ratio. This advanced metric, which compares XRP's current price to the average acquisition cost of all coins in circulation, recently flashed a signal that has historically preceded enormous rallies. The last time this particular indicator showed a "golden cross," it heralded a massive 630% surge in XRP's price. While past performance is no guarantee of future results, this historical precedent provides a powerful data point that aligns perfectly with the bullish fundamental narrative.
Chapter 5: Charting the Uncharted - Price Analysis and Future Targets
The culmination of these powerful catalysts has produced breathtaking price action. In a single 24-hour period, XRP's price leaped by 22%, decisively breaking its former all-time high and entering a phase of pure price discovery. Technical analysts have described the move as a textbook breakout following a long period of accumulation, a pattern that often leads to powerful and sustained upward trends.
With no historical resistance levels overhead, analysts are now turning to technical patterns and Fibonacci extension models to project potential future targets. A prominent "bull pennant" formation on the price charts suggests an astonishing long-term target of $14. More immediate, conservative targets are clustered around the $4.00 and $4.80 levels, which many believe are well within reach if the current momentum is maintained.
This brings the conversation to the ultimate question of a double-digit valuation. Can XRP realistically reach $10 or beyond? A growing chorus of analysts believes it can. Projections for the coming years vary, but many models point to a future where XRP trades comfortably in the double digits. Forecasts for 2030 range from a conservative $4.35 to more aggressive targets of $16, $22, and even higher. These predictions are not based on pure speculation but are rooted in the assumption that the institutional adoption unlocked by ETFs and Ripple's expanding global payment network will continue to drive demand and utility.
Conclusion: A New Era for XRP
XRP's recent performance represents more than just a bull run; it signifies a fundamental transformation. It has emerged from a crucible of legal and regulatory challenges not merely intact, but stronger, more resilient, and with a clear mandate in the world's most important financial market. This hard-won victory has unleashed a powerful synergy of positive forces: the validation of institutional capital, the tailwind of a favorable regulatory environment, and the overwhelming evidence of bullish technical and on-chain metrics.
Its decisive outperformance of Bitcoin marks a coming-of-age moment, proving that a digital asset with clear utility and legal standing can forge its own path and command its own powerful market narrative. While the future in any financial market remains unwritten, the convergence of factors supporting XRP has never been stronger. The conversation has irrevocably shifted. The question is no longer if XRP can reclaim its former glory, but rather how high its newfound momentum can carry it. For a rapidly growing number of investors, analysts, and institutions, the $10 price target has evolved from a distant fantasy into a plausible, and perhaps even imminent, reality.
Ripple buy signalHello friends
Given the good growth we had, we entered a deep correction, and now we have the opportunity to buy step by step in the specified support areas with capital and risk management and move with it to the specified targets.
*Trade safely with us*

Xrp:The fate of Ripple in the long termhello friends👋
After a good price growth that we had, you can see that the buyers gradually exited and a triangle pattern was formed.
Now, according to the specified support, it should be seen whether buyers support Ripple or not...
You have to wait and nothing can be said until the failure of the pattern, but we suggest that you buy step by step with capital and risk management in the identified areas that are very good supports and move to the set goals.
And in the end, we must say that don't forget that we are in a strong upward trend, that the probability of the continuation of the Bister trend is the possibility of a fall...
🔥Follow us for more signals🔥
*Trade safely with us*

XRP Technical Analysis – Massive Breakout in Play!After months of tight consolidation inside a symmetrical triangle, XRP/USDT has finally broken out with strong bullish momentum on the daily timeframe.
🔹 Chart Pattern: Symmetrical Triangle
🔹 Breakout Confirmation: Daily candle closed above the descending trendline resistance
🔹 Support Zone: ~$2.00 – $2.20 (Held multiple times since April)
🔹 Breakout Level: ~$2.48 – $2.50
🔹 Next Resistance Levels:
▫️ $2.62 – Minor horizontal resistance
▫️ $3.39 – Major resistance from previous highs
▫️ $4.92 – Long-term macro target (measured move from triangle)
🧠 Why does this breakout matter?
✅ Strong Volume: Breakout happened with increased volume – a sign of genuine breakout
✅ Multi-month Base: The longer the consolidation, the stronger the breakout
✅ Support Respect: XRP respected the demand zone repeatedly, showing accumulation
✅ Momentum Building: A clean break could trigger trend-following bots and new buyers

XRPUSDT BINANCE:XRPUSDT Price broke above the downtrend line but faced resistance at 2.2770 dollars and started correcting. Key supports are at 2.1900 and 2.0800 dollars. If it bounces, resistances to watch are 2.2770, 2.3600, and 2.4620 dollars. Price is currently between key levels.
Key Levels:
Support: 2.1900 – 2.0800
Resistance: 2.2770 – 2.3600 – 2.4620
⚠️Contorl Risk management for trades.

#XRP/USDT#XRP
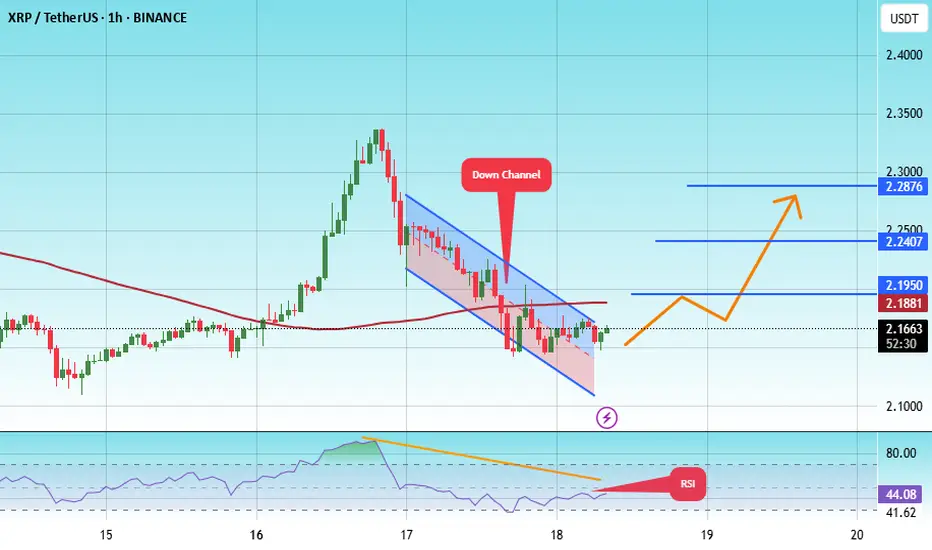
The price is moving within a descending channel on the 1-hour frame, adhering well to it, and is heading towards a strong breakout and retest.
We are experiencing a rebound from the lower boundary of the descending channel, which is support at 2.11.
We are experiencing a downtrend on the RSI indicator that is about to be broken and retested, supporting the upward trend.
We are looking for stability above the 100 Moving Average.
Entry price: 2.16
First target: 2.20
Second target: 2.24
Third target: 2.28
XRP - calm before the stormWe've got our bullish reversal sitting at the Golden Ratio price of $2.20. Fed Chairman Jerome Powell speaks today with many speculating that this will be the meeting that sends the markets soaring.
With over 17 ETFs, SWIFT update, Banks offering crypto services, BIS, XRPL EVM side chain, and many more catalyst. This could be the beginning to the largest bull run witnessed in our lifetime.
Have profits targets, an exit strategy, and plan for long-term reinvestments that will continue to make you money.
LOCK IN 🔐

$XRP ALERTCRYPTOCAP:XRP price is pushing toward breakout resistance!
Don't FOMO in yet — confirmation comes above the red zone!
Break and hold above signals bullish continuation
Rejection could lead to a pullback to the demand zone!
Resistance zone: $2.35- $2.63
Support zone: $1.92 - $2.07
Patience brings profits!

XRP/USDT Bullish Breakout Anticipation XRP/USDT Bullish Breakout Anticipation 🚀
Technical Analysis:
The chart illustrates a potential bullish setup for XRP/USDT based on price structure, support/resistance levels, and harmonic movements.
🔍 Key Observations:
Rejection From Major Support Zone (1.95 - 2.00):
Price previously tested a strong demand zone (marked as “SUPPORT”) and showed significant rejection with bullish candlestick momentum.
Series of Higher Lows ✅:
The price structure shows consecutive higher lows (green arrows), indicating rising buying pressure and bullish intent.
Break of Intermediate Resistance (2.15 - 2.18):
A breakout from the neckline area confirms bullish continuation. Price is currently retesting this level, turning resistance into support.
Target Zone at 2.35 - 2.36 🟦:
A clean target area marked by historical resistance and previous high (red arrow).
Projection indicates a possible move toward 2.3512 USDT, aligning with the measured move from the breakout structure.
Bullish Harmonic Pattern Completion 🔼:
The chart also displays a harmonic pattern completion near the recent low, suggesting a reversal point aligning with market reaction.
🎯 Trading Plan:
Entry Zone: Current retest around 2.15 - 2.18 is favorable.
Target: 2.3512 (as per projection and prior resistance zone).
Invalidation: Break below 2.10 and especially under the key support (2.00) would invalidate the setup.
📌 XRP/USDT is showing bullish strength as long as it holds above the breakout level. A sustained move could trigger momentum towards the 2.35 target zone. 💪📊

XRPI'm expecting a $1.80 tap before we take off.
We should begin moving up around the second week of July, after peace talks with Iran end. LOCK IN. 🔐

XRP Is Quiet—But This Calm Is Deceptive!Yello Paradisers—have you noticed how #XRP isn't on anyone’s radar right now? It’s not trending, no one’s hyping it, and to many, it’s just another slow mover. But here’s the thing: this type of silence often comes before the real storm, and the technical are quietly lining up.
💎#XRPUSDT is seeing now a period of consolidation The 1D bullish trend structure has been broken, and since then, price has entered into a tightening consolidation phase. While this may seem like indecision, it’s more likely a preparation for a potential high-probability upside expansion.
💎Price is now hovering just above the 0.786 Fibonacci level (~$2.25), which has started acting as a soft support. This is not a level to blindly trust, but one to monitor for reactions. If price manages to hold here, the next high-probability target lies at the short-term resistance around $2.5917, followed by major resistance at $2.9480, which aligns with a broader liquidity zone.
💎One key factor to keep in mind: the descending trendline liquidity has not been swept for a long time. That uncollected liquidity still sits just overhead, and markets usually don’t leave such inefficiencies behind forever. A spike toward that zone becomes increasingly probable the longer we range here.
💎At the same time, the MTF EMA on the daily chart is acting as a soft dynamic resistance, pushing the price down gradually. This setup increases the probability that we may see another touch of the 0.786 level. If that fails to hold decisively, the next likely area of interest will be the major support zone around $2.00.
💎Still, that major support remains unbroken and continues to act as a probability-backed structure for potential bullish defense. Until we get a clean daily candle close below $1.791 (invalidation level), this entire zone remains technically favorable for a potential reversal or liquidity sweep to the upside.
We are playing it safe right now, Paradisers. If you want to be consistently profitable, you need to be extremely patient and always wait only for the best, highest probability trading opportunities.
MyCryptoParadise
iFeel the success🌴

XRPExpecting another overnight bull run towards $2.35 is highly likely. We've continued taking out higher Liquidity based off previous days, this is a very bullish sign.
If we fail at $2.30 we may see $2.20 again, which provides another optimal buying opportunity before the massive move up.
LOCK IN.

XRP Back on the MENU! XRPUSD Ripple next move? XrpUsdtIt's been a while since we looked at this chart.
🌍 SeekingPips 🌎 View remains the same and so we are strictly looking for strategic LONG entry points in
TIME & PRICE. 👌
Yes it's a WEEKLY chart and I understand that many of the trigger happy TRADERS or in some cases GAMBLERS can't stand to look at anything longer than a 30 minute chart BUT really sometimes you really just have to STEP RIGHT BACK to see the BIGGER PICTURE👍
✅️This week's candle CLOSE really has the potential to setup the next few weeks for easy MULTIDAY TRENDING MOVE TRADE SETUPS 👍
ℹ️ Note the price location on what we viewed as a HTF FLAG MANY WEEKS AGO .
Yes it was breached both sides but 🌎SeekingPips🌍 doesn't trade the patterns themselves but the HUMAN PSYCHOLOGY AROUND THESE PATTERNS.🤔
ℹ️ Note where most of the volume has been trading and also note the moves around the extreems of the dead patteren too.💡
In an even higher TIMEFRAME THE FLAG would still be valid and forming the flag itself too.
📊 [ b]CHECKOUT the MONTHLY chart for the example. 📉
Anyway we will see what the next 48 hours🕦 hold but no doubt this one is on our RADAR this week.
✴️ 2.048 to hold otherwise a potential for current low of this year to be tested.
✴️ Alternatively if support starts to form on the 240min chart at current levels last weeks high could expected to be tested
✴️ if so Xrp could easily give a multiday upside trending move.
Now like a NINJA we wait and stalk...
As always ladies and gentlemen whilst Seeking Pips 🌍 SeekingPips 🌎 says
" NO TRIGGER NO TRADE"
& "STICK TO YOUR PLAN"✅️
👍 Have a GREAT WEEK and we will see you soon with an UPDATE...

This isn’t distribution. It’s preparation.XRP has spent the last sessions consolidating just under a 15M OB — not failing, just gathering energy. Most traders confuse rejection for weakness. Smart Money sees opportunity.
What matters:
We’ve got stacked 15M OBs above 2.2544 and 2.2805 — liquidity zones that will either break or sweep
Price just tapped the local low while holding above volume cluster support
If we reclaim the midrange and hold above 2.2400, the setup for expansion into 2.2805 is in play
Lose 2.2348? Expect a deeper rotation to the 2.1862 demand zone
There’s no need to predict here. Just follow structure. Volume confirms intent, and the reaction around these OBs will dictate the next leg.
Execution:
Reclaim 2.2544 → long toward 2.2805
Clean breakdown? Step aside and re-evaluate near 2.19
Bias is bullish unless 2.2348 gets invalidated with conviction
You don’t need more signals. You need fewer distractions. The chart is already speaking.
More like this? Setup-first, noise-free — check the profile description.

Price delivered the signal — now it’s time to follow structure.XRP isn’t reacting randomly. It’s responding to engineered inefficiencies and prior OBs that most overlook. What looks like resistance to others is just a staging ground for continuation.
Here’s the play:
Price ran into the 1H OB at 2.2219 — hesitation here was expected
We’re now pulling back into the equilibrium zone, anchored by 0.382–0.618 fib (2.1886–2.1680)
This zone also aligns with the previous 1H OB — an accumulation base that already proved itself
If price holds above 2.1533 and shows rejection at the 0.5 fib (2.1783), I expect the next leg to take out 2.2219 and push toward the 4H OB.
Execution thesis:
Ideal long re-entry is in the 2.18–2.16 zone
Invalidation below 2.1346
Targets: 2.2476 → 2.3107, with 2.2219 as first test
This isn’t about chasing highs. It’s about aligning with structure and letting the draw on liquidity do its work.
Want more trades delivered with this level of clarity? The account description has them. I don’t forecast with hope — I forecast with models.

They waited for confirmation. I bought the retrace.XRP didn’t reverse. It refined.
After reclaiming the rounded base and pushing into a 1H OB, price rotated perfectly into the 0.5 retracement at 2.1419 — tagging the breaker wick, respecting structure, and front-running the deeper 0.618 by a hair.
This isn’t weakness. It’s an engineered dip into fresh demand. Smart Money logic doesn’t require “green candles” — it requires imbalance filled and structure respected. That’s exactly what we have here.
Now, price is boxed between two intentions:
If we hold 2.1419, the draw becomes the 1H OB above — 2.1758 to 2.2060.
If we break that level with conviction, 2.1268–2.1052 will serve as the next rebalance zone before any macro continuation.
Execution tier:
✅ Long bias above: 2.1419
🎯 Target 1: 2.1758
🎯 Target 2: 2.2060
❌ Invalidation: Clean 1H body close below 2.1268
Retail waits for signals.
Smart Money builds in silence — and exits with intent.
