Xrpusdbuy


XRP $172??? Maybe $1.72 ;) My original long term analysis so far remains unchanged.
This morning I have done a very thorough analysis on XRP to share with you all, and though I have been calling this move for quite some time, I am still VERY MUCH obliged to believe that we have a highly volatile few months ahead of us
In the short term until approx EOM I believe we should get a rise. I cannot accurately get just one target at this point, as the move could be quite volatile, but I estimate we should finish up the month somewhere between 0.40 and 0.54
From wherever we reach our local top, we will be looking for a retrace of approx 0.382, 0.5, potentially 0,618 from the beginning of Blue structure
I estimate the correction should take around 1 month
before the highly volatile move up begins. Potentially leading us to $1.4, $1.75, $2.1. We should find our top on or before 22nd June <3

Xrp longs are building up ...Will we see a breakout to the top? Seems like longs are building up ...
...no trading advice!

XRPUSD - IS MOMENTUM COMING?in the last 2 weeks XRPUSD has been slowly but surely making some moves that I would call positive. bulls are pushing to create another HH.
i can see the low being tested and then we can hope for a rally up wards
See previous analysis
PLEASE SUPPORT THE MOVEMENT WITH YOUR LIKES, COMMENTS AND FOLLOW FOR MORE


XRPUSD - BUY THE DIPBuy Price: Green Zone
SL: Red Zone
Profit: Blue Zones
Invest Suggestion: 20 Percent
Profit Expectations: 10 - 50 Percent
Looking at the chart of XRP , i see two things:
1 - XRP will hit the BLACK Line ( like did in the middle of Setember and in in my previous analysis ), if this happen, rsi will be oversold, indicating a reversal tendency! Also, this black line is a very strong support!
2 - XRP is in the dip, so all HMA´s are showing to us a decrease tendency( it may broken in the next hours/days ), when HMA 13 start to cross the others, it´s the time to buy( already started)!!
Guys and Girls, this is a risky trade due to BTC volatility , so, if hit the SL, SELL IT!
Sell when you get some profit, according the way you trade.
Keep following us and please like this idea.
Any doubts? Send in the comments or in our telegram or Inbox here.
Thanks for visiting.

XRP: Ripple Long Trade Setup 30% !!XRP Coming on the Next Support Level Fib 0.38 Now we can see Reversal in trend From 8800 and Set Stop Loss own Risk reward Ratio or see Chart to Set Target Point and Stop Loss.
Target Point will be 11500.
Stop Limit 8000.
Warning- I m Not a Financial Advisor this idea Only For Educational Purpose Only.
Thank You !!

XRP/USD - Back to 0,37 this week?After a short break of the Support level of 0,30 Ripple is now back on it's way up. I expect a raise to 0,375 in the next few days. 0,375-0,38 Will be an import Resistance for Ripple to break.
Good luck trading and follow me for more of my analysis!


XRP UPDATEaas per previous, i was expecting to hit this
level, now will it break line down??????
i feel we might get some momentum back up
looking at the hitting around $.46 again.
what do you guys thinks?
LIKE FOLLOW AND COMMENT

XRPUSD approaching a level of demand. Longs from hereXRPUSD siting on the weekly 200 ema dynamic support with price approaching the level of demand in which price gained bullish momentum previously

XRPUSD - UPDATE FOR YOU GUYSXRPUSD HAS BEEN PLAYING AROUND THIS
AREA FOR A WHILE. I AM EXPECTING IT TO
MOVE UP SOON.
AS PER MY BTCUSD UPDATE, ONCE THE MOVE UP
STARTS ON BTCUSD, I WOULD EXPECT THIS TO FOLLOW
LIKE, FOLLOW AND COMMENT


XRP. Time to buy! 0.28-0.32$In previous ideas, I predicted the correction of this coin, after its growth on September 20th.
At the moment, it seems to me that the crypt market correction is over. If we analyze the volumes of this coin, it is clear that the volumes became worse after the breakthrough of $ 0.38 ( for this level I published the idea on November 14 ):
Therefore, I conclude that the current price zone is interesting for buyers.
On horizontal volumes it is clear that in this zone there was a good consolidation and interest:
0.32 $ is the lower limit of this liquidity zone. Also at this price is the global wave Y = W (if not take into account the shadow of September 20) or, Y = 0.618 * W (if this shadow is taken into account):
If you take the wave Y, and divide it into a, b, c. it turns out that in the price of 0.32 and 0.28 $ there are also strong levels:
Therefore, the wave analysis only confirms that in this range should begin at least a rebound to 0.38-0.4 $. At this point, buyers should show what they are capable of. If this forecast is implemented, then I'm creating a new idea about the prospect of growth.


XRP 'What I See' Analysis -THIS IS WHAT I SEE -
XRP has made 4 higher lows on the daily, apart from the recent fakeouts to below historical support line of 0.45
which tested 0ct11 & oct14 support on nov 14, 15, 19, 20 and today nov 21.
XRP is testing/tested the following - tenkan san, kijun, 200ema, 50ema, trend lines within triangle, symmetrical triangle bottom & top, oct 14 0.34 support, oct11 0.38 support, 0.45 may 30 historical support line.
Indicators (I use Godmode merged with Stoch, Phoenix ARI, MACD, Dynamic Pivots) have to bottom out & indicate support & turning points on 1D chart to build strength to get past this resistance and out of this triangle and above the cloud. When BBands start to tighten this will also give a sign that a big move is coming. 0.465 is acting as strong resistance just above 0.45 historical support line.
If the price closes on 1D above the cloud with a 50ema/200 ema golden cross this will trigger long trades, combined with a strong or weak bullish TK cross (Tenkan San light blue line crossing Kijun red line either above the cloud or below it), volume will then need to kick in. It will then be leaning towards bullishness and upside targets can be considered based on previous tops, supports and cloud data.
**Price has to close above the 1D cloud and above the 200ema and from there continued bullish or bearish bias will ultimately be decided.**
Loose Upside Targets - (0.485, 0.5, 0.52, 0.55, 0.57, 0.63, 0.7, 0.8, 0.93, 1.73, 1.78) I believe a 50% ATH retracement is possible with further upside from there.
(Targets not set in stone and I reserve the right to change them through continued analysis - this is not trading advice)
www.tradingview.com

XRPUSD - RIPPLE EFFECT -- UPDATE, MY HUMBLE OPINIONXRPUSD has made moves down. as per my last analysis,
we expected XRPUSD to hit the red line with a possible
move back up. this move is still possible but i feel
we might see it fall a bit more.
With BTCUSD and ETHUSD making major falls in price, i
think we will get one more price break to the downside.
It is important to note that when major moves about to
occur the main movers cause a lot of panic in the market.
the pessimism in the market has caused a lot of people to
panic sell.
anyways if it breaks the red line i would be looking around
xrpusd 0.34057 for next support.
happy trading guys
like, comment and follow

XRP can be 20$!!!!Due to bullish market that happened in the XRP in the last days it seems bulls are back to this coin and we can expect more raising with this volume, but aside from the psychology of the market let’s take a look into its TA.
Price has started it’s raising with a pin bar candlestick from the intersection of the bottom line of red and the blue channel and for now I believe the first target would be the top of the blue channel around 3.3$-4$. Although it is possible that price meets the bottom line of the red channel again and start it’s move from there.
In the middle we have a strong resistance on 0.9752$ and also the middle line of the blue channel and if these resistances break out price will meet 3.3-4$.
In a big picture I think if price breaks out of the blue channel from top we can expect to see ripple around 20$ in the early of 2019.

xrpsd - my adviceAS PER LAST UPDATE I NOTED THE POSSIBILITY OF
THIS DROP.
listen, most analyst are rightly giving you their views
on the possible outcomes but the truth is the moves, shapes and character of crypto can be wildly
unpredictable and volatile.
make sure you trade safe, only risk money you
can lose and you'll be ok.
LIKE, FOLLOW AND COMMENT

XRPUSD - UPDATE - WHAT NEXT?AS PER LAST UPDATE I NOTED THE POSSIBILITY OF
THIS DROP.
I AM NOW HOPING THIS IS THE LAST OF IT AND THE
BULL RUN CAN START. THERE IS THAT POSSIBILITY AS
BEFORE THAT THIS COULD MOVE DOWN ONE MORE TIME
BEFORE THAT BULL PUSH
LIKE, FOLLOW AND COMMENT

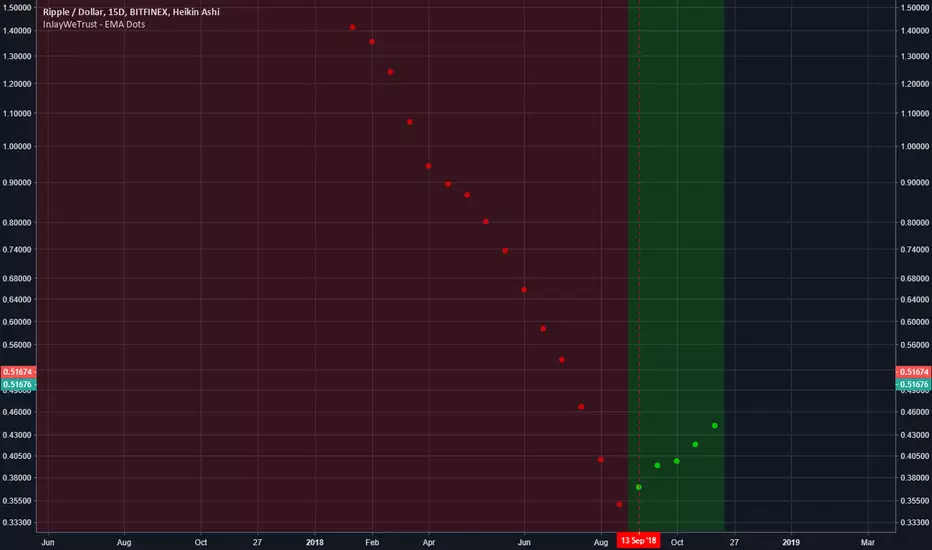
Should of got XRP/RIPPLE 2 months ago.Buy Green
Sell Red
//
it's mainly for swing trading, i use the 3 day / 15 day / monthly charts with it and it works perfectly,
//
it works good for stocks and cryptocurrency.
//
you will use heiken ashi chart style and turn on the EMA DOTS indicator.
once the indicator is on you will hide the heiken ashi so you only see the dots.
//
when a green dot -0.78% -6.68% -7.44% -7.44% appears you buy, if a green dot -0.78% -6.68% -7.44% -7.44% appears after that green dot -0.78% -6.68% -7.44% -7.44% you hold your investment.
if a red dot appears you sell your position. easy as that.
//
the standard dots setting will be set to 10 - use this for any chart above 3 days
change the dots setting to 6 for 3day charts and below
//
shorter time frames will be choppy.
//
larger time frames will be smooth.
//
*Daytrading smaller timeframes is possible but not recommended.