Xrp - This is the bullrun breakout!🔑Xrp ( CRYPTO:XRPUSD ) breaks the triangle now:
🔎Analysis summary:
After the recent bullish break and retest, Xrp managed to already rally another +100%. This is a clear indication that bulls are still totally in control of cryptos and especially Xrp. It all just comes down to the all time breakout, which will then lead to a final parabolic rally.
📝Levels to watch:
$3.0
SwingTraderPhil
SwingTrading.Simplified. | Investing.Simplified. | #LONGTERMVISION
Xrpusdlong

XRP : Long term analysisHello friends🙌
🔊Considering the great growth that the price has had and has set a new ceiling, be careful because we are at the ceiling and when we are at the price ceiling, we should always expect a price correction...
⚠Now, given the strong upward trend we have, you can buy with risk and capital management, but our suggestion is lower prices for the possibility of a correction and the possibility of a reversal pattern.
So we have identified important support levels for you and we have also identified price targets.
🔥Follow us for more signals🔥
*Trade safely with us*

Xrp - The final bullish breakout!💰Xrp ( CRYPTO:XRPUSD ) will create new all time highs:
🔎Analysis summary:
After a consolidation of an incredible seven years, Xrp is finally about to create new all time highs. With this monthly candle of +40%, bulls are totally taking over control, which means that an altcoin season is likely to happen. And the major winner will simply be our lovely coin of Xrp.
📝Levels to watch:
$3.0
🙏🏻#LONGTERMVISION
SwingTraderPhil

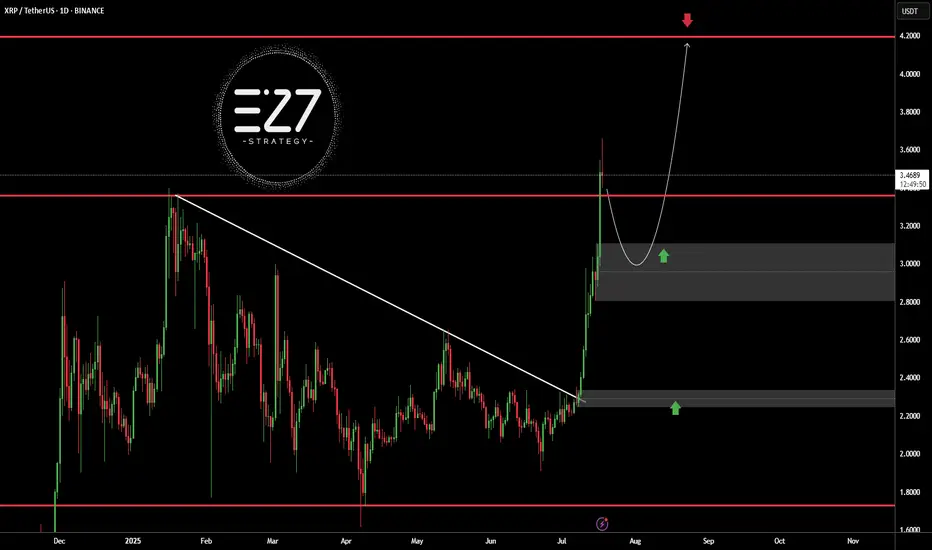
XRPUSDTBINANCE:XRPUSDT broke above its long-term downtrend line and surged to the $3.5000 resistance area, but is now undergoing a correction. The current bullish structure, with a higher high and higher low, suggests the trend remains upward. A pullback toward the $3.0000 demand zone is likely and would be a healthy retracement. Holding this area could trigger a continuation toward the key resistance at $4.2000.
Key Level Price
Main Support $2.2000
Main Resistance $4.2000
Best Buy Range $2.9500 – $3.1500
Best Sell Range $4.1000 – $4.2000
Investment Risk (Buying) Medium
⚠️Please control RISK management
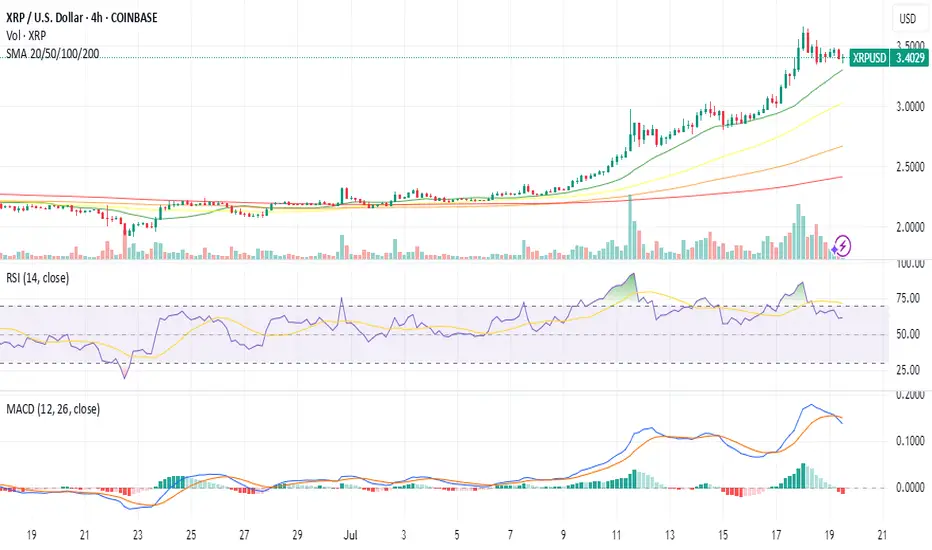
The trend is your friend!Still respecting the trend. Maybe this week a push to the upside of 3.80 maybe 4.00

XRP Eyes Explosive Growth: A Path to $10 and a 2025 "Euphoria PhThe cryptocurrency market is charged with renewed optimism, and much of the focus is now turning to established digital assets like XRP. After a prolonged period of consolidation, a powerful combination of bullish technical indicators, evolving market dynamics, and a compelling value proposition is fueling forecasts of a significant price surge. Market analysis now points to a potential future where XRP could trade in the $6 to $10 range, a move that hinges on Bitcoin achieving a landmark price of $144,000.
Adding to this momentum, detailed chart analysis suggests that XRP may be on the cusp of entering a "euphoria phase" between August and October of 2025, a window that could see unprecedented growth. As market leaders Bitcoin and Ethereum become increasingly expensive for the average investor, a strong argument is emerging that XRP currently offers a superior entry point, blending high potential with accessibility. This convergence of factors is positioning XRP as a token to watch, with many believing its next major bull run is not a matter of if, but when.
The Bitcoin Catalyst: Charting XRP's Trajectory to $10
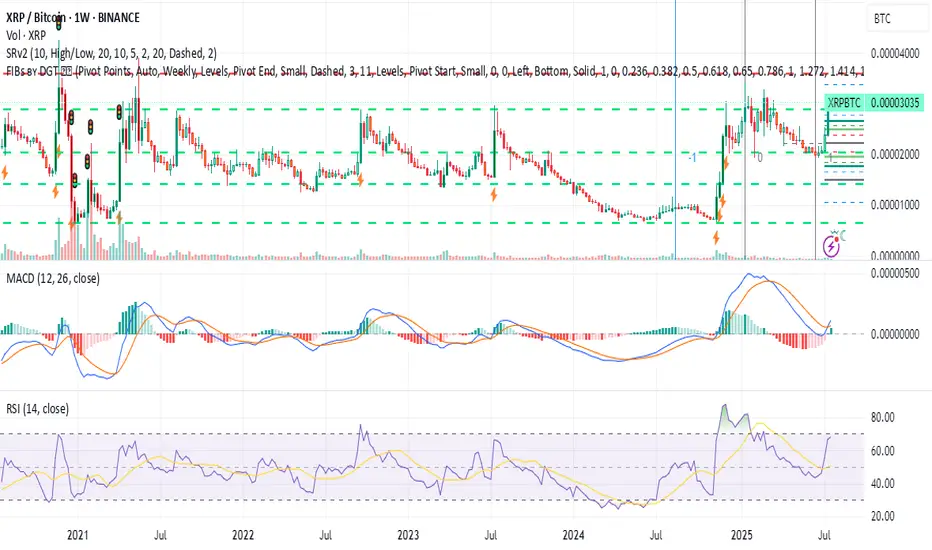
A significant component of XRP's bullish outlook is directly tied to the performance of Bitcoin. The relationship between the two assets, often measured by the XRP/BTC trading pair, is showing signs of a historic shift. Technical analysis of the XRP/BTC monthly chart reveals that its price is coiling tightly just below a critical resistance level. A definitive monthly close above this threshold would represent a major technical breakout, signaling a powerful reversal of its long-term trend against Bitcoin. Such a move would be the first of its kind since 2018 and could unleash substantial upward momentum.
Should this breakout on the XRP/BTC chart materialize, technical projections indicate an initial move toward a higher valuation, with a primary target zone identified. If this rally in the trading pair coincides with Bitcoin’s price climbing to the projected $144,000 level, the math translates to a U.S. dollar valuation for XRP of between $6 and $10. The timing for such a move is projected for late 2025, assuming Bitcoin’s own bull run accelerates as anticipated.
The XRP/USD chart independently supports this constructive outlook. A recent weekly close above a key price level has flipped several long-term indicators to a bullish stance, generating a classic breakout signal. Using standard technical projection models, such as Fibonacci extensions, price objectives for XRP now stand at approximately $4.53, $6.31, and even as high as $9.22. The journey to these targets, however, remains heavily dependent on the broader market strength led by Bitcoin. A stall in Bitcoin's advance would likely moderate the upside potential for XRP.
The "Euphoria Phase": Why Late 2025 Could Be Explosive
Beyond its relationship with Bitcoin, XRP's own price chart is signaling immense latent potential. After trading within a defined range for years, the token is now exhibiting powerful bullish signals on its weekly chart, suggesting a breakout from a multi-year consolidation pattern is underway.
Several key technical indicators are aligning to confirm the start of a new, sustained uptrend. A clear bullish crossover on the weekly Moving Average Convergence Divergence (MACD) indicator—a trusted measure of market momentum—has already occurred. At the same time, the Relative Strength Index (RSI) is climbing steadily but has yet to enter the overbought territory that has historically marked the peak of major cycles. This indicates that there is still significant room for price appreciation before the rally becomes exhausted.
A critical psychological and technical price level now stands at $5. A firm weekly close above this mark would be a monumental event, likely triggering a wave of intense buying pressure and shifting market sentiment from simple optimism into full-blown euphoria. If this breakout is confirmed, the next macro price targets are projected to be in the $8 to $11 range, levels consistent with the price action seen in XRP's previous parabolic advances. Based on historical cycle patterns and the current technical structure, this explosive phase could unfold between August and October of 2025.
The Value Proposition: Why XRP Stands Out in a High-Priced Market
As Bitcoin and Ethereum command prices that put them out of reach for many new participants, a psychological barrier to entry has formed. It is in this environment that XRP’s unique market position becomes a powerful advantage. The investment case for XRP is straightforward and highly attractive to first-time crypto buyers who may be experiencing "sticker shock" from the market leaders.
With its high market capitalization and global recognition, combined with a low per-unit price, XRP presents an appealing proposition. This dynamic, often referred to as "unit bias," makes investors feel they are getting better value by being able to purchase a larger quantity of tokens. This behavioral pattern has historically driven significant retail inflows into assets perceived as more affordable.
This appeal is not merely psychological. XRP is underpinned by a clear and functional use case: facilitating fast, low-cost cross-border payments. The XRP Ledger’s ability to settle international transactions in seconds for a fraction of a penny provides a fundamental strength that distinguishes it from purely speculative assets. This utility, aimed at disrupting the enormous traditional finance market, offers a layer of long-term credibility. The broad distribution of XRP across millions of digital wallets highlights its widespread accessibility and deep retail base, a demographic that could be instrumental in fueling its next major run.
A Prudent Perspective
Despite the compelling bullish case, it is essential to approach these forecasts with a clear understanding of the risks involved. The cryptocurrency market is defined by its volatility, and price targets are speculative projections, not guarantees. XRP's path is still influenced by external factors, most notably the ongoing regulatory landscape, which could have a significant impact on its future.
Furthermore, the most optimistic scenarios for XRP are heavily reliant on Bitcoin maintaining its powerful upward trajectory. Any weakness in the flagship cryptocurrency would undoubtedly impact the entire altcoin market, including XRP. While the technical and fundamental outlook appears increasingly bright, a disciplined and well-researched approach remains the cornerstone of navigating this exciting but unpredictable market.
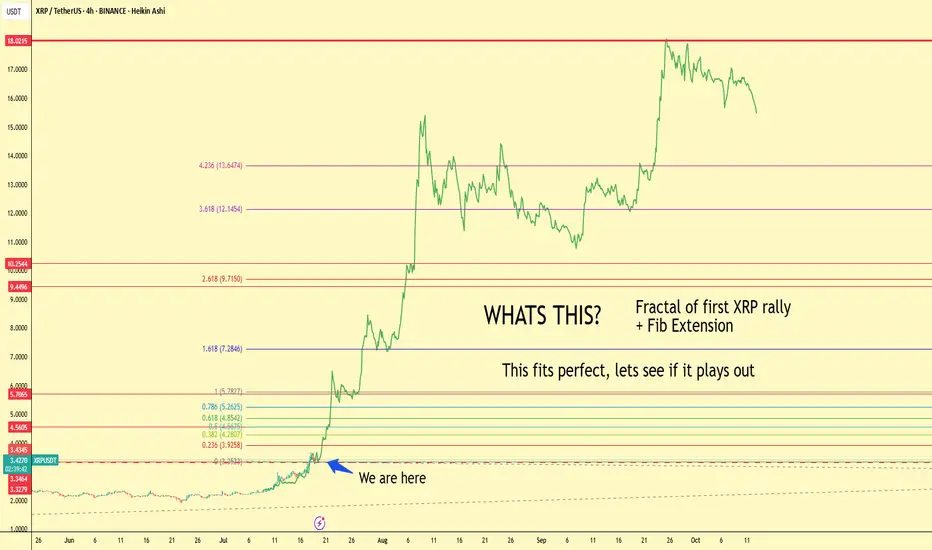
18$ XRP Mapped Out Projection – HOLD🚀 Just sharing some insights to help you explore what XRP might be capable of.
The chart you see here is a projection inspired by the path of XRP’s first major bull run. Surprisingly, I was able to map out around 95% of the key support and resistance levels using the Fibonacci extension tool.
📚 A little history lesson — while history doesn’t repeat itself exactly, it often rhymes in patterns.
Let’s see if XRP has another surprise in store for us this cycle. 🔄✨
#XRP #Crypto #FibLevels #Bullrun #ChartAnalysis
XRP : ETF...Hello dears
Considering the good growth we had, you can see that the price is stuck in a long-term range and has not managed to break it yet...
We must be prepared for any scenario, so the best thing to do is to buy stepwise, of course with capital and risk management.
Note that this analysis is on a daily time frame and may take a while, so if you are not patient, do not enter.
*Trade safely with us*

XRP's New Dawn: Beyond Bitcoin, Towards a Double-Digit Horizon
The cryptocurrency landscape is witnessing a seismic shift, and at its epicenter is XRP. In a stunning display of market dominance, the digital asset has embarked on a historic rally, fundamentally altering its perception and potential. Leaving the market's traditional bellwether, Bitcoin, in its wake with a colossal 277% outperformance over the past year, XRP has shattered its previous records. The token recently soared to a new all-time high of $3.66, pushing its market capitalization beyond the monumental $210 billion mark for the first time. This explosive growth, fueled by a confluence of regulatory triumphs, institutional validation, and overwhelming market momentum, has ignited the community and brought a once-fanciful question to the forefront of serious financial discussion: Is a $10 valuation the next logical destination for XRP?
This article delves into the multifaceted narrative behind XRP's meteoric ascent. We will dissect its remarkable outperformance against Bitcoin, explore the pivotal legal and regulatory victories that cleared its path, analyze the flood of institutional capital now entering the ecosystem, and examine the technical and on-chain data that suggests this rally may have only just begun.
Chapter 1: A Declaration of Independence - XRP's Decoupling from Bitcoin
For most of its existence, the cryptocurrency market has marched to the beat of Bitcoin's drum. Its price movements dictated the sentiment and direction for nearly all other digital assets. The year 2025, however, will be remembered as the year XRP declared its independence. The asset's 277% yearly surge against Bitcoin is not a mere statistical anomaly; it represents a fundamental rerating by the market, a recognition of XRP's unique value proposition, which is now unburdened by past uncertainties.
This divergence is starkly visible in recent trading. During the month of July alone, XRP appreciated more than 35% against Bitcoin, a powerful indicator of shifting capital flows and investor preference. While Bitcoin's narrative remains firmly rooted in its identity as "digital gold" and a hedge against inflation, XRP's story has evolved into one of proven utility and regulatory legitimacy. This newfound clarity has allowed its price to reflect its potential as a bridge currency for global payments and a cornerstone of a new, more efficient financial infrastructure.
The psychological impact of this rally has been profound. Prominent personalities like Dave Portnoy have publicly lamented selling their XRP holdings prematurely, echoing a sentiment of regret that is likely widespread among investors who exited their positions during the long years of legal ambiguity. This fear of missing out, while a potent market force, is not the sole driver of the current momentum. The rally is built upon a much sturdier foundation of institutional adoption and clear fundamental catalysts, suggesting a more sustainable trend than the speculative frenzies of the past.
Chapter 2: The Victory Lap - Regulatory Clarity as Rocket Fuel
The single most significant factor unlocking XRP's potential has been the definitive conclusion of its long and arduous legal battle with the U.S. Securities and Exchange Commission (SEC). The lawsuit, initiated in late 2020, had acted as a lead weight on the asset, alleging that Ripple's sales of XRP constituted an unregistered securities offering. This created a cloud of regulatory risk that kept many institutional investors and potential partners on the sidelines, particularly in the United States.
The tide began to turn with a landmark court ruling that determined XRP, when sold on public exchanges to retail customers, did not meet the definition of a security. This decision was a watershed moment, providing the legal clarity the secondary market desperately needed. The final chapter of this saga unfolded in 2025 as the SEC opted to drop its appeal and the parties moved to finalize a settlement. This resolution effectively ended the years of uncertainty that had suppressed XRP's value and stifled its adoption in the U.S.
This legal victory could not have come at a more opportune time. It coincided with a broader, increasingly constructive regulatory climate in Washington. The successful passage of several crypto-focused bills through the U.S. House has signaled a move towards establishing clear rules of the road for the digital asset industry. This favorable regulatory tailwind has not only vindicated Ripple's long-standing arguments but has also paved the way for the development of regulated financial products built around XRP, transforming it from a legally contentious asset into a compliant component of the future financial system.
Chapter 3: The Wall Street Endorsement - The Influx of Institutional Capital
With the legal clouds parted, the floodgates for institutional capital have swung wide open. The most tangible evidence of this is the enthusiastic race to launch XRP-based Exchange-Traded Funds (ETFs). An ETF is a mainstream investment vehicle that allows investors to gain exposure to an asset like XRP through their traditional brokerage accounts, representing a critical bridge between the worlds of crypto and traditional finance.
Financial services giant ProShares has led the charge, successfully launching a leveraged XRP futures ETF. The approval of such a sophisticated product by regulators is a powerful endorsement, signaling a high degree of comfort with XRP's market structure and legal standing. ProShares is far from alone; a veritable who's who of asset managers, including Bitwise and 21Shares, have also filed applications for their own XRP-based funds. The sheer volume of these filings from established Wall Street players underscores a deep and proactive institutional belief in XRP's long-term potential.
This institutional stampede is further reflected in the booming derivatives markets. Daily trading volume in XRP futures has swelled to over $235 million, while open interest—a measure of the total value of active contracts—has soared to a record high. This is the unmistakable footprint of large, sophisticated investors using these markets to speculate on and hedge their exposure to XRP. The recent price surge was amplified by a significant "short squeeze," where traders betting against XRP were forced to buy back their positions at higher prices, adding further fuel to the rally. This is not the behavior of a retail-driven fad; it is the mechanics of a market now dominated by serious institutional demand.
Chapter 4: Reading the Digital Tea Leaves - On-Chain and Whale Activity
A deeper look at the blockchain itself provides further compelling, if nuanced, insights. On-chain data reveals a fascinating dynamic among the largest holders of XRP, colloquially known as "whales." On one hand, there have been significant transfers of XRP from Ripple co-founder Chris Larsen to centralized exchanges, a pattern that often precedes selling. Throughout 2025, Larsen has moved hundreds of millions of dollars worth of the token, which could be interpreted as early insider profit-taking.
However, this potential selling pressure has been more than absorbed by a much broader trend of accumulation. Market data clearly shows a steady pattern of buying by other large, institutional-grade investors. It appears a new class of whales is confidently accumulating any supply that becomes available, creating a powerful and sustained tailwind for the price.
Adding a layer of data-driven optimism is the Market Value to Realized Value (MVRV) ratio. This advanced metric, which compares XRP's current price to the average acquisition cost of all coins in circulation, recently flashed a signal that has historically preceded enormous rallies. The last time this particular indicator showed a "golden cross," it heralded a massive 630% surge in XRP's price. While past performance is no guarantee of future results, this historical precedent provides a powerful data point that aligns perfectly with the bullish fundamental narrative.
Chapter 5: Charting the Uncharted - Price Analysis and Future Targets
The culmination of these powerful catalysts has produced breathtaking price action. In a single 24-hour period, XRP's price leaped by 22%, decisively breaking its former all-time high and entering a phase of pure price discovery. Technical analysts have described the move as a textbook breakout following a long period of accumulation, a pattern that often leads to powerful and sustained upward trends.
With no historical resistance levels overhead, analysts are now turning to technical patterns and Fibonacci extension models to project potential future targets. A prominent "bull pennant" formation on the price charts suggests an astonishing long-term target of $14. More immediate, conservative targets are clustered around the $4.00 and $4.80 levels, which many believe are well within reach if the current momentum is maintained.
This brings the conversation to the ultimate question of a double-digit valuation. Can XRP realistically reach $10 or beyond? A growing chorus of analysts believes it can. Projections for the coming years vary, but many models point to a future where XRP trades comfortably in the double digits. Forecasts for 2030 range from a conservative $4.35 to more aggressive targets of $16, $22, and even higher. These predictions are not based on pure speculation but are rooted in the assumption that the institutional adoption unlocked by ETFs and Ripple's expanding global payment network will continue to drive demand and utility.
Conclusion: A New Era for XRP
XRP's recent performance represents more than just a bull run; it signifies a fundamental transformation. It has emerged from a crucible of legal and regulatory challenges not merely intact, but stronger, more resilient, and with a clear mandate in the world's most important financial market. This hard-won victory has unleashed a powerful synergy of positive forces: the validation of institutional capital, the tailwind of a favorable regulatory environment, and the overwhelming evidence of bullish technical and on-chain metrics.
Its decisive outperformance of Bitcoin marks a coming-of-age moment, proving that a digital asset with clear utility and legal standing can forge its own path and command its own powerful market narrative. While the future in any financial market remains unwritten, the convergence of factors supporting XRP has never been stronger. The conversation has irrevocably shifted. The question is no longer if XRP can reclaim its former glory, but rather how high its newfound momentum can carry it. For a rapidly growing number of investors, analysts, and institutions, the $10 price target has evolved from a distant fantasy into a plausible, and perhaps even imminent, reality.
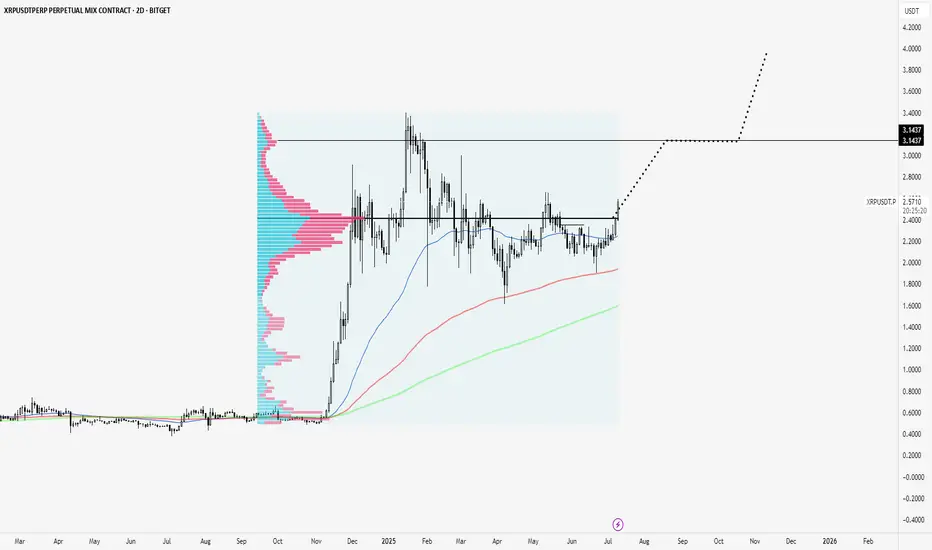
XRP clears Point of Control to test highs.XRP is breaking out of a consolidation zone and above a volume point of control that has been massive since its November rally onward.
Looks like next node is to $3.14
Super strong coin.
Ripple testimony in banking committee yesterday was bullish. Ripple partnering with BNY Melon yesterday was bullish. Ripple leading regulation standards with their XRP case is bullish. Ripple winning the status of XRP as one of a kind is bullish. Ripple getting a bank charter and fed master account is bullish.
Not much is close to XRP fundamentally.
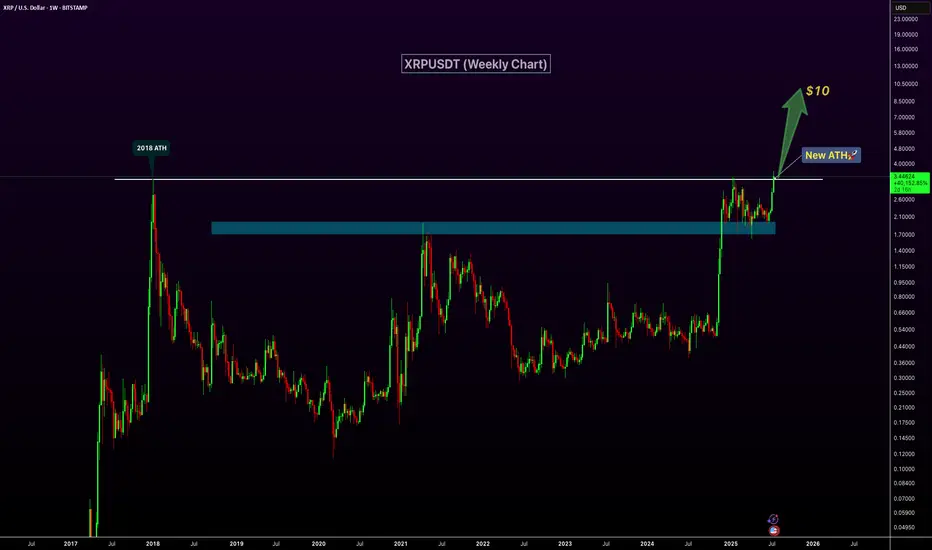
XRP Breaks 2018 High – New ATH Confirmed!XRP has officially broken above its 2018 peak, signaling a major bullish breakout and printing a new all-time high on the weekly chart. The previous resistance zone around $2.6–$3 has now flipped into strong support, confirming the strength of this move. With increasing volume and momentum behind the rally, XRP appears well-positioned for continued upside. The next key psychological target lies at $10, and current price action suggests a clear path toward that level. If bullish sentiment continues, this breakout could mark the beginning of a significant new uptrend.
Four Failed Breakouts… Then the Real One HitThe $2.22 level stopped XRP dead in its tracks four times.
Each failed breakout built more pressure — and when it finally cleared, price exploded.
Now it’s trending clean, breaking structure after structure.
This is what a proper breakout looks like.
#XRP #XRPUSD #BreakoutTrading #ChartPatterns #FailedBreakout #CryptoSetup #BacktestEverything #TradingView #QuantTradingPro

LIVE TRADE (XRP)Hello friends🙌
🔥Here we are with live trading Ripple, please follow capital management.
📈Given the resistance break, we can enter a buy trade and move with it to the specified targets.
🔥Follow us for more signals🔥
*Trade safely with us*

Ripple buy signalHello friends
Given the good growth we had, we entered a deep correction, and now we have the opportunity to buy step by step in the specified support areas with capital and risk management and move with it to the specified targets.
*Trade safely with us*

Xrp:The fate of Ripple in the long termhello friends👋
After a good price growth that we had, you can see that the buyers gradually exited and a triangle pattern was formed.
Now, according to the specified support, it should be seen whether buyers support Ripple or not...
You have to wait and nothing can be said until the failure of the pattern, but we suggest that you buy step by step with capital and risk management in the identified areas that are very good supports and move to the set goals.
And in the end, we must say that don't forget that we are in a strong upward trend, that the probability of the continuation of the Bister trend is the possibility of a fall...
🔥Follow us for more signals🔥
*Trade safely with us*

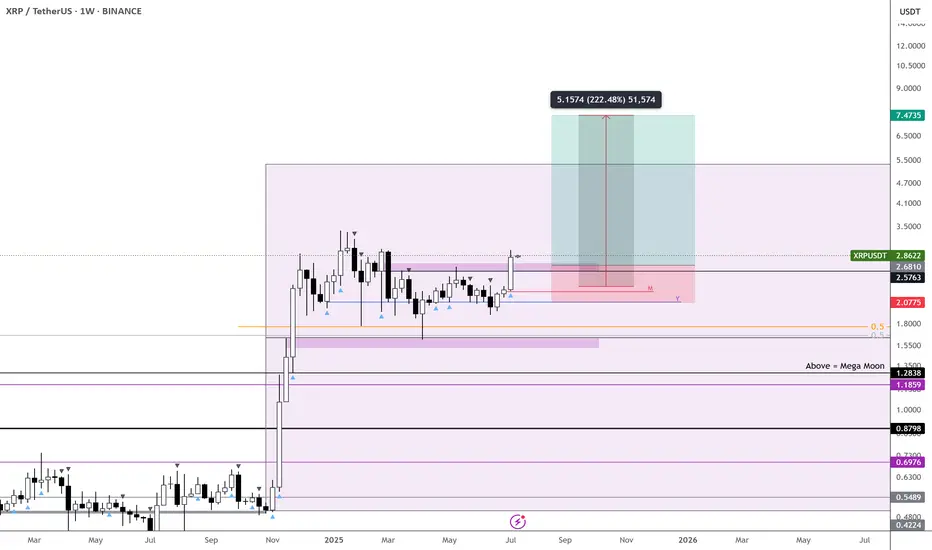
XRP – Dual Trends Active, Ready to Outperform - $7 Incoming
Two active trends on CRYPTOCAP:XRP right now—monthly and weekly confirmations are in, which significantly boosts the probability of hitting the first target.
Honestly, I see this outperforming CRYPTOCAP:ETH , though both are worth holding.
With both timeframes aligned, I’m expecting a strong move.
Targeting $7 on CRYPTOCAP:XRP and over $7k on $ETH.
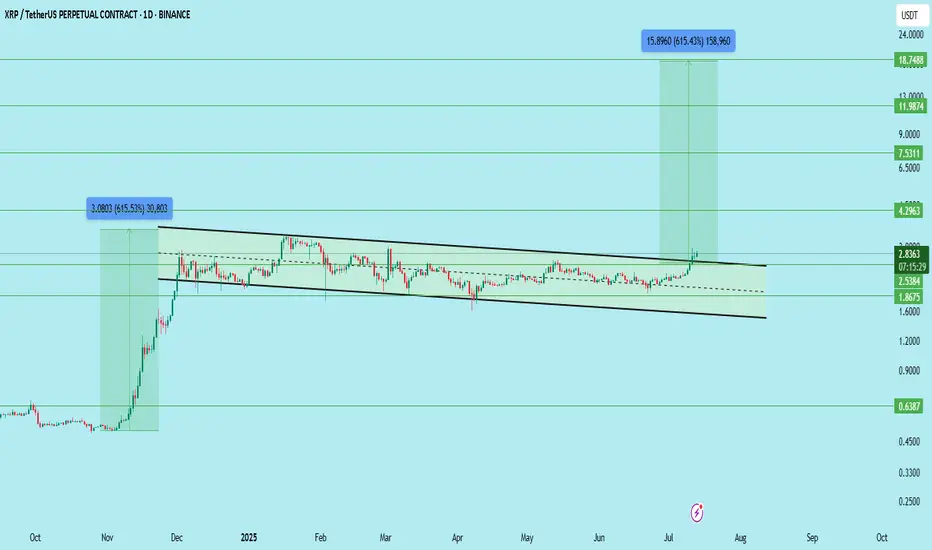
XRP/USDT – Long-Term Breakout Setup FormingXRP has broken out of a multi-month falling channel and is showing early signs of a macro bullish shift. However, price has printed a series of strong green candles, so waiting for a clean retest before entry is advised.
Key Levels:
Support Zones: 2.5384 | 2.00 | 1.8675
Resistance Zones: 2.8340 | 4.2963 | 7.5311 | 11.9874 | 18.7488
Breakout Level: 2.5384 (channel breakout and current structure retest area)
Setup Strategy:
Entry (Ideal): On retest near 2.53–2.60 support zone
Stop Loss: Below 2.00 (or tighter depending on risk appetite)
Target 1: 4.2963
Target 2: 7.5311
Target 3: 11.9874
Target 4 (Final): 18.7488
Upside Potential: Over 600% if the structure plays out fully
Structure Insight:
Multi-month falling channel breakout confirmed
Continuous green candles suggest short-term overextension
Safer entry lies in retest and hold of the breakout zone
Long-term accumulation zone forming between 2.53–2.83
This setup favors long-term investors and swing traders waiting for a macro move. Let the price come to you — avoid chasing.
DYOR | Not Financial Advice
#XRP #Ripple
XRP Technical Analysis – Massive Breakout in Play!After months of tight consolidation inside a symmetrical triangle, XRP/USDT has finally broken out with strong bullish momentum on the daily timeframe.
🔹 Chart Pattern: Symmetrical Triangle
🔹 Breakout Confirmation: Daily candle closed above the descending trendline resistance
🔹 Support Zone: ~$2.00 – $2.20 (Held multiple times since April)
🔹 Breakout Level: ~$2.48 – $2.50
🔹 Next Resistance Levels:
▫️ $2.62 – Minor horizontal resistance
▫️ $3.39 – Major resistance from previous highs
▫️ $4.92 – Long-term macro target (measured move from triangle)
🧠 Why does this breakout matter?
✅ Strong Volume: Breakout happened with increased volume – a sign of genuine breakout
✅ Multi-month Base: The longer the consolidation, the stronger the breakout
✅ Support Respect: XRP respected the demand zone repeatedly, showing accumulation
✅ Momentum Building: A clean break could trigger trend-following bots and new buyers

XRPUSDT BINANCE:XRPUSDT Price broke above the downtrend line but faced resistance at 2.2770 dollars and started correcting. Key supports are at 2.1900 and 2.0800 dollars. If it bounces, resistances to watch are 2.2770, 2.3600, and 2.4620 dollars. Price is currently between key levels.
Key Levels:
Support: 2.1900 – 2.0800
Resistance: 2.2770 – 2.3600 – 2.4620
⚠️Contorl Risk management for trades.

XRP Pattern Repeats—Next Move to $2.34?The XRP/USDT 1-hour chart is showing a compelling setup that may mirror a previously bullish price pattern. The left side of the chart highlights Pattern 1, which played out after a period of sideways consolidation followed by a breakout, resulting in a strong upward move. Now, price action is repeating a similar structure with nearly identical conditions forming.
In Pattern 1, XRP consolidated in a tight range, flipped the trend indicator from red to blue (suggesting a momentum shift), and then surged higher. This same transition is occurring again in the current market phase. Price has reclaimed the trend baseline, which has turned blue, hinting at growing buyer strength.
The idea here is that XRP could be preparing for another impulsive move to the upside, identical to what happened before. The setup is visually marked with a trade box showing entry, stop-loss, and target levels.
Trade Idea Based on Current Pattern
• Entry: 2.2849
• Target: 2.3436
• Stop-loss: 2.2520
• Reward-to-Risk (R:R): ≈ 1.78
• Potential Gain: 2.57%
• Potential Loss: 1.44%
The structure favors a long position, as long as the price holds above the 2.25–2.26 support range. A break below this could invalidate the setup and trigger the stop-loss. If the breakout is confirmed with volume, XRP could move rapidly toward the 2.34 level and possibly beyond.
This kind of fractal behavior, where patterns repeat themselves in similar market conditions, is common in crypto. With the trend indicator already flipping bullish and price forming higher lows, the probability of continuation looks solid—especially for short-term traders.
As always, trade with proper risk management, and be cautious of volatility that can trigger stop-hunts in tightly ranged zones.

#XRP/USDT#XRP
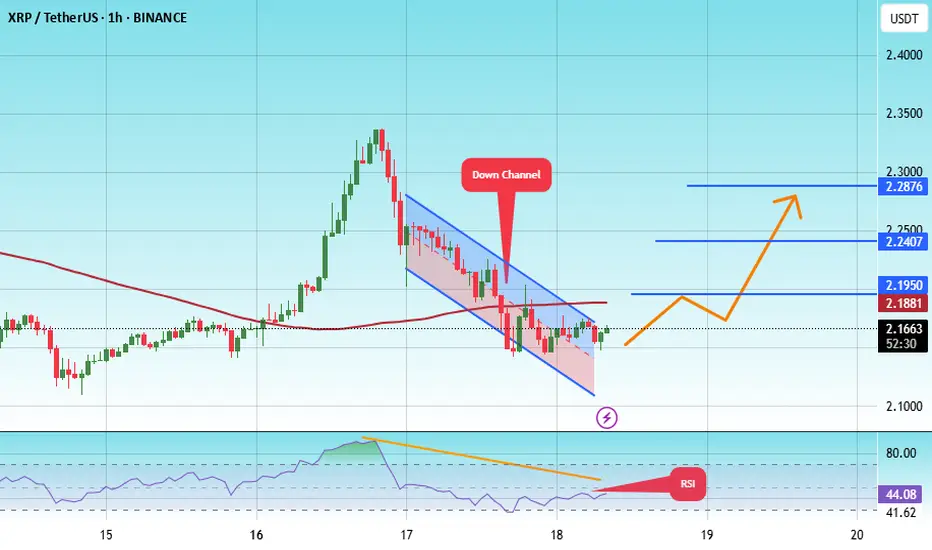
The price is moving within a descending channel on the 1-hour frame, adhering well to it, and is heading towards a strong breakout and retest.
We are experiencing a rebound from the lower boundary of the descending channel, which is support at 2.11.
We are experiencing a downtrend on the RSI indicator that is about to be broken and retested, supporting the upward trend.
We are looking for stability above the 100 Moving Average.
Entry price: 2.16
First target: 2.20
Second target: 2.24
Third target: 2.28
XRP Alert: $3 Bets Dominate as Massive "Wedge" Pattern SignalThe Anatomy of a Sleeper Awakened: Analyzing the $3 XRP Bet and the Decisive XRP/BTC Technical Pattern
In the relentless and often forgetful cycle of the cryptocurrency market, assets can fall into long periods of dormancy. They become laggards, overshadowed by newer, faster-growing projects, their communities tested, and their price action a flat line of disappointment on a chart full of parabolic curves. For years, XRP has been the quintessential example of such an asset. Plagued by a protracted legal battle with the U.S. Securities and Exchange Commission (SEC) and consistently underperforming its large-cap peers, it became the subject of both unwavering belief from its dedicated "XRP Army" and derision from the wider market.
However, the quietest corners of the market often hide the most tension. Beneath the surface of sideways price action, a confluence of powerful forces is beginning to emerge, suggesting that this slumbering giant may be on the verge of a violent awakening. This shift is not signaled by mainstream headlines or celebrity endorsements, but by the sophisticated and often predictive language of derivatives markets and inter-market technical analysis.
Two specific, potent signals have captured the attention of astute market observers. The first is a stunning development in the XRP options market, where call options with a $3 strike price are inexplicably dominating trading volumes. This is not a modest bet on a 20% gain; it is an audacious, seemingly irrational wager on a 500-600% price explosion. The second is a multi-year technical pattern on the XRP/BTC chart—a massive falling wedge that suggests XRP is coiling for a major rally, not just in dollar terms, but against the market's undisputed king, Bitcoin.
This analysis will conduct a deep dive into these two phenomena. We will dissect the implications of the $3 options bet, exploring the psychology and mechanics behind such speculative fervor. We will then meticulously break down the XRP/BTC wedge pattern, explaining its significance as a measure of relative strength and its potential to unleash a powerful wave of capital rotation. Finally, we will connect these market signals to the underlying fundamental drivers—the aftermath of the SEC lawsuit, Ripple's ongoing business development, and the broader market cycle dynamics—to construct a holistic thesis. While the road ahead is fraught with risk and uncertainty, the evidence suggests that the narrative surrounding XRP is undergoing a seismic shift, moving from a story of legal battles and stagnation to one of profound, speculative optimism.
________________________________________
Part 1: Decoding the Options Market Frenzy - The Audacity of the $3 Bet
To the uninitiated, the options market can seem like an esoteric and complex casino. In reality, it is a sophisticated mechanism for hedging risk and placing directional bets, and the data it generates provides an invaluable window into the collective mind of the market. The current activity in the XRP options market is not just a flicker of interest; it is a roaring fire of speculative conviction centered around a single, audacious number: $3.
Understanding the Language of Options
Before dissecting the significance of this event, it is crucial to understand the basic mechanics at play. A call option gives the buyer the right, but not the obligation, to purchase an asset at a predetermined price (the strike price) on or before a specific date (the expiration date).
For example, a trader buying an XRP call option with a $3 strike price is betting that the price of XRP will rise significantly above $3 before the option expires. If XRP were to reach, say, $4, the trader could exercise their option to buy XRP at $3 and immediately sell it for $4, pocketing the difference.
The key takeaway is that these options are leveraged instruments. A trader can control a large amount of XRP for a small upfront cost (the premium). However, if the price of XRP does not exceed the strike price by the expiration date, the option expires worthless, and the trader loses their entire premium. This makes buying far out-of-the-money (OTM) call options—where the strike price is significantly higher than the current market price—an extremely high-risk, high-reward strategy.
The Significance of the $3 Strike Price
The current market price of XRP hovers around $0.50 to $0.60. A $3 strike price, therefore, is not a bet on incremental gains. It is a bet on a monumental, life-changing rally of approximately 500%. This is what makes the situation so extraordinary. The fact that this specific strike price is the most traded in terms of volume indicates a massive concentration of speculative interest.
This phenomenon can be interpreted in several ways:
1. Extreme Bullish Conviction: The most straightforward interpretation is that a significant number of traders, from retail speculators to potentially larger funds, harbor a deep-seated belief that a major catalyst is on the horizon. This could be related to a final, favorable resolution in the SEC case, a major partnership announcement by Ripple, or the anticipated effects of a full-blown crypto bull market lifting all boats, with XRP expected to be a primary beneficiary. They are willing to risk a small premium for a chance at an exponential payout.
2. "Lottery Ticket" Mentality: A more skeptical view is that these are akin to lottery tickets. The premiums on these far OTM options are relatively cheap. A trader might spend a few hundred dollars on $3 calls, fully accepting that they will likely expire worthless. However, in the infinitesimally small chance that XRP does experience a black swan event to the upside, that small investment could turn into tens of thousands of dollars. It is a bet on volatility and a low-probability, high-impact event, rather than a nuanced analysis of fair value.
3. Potential for a Gamma Squeeze: This is a more complex but critical possibility. When a large number of call options are purchased, the market makers who sell these options are left with a short position. To hedge their risk, they must buy the underlying asset (XRP). As the price of XRP begins to rise and approach the strike price, the market makers' risk increases exponentially, forcing them to buy more and more XRP to remain hedged. This reflexive loop—rising prices forcing more buying, which in turn pushes prices even higher—is known as a gamma squeeze. The massive open interest at the $3 strike, while currently far away, builds a foundation of potential explosive fuel. If a rally were to gain serious momentum and push past $1, then $1.50, the hedging pressure on market makers would begin to mount, potentially turning a strong rally into a parabolic one.
4.
Analyzing the Volume and Open Interest
"Dominating trading volumes" means that more contracts for the $3 strike are changing hands daily than for any other strike price, whether it's a more conservative $0.75 or $1.00 call. This indicates active, ongoing betting. Open interest, on the other hand, refers to the total number of outstanding contracts that have not been settled. High open interest at the $3 strike signifies that a large number of participants are holding these positions, not just day-trading them. They are maintaining their bet over time, waiting for the anticipated price move.
The sheer concentration of both volume and open interest at such a high strike price is a powerful sentiment indicator. It tells us that the "smart money" or, at the very least, the most aggressive speculative capital, is not positioning for a minor recovery. It is positioning for a complete and total repricing of the asset. While this does not guarantee the outcome, it creates a self-fulfilling prophecy dynamic. The knowledge that this much speculative interest exists can itself attract more buyers, who want to front-run the potential squeeze.
________________________________________
Part 2: The Technical Tale of the Tape - XRP/BTC's Coiled Spring
While the options market provides a glimpse into the speculative sentiment surrounding XRP's dollar value, a far more profound story is being told on the XRP/BTC chart. This trading pair is arguably one of the most important long-term indicators for any altcoin, as it measures its performance not against a fiat currency, but against the crypto market's center of gravity: Bitcoin.
The Crucial Importance of the XRP/BTC Pair
When XRP/USD rises, it can simply mean the entire crypto market, led by Bitcoin, is in an uptrend. However, when XRP/BTC rises, it signifies something much more powerful: XRP is outperforming Bitcoin. This means that capital is actively rotating out of the market leader and into XRP, seeking higher returns. A sustained uptrend in the XRP/BTC pair is the hallmark of a true "altcoin season" for that specific asset and is often the precursor to the most explosive, parabolic moves in its USD valuation.
For the past several years, the XRP/BTC chart has been a painful sight for XRP holders. It has been in a brutal, grinding downtrend, meaning that even when XRP's dollar price rose, holding Bitcoin would have been a more profitable strategy. This long period of underperformance, however, has forged one of the most powerful bullish reversal patterns in technical analysis: a falling wedge.
Anatomy of the Falling Wedge
A falling wedge is a technical pattern that forms when an asset's price makes a series of lower highs and lower lows, with the two trendlines converging. The key characteristic is that the lower trendline (support) is less steep than the upper trendline (resistance).
• Psychology Behind the Pattern: The pattern represents a battle between buyers and sellers where the sellers are gradually losing their momentum. Each new push lower by the bears is met with more resilience from the bulls, and the price fails to fall as far as it did previously. The contracting range signifies that volatility is decreasing and energy is being stored. It is a period of consolidation that often precedes a major trend reversal. The bears are getting exhausted, and the market is coiling like a spring.
• The Breakout: The bullish signal is triggered when the price breaks decisively above the upper trendline (resistance) of the wedge. This breakout indicates that the balance of power has finally shifted from the sellers to the buyers. A valid breakout is typically accompanied by a significant increase in volume, confirming the conviction behind the move.
• Price Target: Technical analysts often measure the potential price target of a wedge breakout by taking the height of the wedge at its widest point and adding it to the breakout point. Given that the XRP/BTC wedge has been forming for several years, its height is substantial, suggesting that a successful breakout could lead to a rally of 200-300% or more against Bitcoin.
Analyzing the XRP/BTC Chart
The multi-year falling wedge on the XRP/BTC weekly and monthly charts is a textbook example of this pattern. It encapsulates the entire bear market and period of underperformance since the previous cycle's peak. The price has been tightening into the apex of this wedge for months, signaling that a resolution is imminent.
A breakout from this pattern would be a technical event of immense significance. It would signal the end of a multi-year bear market against Bitcoin and the beginning of a new cycle of outperformance. Traders and algorithms that monitor these patterns would interpret it as a major "buy" signal, potentially triggering a flood of new capital into XRP.
This technical setup provides a logical foundation for the seemingly irrational optimism seen in the options market. The traders betting on $3 XRP are likely looking at the XRP/BTC chart and seeing the same thing: the potential for a violent and sustained reversal. A 200% rally in XRP/BTC, combined with a rising Bitcoin price in a bull market, could easily provide the momentum needed to propel XRP's dollar valuation into the multi-dollar range. The two signals are not independent; they are two sides of the same coin, reflecting a deep and growing belief in an impending, historic rally.
________________________________________
Part 3: The Fundamental Undercurrents - The 'Why' Behind the 'What'
The explosive options activity and the powerful technical pattern are the "what." They are the observable phenomena. But to build a robust thesis, we must understand the "why." What fundamental shifts are occurring to justify this renewed optimism? The answer lies in a combination of legal clarity, steady business development, and predictable market cycle dynamics.
The Aftermath of the Ripple vs. SEC Lawsuit
The single greatest cloud hanging over XRP for years has been the SEC lawsuit, filed in December 2020, which alleged that XRP was an unregistered security. This created massive regulatory uncertainty, leading to its delisting from major U.S. exchanges and causing institutional capital to shun the asset.
In July 2023, a landmark summary judgment was delivered by Judge Analisa Torres. The key takeaways were:
1. Programmatic Sales of XRP on exchanges do not constitute securities transactions. This was a monumental victory for Ripple and the XRP community. It provided the legal clarity that exchanges needed to relist XRP, and it affirmed that for the average retail buyer, XRP is not a security. This removed the primary existential threat to the asset.
2. Institutional Sales of XRP were deemed securities transactions. This was a partial victory for the SEC, but it was confined to Ripple's direct sales to institutional clients in the past.
While the case is not fully over—with final remedies and penalties for institutional sales still being determined—the market has correctly interpreted the main ruling as a decisive win. The risk of XRP being declared a security across the board has been neutralized. This clarity is the single most important fundamental catalyst. It allows exchanges, investors, and partners to engage with XRP with a level of confidence that was impossible just a few years ago. The market is now looking past the remaining legal wrangling and focusing on the future.
Ripple's Unwavering Business Development
Throughout the entire legal battle, Ripple, the company, never stopped building. Its core mission is to use blockchain technology to improve cross-border payments, a multi-trillion dollar industry ripe for disruption. XRP, the digital asset, is central to its flagship product, Ripple Payments (formerly On-Demand Liquidity or ODL). This service uses XRP as a bridge currency to enable instant, low-cost international payments without the need for pre-funded nostro/vostro accounts.
Ripple has been steadily expanding its payment corridors, securing licenses in key jurisdictions like Singapore, Dubai, and Ireland, and forging partnerships with financial institutions around the globe. Furthermore, the company is actively involved in the development of Central Bank Digital Currencies (CBDCs), piloting its technology with several nations.
The recent announcement of a Ripple-issued stablecoin pegged to the U.S. dollar further expands its ecosystem. This move positions Ripple to compete in the massive and growing stablecoin market, leveraging the XRP Ledger's speed and efficiency.
This steady, behind-the-scenes progress provides a fundamental anchor to the speculative bets being placed. Unlike many crypto projects that are built on hype alone, Ripple has a real-world use case, a functioning business, and a clear strategy for capturing a share of the global payments market. The resolution of the SEC case allows this fundamental value proposition to finally come to the forefront.
The Inevitable Laggard Rotation
Finally, the optimism surrounding XRP can be explained by classic crypto market cycle dynamics. A typical bull market cycle follows a predictable pattern of capital rotation:
1. Bitcoin Leads: Capital first flows into Bitcoin, the market's most established and trusted asset.
2. Rotation to Ethereum: As Bitcoin's gains begin to slow, profits are rotated into Ethereum, the leading smart contract platform.
3. Large-Cap Altcoins: Capital then flows from Ethereum into other large-cap altcoins.
4. The Laggard Rally: Finally, in the latter stages of a bull run, traders seek out assets that have underperformed, or "lagged," the market. These laggards, often older coins with strong communities, can experience explosive catch-up rallies as a flood of speculative capital seeks the next big move.
XRP is the archetypal laggard. It has massively underperformed both Bitcoin and Ethereum for years. The bets being placed now—both in the options market and on the XRP/BTC chart—are a clear anticipation of this final, powerful stage of the market cycle. Traders are positioning themselves to front-run the great capital rotation into one of the market's most well-known but long-neglected assets.
________________________________________
Part 4: A Sobering Perspective - Risks and Counterarguments
No analysis would be complete without a balanced look at the potential risks that could invalidate the bullish thesis. While the confluence of signals is powerful, success is far from guaranteed.
1. The Options Trap: The most obvious risk is that the $3 call options are simply a mirage. The vast majority of far out-of-the-money options expire worthless. This could be nothing more than a wave of irrational exuberance from retail traders that ultimately amounts to nothing, leaving a trail of lost premiums.
2. The False Breakout: Technical patterns can fail. The XRP/BTC wedge could experience a "fakeout," where the price briefly breaks above the resistance line only to be aggressively sold back down, trapping hopeful buyers and resuming the downtrend.
3. Lingering Legal Headwinds: While the main ruling was a victory, the final penalty in the SEC case could be larger than anticipated, generating negative headlines and creating short-term selling pressure. Any future regulatory actions targeting other aspects of the crypto space could also have a chilling effect.
4. Adoption and Competition: Ripple's success is not preordained. The cross-border payments space is fiercely competitive, with traditional players like SWIFT innovating and other blockchain projects vying for market share. The ultimate success of Ripple's business model—and by extension, the utility-driven demand for XRP—is still a long-term question.
5. Centralization and Supply Concerns: A long-standing criticism of XRP is the centralized nature of its ledger and the large portion of the total XRP supply held in escrow by Ripple Labs. While Ripple has a predictable schedule for releasing this escrow, it represents a potential source of selling pressure and a point of concern for those who prioritize decentralization above all else.
Conclusion: The Convergence of Evidence
The case for a significant XRP rally is a tapestry woven from multiple, converging threads of evidence. It is not based on a single indicator but on a powerful confluence of speculative sentiment, technical structure, and fundamental catalysts.
The frenzied buying of $3 call options is the market screaming its ambition, a raw and unfiltered signal of extreme bullishness. It is a bet not just on recovery, but on a complete paradigm shift in the valuation of XRP. This audacious sentiment finds its technical justification in the multi-year falling wedge on the XRP/BTC chart—a coiled spring of potential energy that, if released, would signal a historic rotation of capital into the long-suffering asset.
Underpinning these market signals is a strengthening fundamental picture. The crucial legal clarity from the SEC lawsuit has removed the single greatest obstacle to XRP's progress, allowing the market to finally price in the steady, persistent work Ripple has done in building a global payments network. Combined with the predictable dynamics of a crypto bull cycle, where laggards eventually have their day in the sun, the stage appears to be set.
The journey to $3—and beyond—is still a marathon, not a sprint. It is fraught with the risks of failed patterns, expiring options, and the inherent volatility of the crypto market. However, for the first time in years, the narrative is not one of defense but of offense. The signals are clear: the market is no longer asking if the sleeper will awaken, but is now placing massive, leveraged bets on the magnitude of the roar it will make when it does. The current moment represents the starting gun, and for traders and investors who have been watching from the sidelines, the race for XRP's repricing may have just begun.

XRP is about to break out again, on its way to our $10 target.XRP is finally breaking out of consolidation — momentum is building towards our first major target at $10!
🎯 Target 1: $10
🎯 Target 2: $15–$20
Let’s go! 🚀 Good luck, everyone!
