Price delivered the signal — now it’s time to follow structure.XRP isn’t reacting randomly. It’s responding to engineered inefficiencies and prior OBs that most overlook. What looks like resistance to others is just a staging ground for continuation.
Here’s the play:
Price ran into the 1H OB at 2.2219 — hesitation here was expected
We’re now pulling back into the equilibrium zone, anchored by 0.382–0.618 fib (2.1886–2.1680)
This zone also aligns with the previous 1H OB — an accumulation base that already proved itself
If price holds above 2.1533 and shows rejection at the 0.5 fib (2.1783), I expect the next leg to take out 2.2219 and push toward the 4H OB.
Execution thesis:
Ideal long re-entry is in the 2.18–2.16 zone
Invalidation below 2.1346
Targets: 2.2476 → 2.3107, with 2.2219 as first test
This isn’t about chasing highs. It’s about aligning with structure and letting the draw on liquidity do its work.
Want more trades delivered with this level of clarity? The account description has them. I don’t forecast with hope — I forecast with models.
Xrpusdlong

They waited for confirmation. I bought the retrace.XRP didn’t reverse. It refined.
After reclaiming the rounded base and pushing into a 1H OB, price rotated perfectly into the 0.5 retracement at 2.1419 — tagging the breaker wick, respecting structure, and front-running the deeper 0.618 by a hair.
This isn’t weakness. It’s an engineered dip into fresh demand. Smart Money logic doesn’t require “green candles” — it requires imbalance filled and structure respected. That’s exactly what we have here.
Now, price is boxed between two intentions:
If we hold 2.1419, the draw becomes the 1H OB above — 2.1758 to 2.2060.
If we break that level with conviction, 2.1268–2.1052 will serve as the next rebalance zone before any macro continuation.
Execution tier:
✅ Long bias above: 2.1419
🎯 Target 1: 2.1758
🎯 Target 2: 2.2060
❌ Invalidation: Clean 1H body close below 2.1268
Retail waits for signals.
Smart Money builds in silence — and exits with intent.

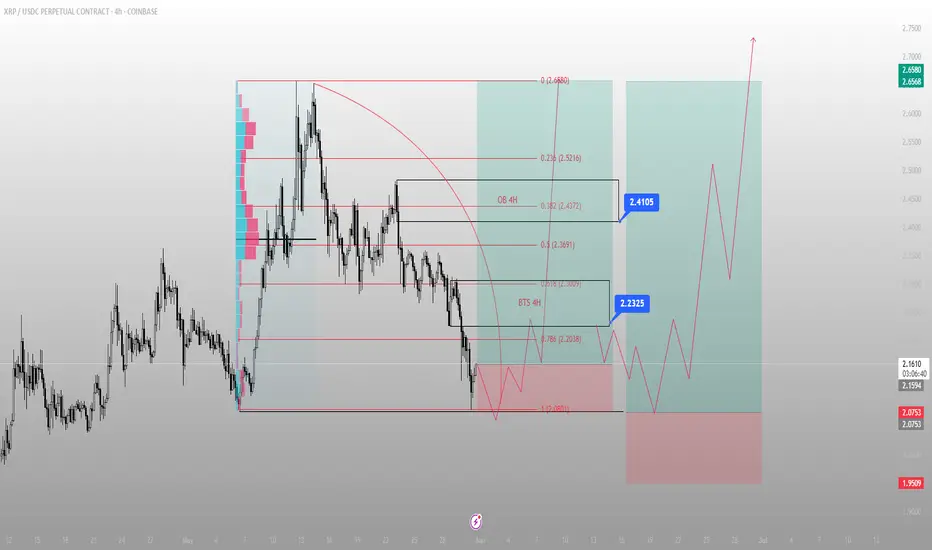
XRP didn’t break down. It just returned to origin.There was no crash. Just a clean delivery.
BINANCE:XRPUSDC swept the prior low and tapped directly into the 1.0 extension of the move — right at 2.0901 — closing below liquidity, only to reclaim it on the next candle. That’s not weakness. That’s Smart Money reloading.
Below that low sits the 4H BTS zone, overlapping the 0.618 and 0.786 retracements (2.2038–2.2325). That zone was engineered. Built. Not random. Price has already started responding.
The first draw is clear: 2.2325 — back into the inefficiency left behind on the breakdown. From there, we face a clean decision point at 2.4105. That’s where OB meets .382 retracement — and it’s a known trap zone for liquidity.
If price rips through it, 2.5216 becomes the magnet. If it rejects, I’ll be watching for a final mitigation before the full macro expansion.
Execution clarity:
✅ Entry: Inside BTS 4H zone (2.0901–2.2038)
🎯 Target 1: 2.2325
🎯 Target 2: 2.4105 (4H OB + liquidity pool)
🛑 Invalidation: Close below 1.9509
XRPUSD at weekly support, ready to aim for 3$XRPUSDT is currently sandwiched between weekly support WS1 and weekly resistance WR1.
The price is currently trading inside weekly support WS1.
This is the place from where it should find support and gather necessary momentum for a bounce.
The bounce from WS1 shall lead the price to the daily resistance around 2.57 marked with horzontal blue line on the chart.
There the price is likely to face some pullback towards 2..36 only to come back again with force to go beyond this daily resistance zone.
This next move upward after the pullback from daily resistance around 2.57, shall lead the price to weekly resistance WR1 around 3$.

Ripple buy signalHello friends
Given the good growth we had, we entered a deep correction, and now we have the opportunity to buy step by step in the specified support areas with capital and risk management and move with it to the specified targets.
*Trade safely with us*

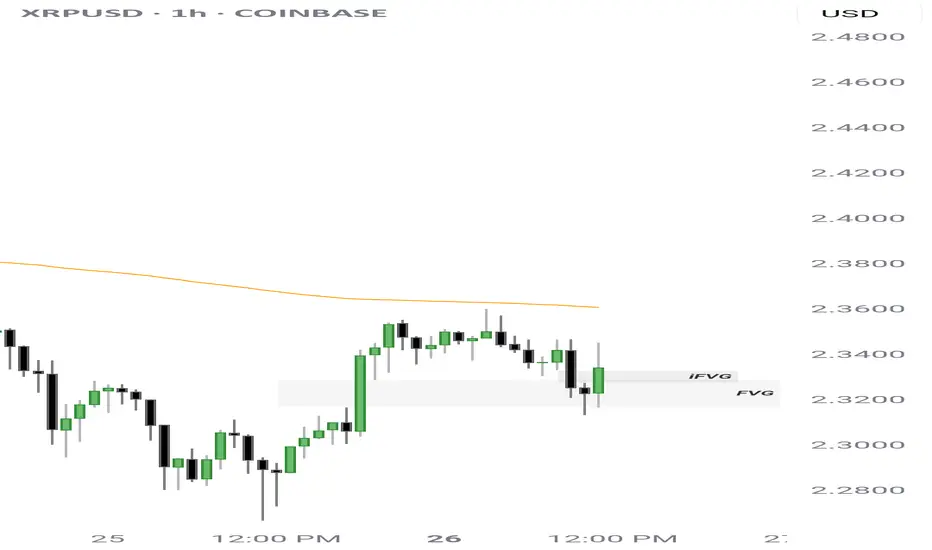
XRP BULLISH bounce off $2.32 FVG followed up with a bullish Inversion FVG forming.
This week we will break above $2.40 & may never see sub $2.20 XRP ever again. The next leg up will be a very fast move up, leaving many empty handed.
What does your exit strategy look like?
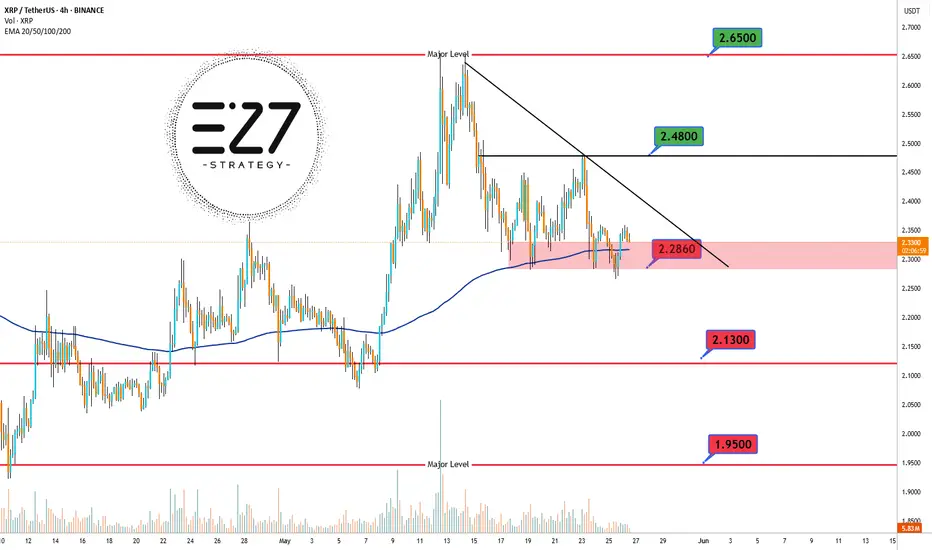
XRPUSDT The 4-hour chart of BINANCE:XRPUSDT shows that the overall trend remains bullish, but the price is currently in a corrective downward phase. 📉 At the moment, XRP is trading in a highly critical zone, right at the 2.2860 USDT support level, which aligns with the 200 EMA — often considered a dynamic support area. 🛡️ Despite this confluence, the price still sits below the descending trendline, indicating continued bearish pressure. ⚠️ If the price manages to hold this key zone and break above the trendline, a move toward the next resistance at 2.4800 USDT and potentially 2.6500 USDT could follow. 🚀 However, losing the 2.2860 support could trigger a deeper drop toward 2.1300 USDT and even 1.9500 USDT. ❗ This current level, where static support intersects with the 200 EMA, is a make-or-break zone that will likely define the short-term direction of XRP.
Support & Resistance Levels:
🔼 Major Resistance: 2.6500 USDT
🔼 Secondary Resistance: 2.4800 USDT
⚡ Dynamic Resistance (trendline): ~2.3500 USDT
🔽 Key Support (current price level): 2.2860 USDT
🔽 Secondary Support: 2.1300 USDT
🔽 Major Support: 1.9500 USDT
XRUSD Price Market Trend Day TF Long Term BUYXRPUSD is trading at 2.33674, with a strong recommendation to buy for long-term gains. The chart indicates a potential upward trajectory, with price targets set at:
TP1: 2.44200 (Near-term resistance)
TP2: 3.00500 (Mid-term target)
TP3: 3.40000 (Long-term bullish goal)
The mention of 3.40000 at the top of the chart suggests this is a psychological resistance level, reinforcing the optimistic outlook if bullish momentum sustains.

XRPWe must fill the gap at $2.15 before we move higher.
I believe we will continue moving down through the end of May, until then we must Dollar Cost Average.
This is not financial advice, but this is what I will be doing moving forward.

XRPXRP just created a Inversion FVG on the 1h timeframe, paired with a sweep of the Previous Day Lows, indicates a strong move upwards.
We should see a retest of Previous Day High at $2.36 which may lead to a test of a 4h FVG between $2.38 - $2.40.
If we get any big announcements this weekend, we may see run towards $3 heading into the week.
Have an exit strategy once we have our banana move, it's been a great journey.
LOCK IN.

#XRP/USDT#XRP
The price is moving within a descending channel on the 1-hour frame, adhering well to it, and is heading for a strong breakout and retest.
We are seeing a bounce from the lower boundary of the descending channel, which is support at 2.29.
We are seeing a downtrend on the RSI indicator that is about to break and retest, supporting the upward trend.
We are looking for stability above the 100 Moving Average.
Entry price: 2.30
First target: 2.33
Second target: 2.37
Third target: 2.42

#XRP/USDT#XRP
The price is moving in a descending channel on the 1-hour frame and is expected to continue upward.
We have a trend to stabilize above the 100 moving average once again.
We have a downtrend on the RSI indicator, which supports the upward move with a breakout.
We have a support area at the lower boundary of the channel at 2.25.
Entry price: 2.34
First target: 2.42
Second target: 2.47
Third target: 2.56

Next levels for XRP!This Gann arc held as support and price will go right to the next arc. I'm seeing a confluence with th 1.618!
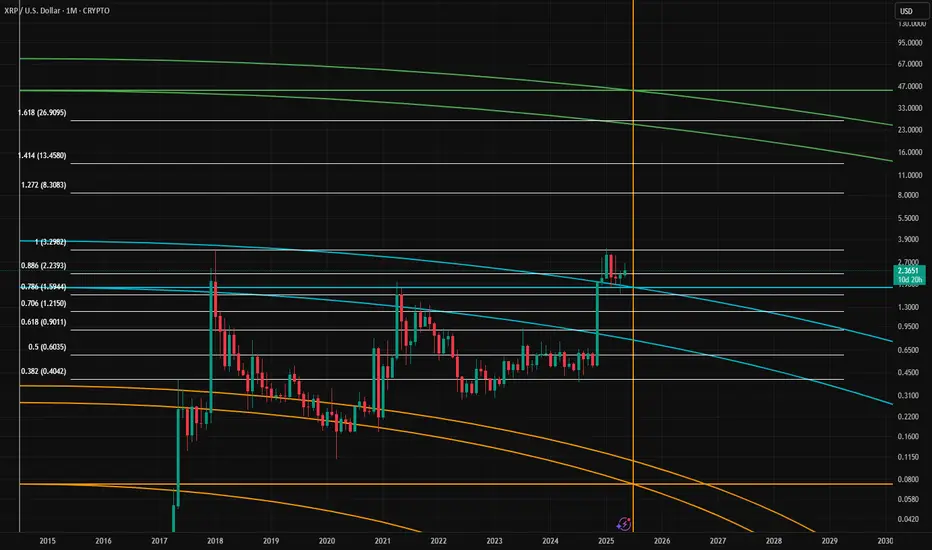
Next levels for XRPThis Gann arc held as support and price will go right to the next arc. I'm seeing a confluence with th 1.618!

XRP : LONG FOR THIS WEEK !Hello friends
Considering the good growth we had, you can see that the price has formed a double top pattern and corrected after reaching its ceiling.
Now, with the price correction, there is a good opportunity to buy in stages and with capital management and move with it to the specified goals.
*Trade safely with us*

Is XRP About to Rebound? Bullish Signals EmergeXRP Flashes Bullish Signal: Technical Indicator Hints at Imminent Rebound – 100x Gains Coming? The Future Is Closer Than You Think—Analyst
The cryptocurrency market is a volatile and often unpredictable space, where fortunes can be made and lost in the blink of an eye. Among the myriad of digital assets vying for attention, XRP, the cryptocurrency associated with Ripple Labs, has consistently been a topic of intense debate and speculation. While it has faced its fair share of challenges, including regulatory scrutiny and market fluctuations, XRP continues to hold the interest of investors and analysts alike.
Recently, XRP has been displaying what some experts are interpreting as bullish signals, suggesting a potential rebound in its price. These signals are primarily derived from technical analysis, a method of evaluating assets by analyzing statistical trends gathered from trading activity, such as price movement and volume. One particular technical indicator is hinting at an imminent upswing, leading some analysts to predict significant gains for XRP in the near future.
This article delves into the technical indicators flashing bullish signals for XRP, examines the factors that could contribute to a potential rebound, and explores the possibility of a 100x gain, a prospect that has captured the imagination of many XRP enthusiasts.
Technical Indicators Pointing Towards a Rebound
Technical analysis plays a crucial role in understanding potential price movements in the cryptocurrency market. Several indicators are currently suggesting a bullish outlook for XRP:
1. Moving Averages: Moving averages are commonly used to smooth out price data over a specific period, helping to identify trends. When a shorter-term moving average crosses above a longer-term moving average, it is often seen as a bullish signal, indicating that the price is likely to rise. XRP has recently exhibited this "golden cross" pattern on certain timeframes, suggesting a potential upward trend.
2. Relative Strength Index (RSI): The RSI is a momentum indicator that measures the magnitude of recent price changes to evaluate overbought or oversold conditions in the price of an asset. An RSI value below 30 typically indicates that an asset is oversold and may be due for a rebound. XRP's RSI has been hovering in oversold territory, suggesting that buying pressure could soon increase.
3. Fibonacci Retracement Levels: Fibonacci retracement levels are horizontal lines that indicate potential support and resistance levels based on the Fibonacci sequence. These levels are often used to predict where the price of an asset might find support during a downtrend or resistance during an uptrend. XRP has been testing key Fibonacci retracement levels, and a successful breakout above these levels could signal a significant price increase.
4. Chart Patterns: Technical analysts also look for specific chart patterns that can provide clues about future price movements. Some patterns, such as the "inverse head and shoulders" or the "double bottom," are considered bullish formations, suggesting that the price is likely to rise. XRP has been forming patterns that resemble these bullish formations, further supporting the possibility of a rebound.
Factors Contributing to a Potential XRP Rebound
While technical indicators can provide valuable insights, it is essential to consider the fundamental factors that could influence XRP's price. Several factors could contribute to a potential rebound:
1. Ripple's Ongoing Legal Battle with the SEC: The most significant factor weighing on XRP's price has been Ripple's legal battle with the U.S. Securities and Exchange Commission (SEC). The SEC alleges that Ripple sold XRP as an unregistered security, a claim that Ripple vehemently denies. A favorable outcome in this case could significantly boost XRP's price, as it would remove a major source of uncertainty and regulatory risk.
2. Growing Adoption of XRP for Cross-Border Payments: Ripple has been actively promoting XRP as a solution for cross-border payments, touting its speed, efficiency, and low cost compared to traditional methods. Increased adoption of XRP by financial institutions and payment providers could drive demand for the cryptocurrency, leading to a price increase.
3. Expansion of Ripple's Ecosystem: Ripple has been expanding its ecosystem by developing new products and services that utilize XRP. These include RippleNet, a network of financial institutions that use Ripple's technology for cross-border payments, and On-Demand Liquidity (ODL), a service that allows businesses to use XRP to source liquidity for cross-border transactions. A thriving ecosystem could attract more users and investors to XRP, further supporting its price.
4. Overall Cryptocurrency Market Sentiment: XRP's price is also influenced by the overall sentiment in the cryptocurrency market. A positive market sentiment, characterized by rising prices and increased investor confidence, could lift XRP along with other cryptocurrencies. Conversely, a negative market sentiment could put downward pressure on XRP's price.
The Possibility of a 100x Gain: A Realistic Scenario?
The prospect of a 100x gain in XRP's price has captured the imagination of many investors. While such a gain is certainly possible, it is essential to approach this scenario with a healthy dose of skepticism and realism.
To achieve a 100x gain, XRP's price would need to increase by a factor of 100 from its current level. This would require a massive influx of capital into XRP, driven by a combination of factors, such as a favorable outcome in the SEC case, widespread adoption of XRP for cross-border payments, and a significant increase in overall cryptocurrency market capitalization.
While these factors are not entirely out of the realm of possibility, they are by no means guaranteed. The cryptocurrency market is inherently unpredictable, and unforeseen events could derail any potential rally in XRP's price.
Analyst Perspective: The Future Is Closer Than You Think
Despite the inherent risks and uncertainties, some analysts remain optimistic about XRP's future. These analysts point to the potential for XRP to disrupt the traditional cross-border payments industry, the growing adoption of Ripple's technology, and the possibility of a favorable outcome in the SEC case as reasons for their bullish outlook.
One analyst, in particular, has stated that "the future is closer than you think" for XRP, suggesting that significant gains could be realized in the near future. This analyst believes that XRP is currently undervalued and that its price could surge once the regulatory uncertainty surrounding Ripple is resolved.
Conclusion: Navigating the XRP Landscape
XRP presents a complex and often contradictory picture. Technical indicators are flashing bullish signals, suggesting a potential rebound in its price. Factors such as Ripple's ongoing legal battle with the SEC, growing adoption of XRP for cross-border payments, and the overall cryptocurrency market sentiment could all play a role in determining XRP's future.
While the possibility of a 100x gain is enticing, it is essential to approach this scenario with caution and realism. The cryptocurrency market is inherently volatile, and unforeseen events could impact XRP's price.
Ultimately, whether XRP achieves its full potential remains to be seen. However, the recent bullish signals and the ongoing developments surrounding Ripple suggest that the future of XRP is closer than many might think. As always, investors should conduct their own research, assess their risk tolerance, and make informed decisions before investing in any cryptocurrency, including XRP.

Is XRP the Next Crypto Rocket?$2,5 Breakout Targets $3.5 or moreI see a clear setup with actionable insights. The chart shows XRP forming a range and deviation at 1.77$, with a recent bullish breakout attempt. Here’s my breakdown:
Technical Analysis
Deviation of the global range points at potential consolidation(blue horizontal line)
Breakout Attempt: A sharp green candle pushed above the $2,36 resistance, but it’s yet to close convincingly above it. The red arrow projecting upward suggests optimism for a move toward $3–$3,5if the breakout holds.
Given today’s date (May 18, 2025, 03:40 PM EEST), this setup aligns with recent crypto market trends. XRP’s price action could be reacting to broader market sentiment, regulatory news, or Ripple-related developments, which have historically driven volatility.
This chart screams opportunity if the breakout holds. However, watch for a false breakout—crypto is notorious for shakeouts. A failure to close above $2,5 could see price retrace to $2,3 or lower. I’d monitor the next 2-3 weeksfor confirmation.

XRPHighly likely XRP retest $2.20 before moving higher.
Long-term investors are looking for lower prices before a tariff deal with China. A liquidity sweep is needed before we move higher, or we will continue moving lower.
We break $2.50 and we will see $3 quickly after. ETF going Live on the 19th, China deal, SEC case ending will all catapult price.
LOCK IN 🔐

XRPWe are fixing to witness a run to $3 in a hurry.
New outlets, governments, banks, institutions, are all diving into crypto. An ounce of great news for XRP sends us moving up in a HURRY.
Have an exit strategy in place to take profits, and cycle some profits into other assets to continue to build your wealth.
Lock In.

XRPUSDT - On the verge of historic Rally!- On the 3-day chart, XRP displays a breakout from the bullish pennant pattern, with a target implying nearly 200% upside from the breakout point — which aligns perfectly with the Fibonacci level 2.
- Additionally, price has broken above the neckline of the inverse Head and Shoulders pattern, further confirming bullish momentum.
-From an Elliott Wave perspective, the first four waves of the impulse sequence are complete, and we are now likely entering the fifth and final wave, which is estimated to be shorter than Wave 3. When applying this projection, Wave 5 also ends near the Fibonacci level 2.
Everything on the chart is aligned with impressive precision — there's no room for luck or coincidence here.
The Fibonacci 2 level is around $7. Try to accumulate XRP now, as no major corrections are expected in the coming days.
Best Regards Ceciliones🎯

XRP Breakout Alert – Watching 3.3, 3.8, and 5.0 TargetsXRP/USDT just broke out of a 5-month sideways structure, finally pushing through the descending trendline (triangle resistance).
We're now testing the key 2.7 zone—a critical area where I believe a strong close with volume is needed to confirm this breakout.
If we get that confirmation, the next upside target is around the previous high near 3.3, followed by Fib extension levels at:
1.618 = 3.81
2.618 = 5.08
The weekly chart supports this breakout idea as well, price held above the previous demand and MACD is slowly curling up.
BINANCE:XRPUSDT Summary:
1. Breakout from triangle confirmed
2. Watching for strong close above 2.7
3. Targets: 3.3 (previous high), 3.81, 5.08
4. Weekly & daily both show structure support
Let’s see if XRP can reclaim its momentum.

XRPUSDT Bullish Setup – Swing Trade Opportunity Toward $6.00XRP has shown a consistent pattern of strong bullish impulses followed by consolidation zones, and this rhythm has repeated multiple times on the weekly chart—signaling high confidence in pattern continuation.
Let's break it down
🔁 Repetitive Buying + Consolidation Patterns
19 Sep 2022: Strong buying candle triggered a short-term rally, followed by a multi-week consolidation period.
10 July 2023: Similar impulse move occurred—buying strength picked up, and then the price consolidated again.
4 Nov 2024: Most recent and strongest impulse—3 consecutive bullish candles that broke out of long-term descending resistance, confirming structural shift. This was again followed by consolidation—mirroring previous price behavior.
📈 Breakout Confirmation & Trend Structure
Breakout of Descending Trendline (Red): XRP broke out of its long-term bearish trendline decisively, confirming a trend reversal.
Support Zone Holding Firm (1.95 USDT): Price retraced slightly but respected the newly established support above 1.9500.
Consolidation Above Breakout: Post-breakout consolidation is forming a bullish continuation pattern.
Key Technical Levels
Entry Zone (Buy Area): Current zone between $2.10 and $2.50 (ideal accumulation zone for swing traders).
Technical Stop Loss: $1.9500 – key level that has acted as both resistance and now flipped to support.
Take Profit Targets
TP1: $3.4157 – previous resistance and a strong psychological level.
TP2: $6.000 – projected top of current trend channel (green line), aligns with 131.59% upside from current level.
Risk-Reward: Over 5:1 R:R on this setup, extremely favorable for mid-to-long-term swing trades.
Bearish Invalidations
If the price closes significantly below $1.95 on the weekly, the current bullish thesis weakens, and price may retest deeper supports around $1.25 or below. But as long as the structure holds, bulls are in control.
📊 Trade Setup Summary
📥 Entry 2.10 – 2.50
🛑 Stop Loss 1.9500
🎯 Take Profit 1 3.4157
🎯 Take Profit 2 6.0000
⚖️ R:R Ratio 5.32x
The chart tells a powerful story—repeated buying, breakout confirmation, support holds, and continuation setup. XRP is positioning itself for a major move, with $6.00 potentially on the table by the end of 2025.
This is an ideal zone for swing traders and position traders who are comfortable with multi-month holding periods and high R:R setups.

Momentum Rising – $XRP Bulls Eyeing Next Leg UpCRYPTOCAP:XRP is waking up 🔥
Price has broken out of the long-term downtrend and is now testing the important horizontal resistance area
A clean break above this range might spark the next big move. Volume is on the increase, and the structure is all good
Time to keep an eye on this one 👀
