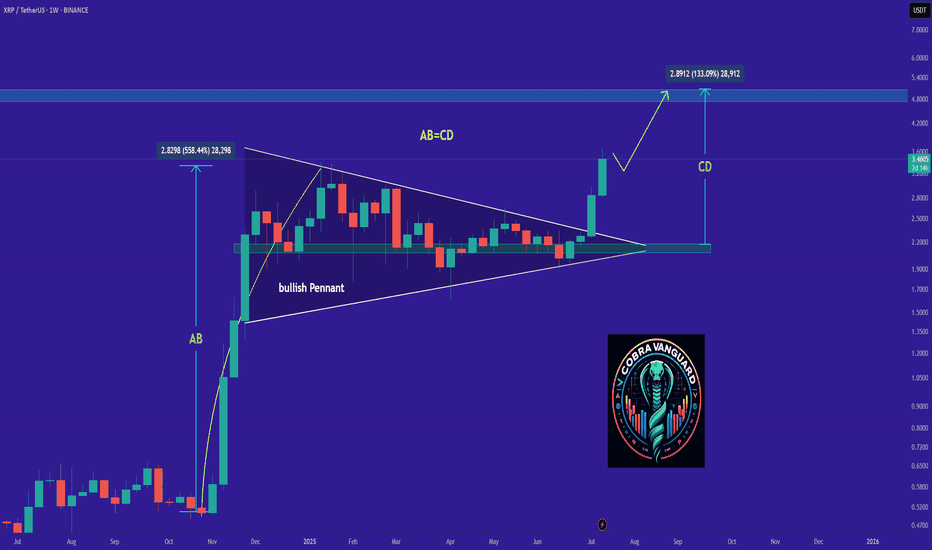
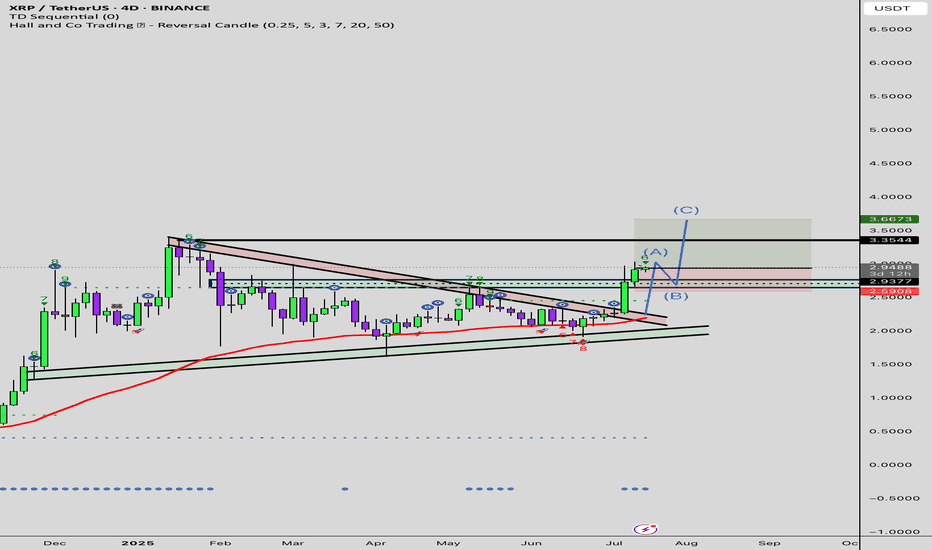
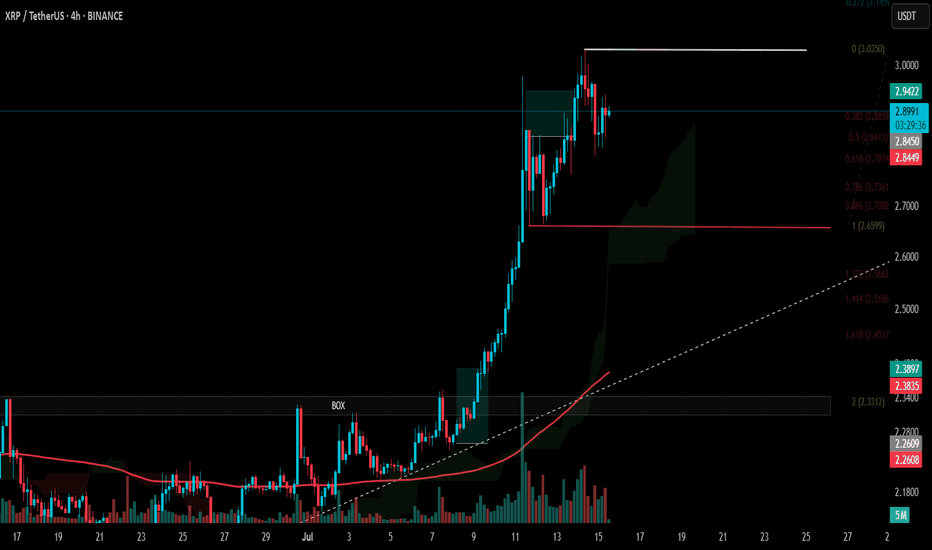
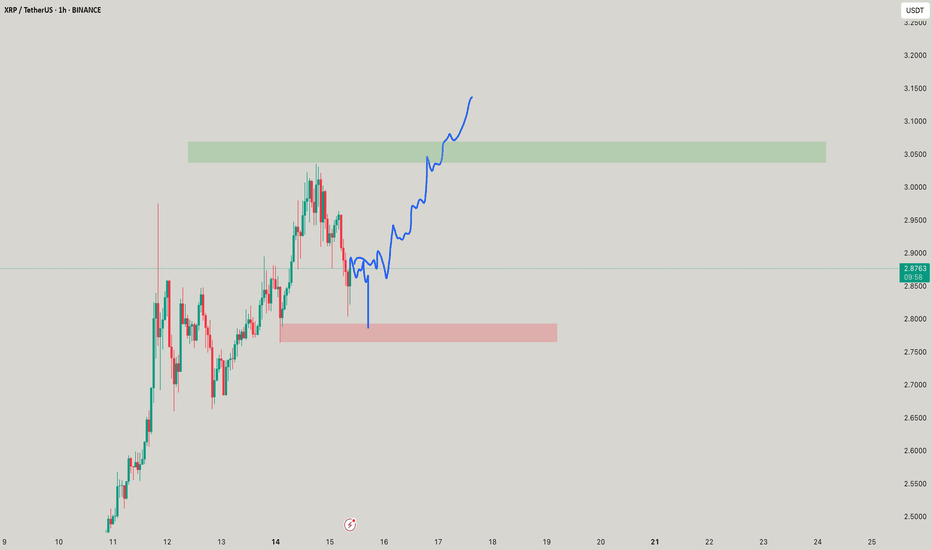
The last bullish chance of RIPPLE in Mid term!The price has formed a bullish flag on the 4-H time frame, and if it breaks out, it can drive the price up to around $2.9. I don't know why this coin reminds me of BNB!!!
Give me some energy !!
✨We spend hours finding potential opportunities and writing useful ideas, we would be happy if you support us.
Best regards CobraVanguard.💚
_ _ _ _ __ _ _ _ _ _ _ _ _ _ _ _ _ _ _ _ _ _ _ _ _ _ _ _ _ _ _ _
✅Thank you, and for more ideas, hit ❤️Like❤️ and 🌟Follow🌟!
⚠️Things can change...
The markets are always changing and even with all these signals, the market changes tend to be strong and fast!!
XRPUSDT
XRP What will happen in the future?The price has formed a bullish flag on the daily time frame, and if it breaks out, it can drive the price up to around $2.9. I don't know why this coin reminds me of BNB!!!
Give me some energy !!
✨We spend hours finding potential opportunities and writing useful ideas, we would be happy if you support us.
Best regards CobraVanguard.💚
_ _ _ _ __ _ _ _ _ _ _ _ _ _ _ _ _ _ _ _ _ _ _ _ _ _ _ _ _ _ _ _
✅Thank you, and for more ideas, hit ❤️Like❤️ and 🌟Follow🌟!
⚠️Things can change...
The markets are always changing and even with all these signals, the market changes tend to be strong and fast!!
Is #XRP Ready For a Massive Move or Not? Key Levels to WatchYello, Paradisers! Can XRP bulls muster enough strength to break free, or is the market preparing for another leg down? Let’s dive into the latest analysis of #XRPUSDT:
💎#XRPUSD is currently consolidating within a symmetrical triangle formation, signaling a period of indecision as both bulls and bears battle for control. The immediate focus is on the $2.386 resistance level, which aligns with the descending resistance of the triangle. A decisive breakout above this level would confirm bullish momentum, paving the way for a rally toward the $3.20-$3.40 supply zone. This area represents a significant hurdle, and clearing it could spark renewed bullish sentiment and attract stronger market participation.
💎On the other hand, if #XRP fails to break above $2.386, the price could pull back to retest the strong support levels at $1.965 and $1.712. These zones have been critical in maintaining the bullish structure, acting as a springboard for previous recoveries. A bounce from here would give bulls another opportunity to regroup and attempt to break resistance. However, if CRYPTOCAP:XRP breaks below the $1.712 support, it would signal a bearish invalidation, opening the door for further downside toward the $1.40 demand zone. Such a move would shift the momentum in favor of bears, increasing the probability of a deeper correction.
💎If the price manages to close a daily candle above $2.386, it would validate a bullish breakout and likely fuel the next leg up. Conversely, a daily close below $1.712 would confirm a bearish breakdown, with the potential for #XRPUSDT to retest lower levels.
Stay focused, patient, and disciplined, Paradisers🥂
MyCryptoParadise
iFeel the success🌴
XRP/USDT Analysis: Accumulation in Progress?XRP/USDT Analysis: Accumulation in Progress?
Current price: $2.45, pulling back from the recent high of $2.60.
Support and resistance:
Key support: $2.34 – holding strong during recent dips.
Resistance: $2.52 – acting as a ceiling for further upside.
Chart observations:
Formation of an equilibrium pattern, indicating potential accumulation at current levels.
Recent volatility is stabilizing, which could pave the way for the next directional move.
Trade setup:
Rated 7/10 for longs above $2.47.
Suggested stop-loss: Below $2.34 to manage risk.
Target levels: Initial resistance at $2.52, with potential for continuation higher if momentum builds.
Volume profile: Indicates steady buyer interest at current levels, hinting at a possible leg up for patient traders.
What’s your outlook on this setup? Share your ideas below! 🚀📈
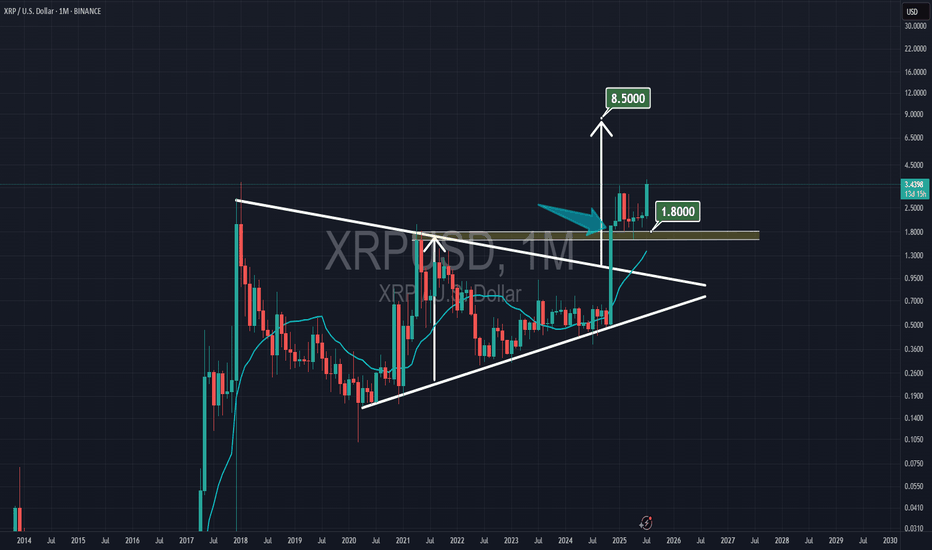
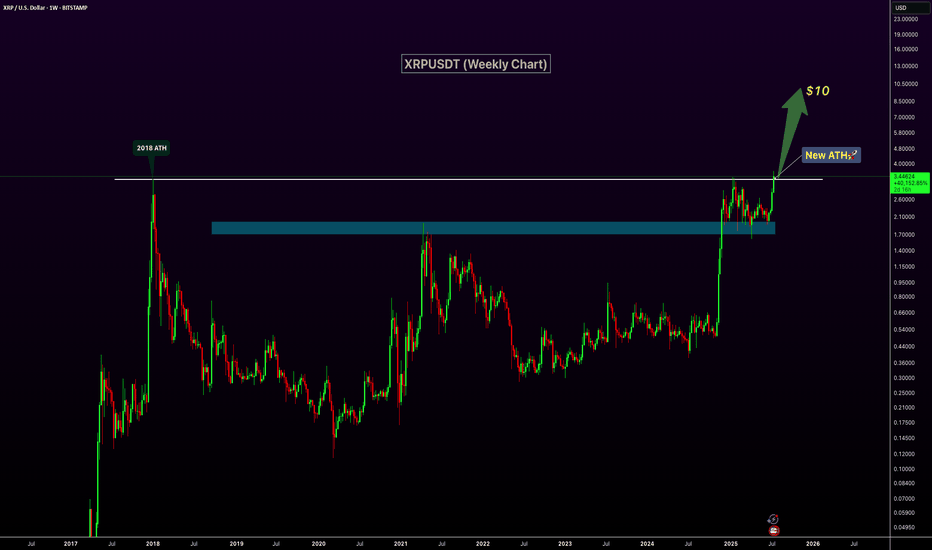
XRP’s Bullish Breakout: Is a $100+ Price Target Within Reach?The XRP/USD monthly chart offers a comprehensive view of its price action, highlighting significant patterns and potential for future gains. This analysis examines the cryptocurrency's historical performance, current trajectory, and the implications of its recent breakout.
The monthly timeframe provides a long-term perspective, with each candlestick representing a full month of trading activity. This timeframe is particularly useful for identifying overarching trends and minimizing the noise of short-term price fluctuations. Key levels on the chart include XRP's current price of $3.24, a potential accumulation zone around $0.70, and a long-term price target of $131.
Historically, XRP's price movements have been defined by two primary patterns. The first is a wedge pattern that occurred between 2014 and 2016. This pattern marked a phase of consolidation before the price broke out sharply, culminating in a peak around $3.17. This initial breakout laid the groundwork for the subsequent ascending triangle pattern that has developed since 2017.
The ascending triangle is a bullish continuation pattern that features a horizontal resistance line at approximately $3.17 and an ascending trendline connecting higher lows. This formation signals increasing buying pressure and accumulation over time. The recent price movement shows a breakout above the resistance level, suggesting that the pattern is playing out as expected. The projected price target, calculated based on the height of the triangle, points to a potential long-term valuation of $131.
The chart highlights two critical zones: the red box and the green box. The red box, located below the ascending triangle around $0.70, represents a potential accumulation zone and serves as a critical support level. Traders often use this area as a stop-loss point to minimize risk. Meanwhile, the green box above the breakout level indicates the potential price projection, with a target near $131.4. Reaching this zone would represent a dramatic upside from current levels.
While the recent breakout above $3.17 is an encouraging signal, further confirmation is required to ensure the move is sustained. A consistent upward trajectory beyond the resistance level will validate the bullish pattern and strengthen confidence in the price target. However, achieving this target will likely take a considerable amount of time, as the monthly timeframe suggests a long-term horizon, potentially spanning months or even years.
Market sentiment and fundamental factors remain crucial to XRP's future performance. Broader cryptocurrency market trends, adoption developments, and regulatory news can significantly influence its trajectory. Additionally, the volatile nature of cryptocurrency markets means short-term dips are always possible, even within a bullish trend.
In conclusion, the XRP/USD monthly chart reveals a promising ascending triangle breakout, signaling the potential for significant long-term gains. With a price target of $131 in sight, XRP could deliver substantial returns for long-term investors. However, careful risk management, patience, and a comprehensive approach that combines technical and fundamental analysis are essential for navigating this opportunity.
Disclaimer: This is not a financial advise. This analysis is purely for informational purposes and should not be considered as investment advice. Trading involves risk, and you should consult with a financial professional before making any decisions.
XRP Stabilizes at $3.24: Bulls Target $3.65 After Consolidation!XRP/USDT 4H Chart Analysis
Equilibrium established: XRP is stabilizing at $3.24 after a rally, showing signs of bullish momentum supported by consolidation around the FVG ($2.90).
Current price: $3.24.
Key levels:
Support:
FVG (Fair Value Gap): $2.90 (major order block).
Resistance:
Premium zone: $3.40 (key breakout target).
Momentum shift: RSI at 66 reflects bullish momentum, aligning with decreasing selling pressure and market maker accumulation.
Trade setup:
Entry: Current level ($3.24) or on a pullback near $3.20-$3.25.
Target:
T1: $3.45.
T2: $3.65.
Stop loss: Below $2.85 to minimize risk.
Risk-to-reward: Favorable setup, especially if the price holds above $3.20 support.
Confidence level: 8/10 for bullish continuation.
Considerations:
Support test: Ensure the price holds above $3.20 to validate bullish continuation.
Momentum confirmation: Monitor RSI and volume for sustained upward pressure.
Resistance reaction: Be cautious near $3.40; strong resistance could trigger a temporary pullback before continuation.
This setup suggests a potential upside to $3.45-$3.65, provided support levels hold. Tight risk management is essential in this consolidation phase.
#XRP. THE GROWTH STORY WILL CONTINUE! REVIEW FROM 17.01.2025BINANCE:XRPUSDT
#XRP 8h
Hey lovelies! 🌸
XRP is making waves, breaking into the top-100 global assets by market capitalization! 🚀 Today, XRP hit a new ATH at $3.4, surpassing companies like BlackRock, Siemens, and Booking in market value.
What’s Happening?
1. SEC Appeal
It was also reported today that the SEC has filed an appeal against the court’s decision in the Ripple case. The regulator submitted the appeal on the last possible day, avoiding an automatic closure of the case. Despite this, XRP is holding strong near the $3.1 level.
2. XRP Outshines Bitcoin
According to Google Trends, the search term "XRP" is now more popular than "Bitcoin"! This reflects the impressive growth and heightened activity surrounding XRP, which hit $3.4 today. However, increased interest in the token also suggests heightened risk, so trade cautiously.
My Expectations
I’m personally expecting a pullback to the $3.0 - $2.9 zone for:
- A retest of the horizontal resistance,
- Stop-loss hunting for long traders, and
- Trapping short traders.
After this, I anticipate a bounce toward $3.8 - $4.0.
However, if the $3.0 - $2.9 support fails, we could see a deeper correction to $2.4.
What to Watch For
Given the current positive narrative around Ripple, we might not see the desired correction, and XRP could rally directly to the target zone. Either way, I believe Ripple will eventually reach $4, but I don’t recommend entering at current levels.
If you’re looking to invest or add to your spot position, consider an entry near $3.0, and be prepared to average down near $2.4 if needed.
I’ll be patiently waiting for this setup to play out – no rush, just following the plan! 💖
As always, DYOR (Do Your Own Research) and trade wisely! 💖
Hugs,
Your crypto girl
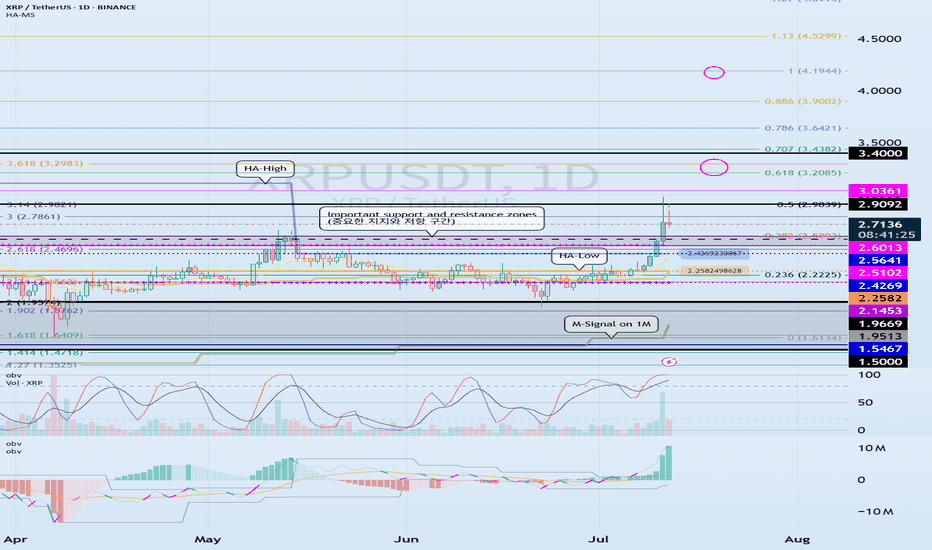
The point of interest is whether it can rise above 3.2983-3.3750
Hello, traders.
If you "Follow", you can always get new information quickly.
Please also click "Boost".
Have a nice day today.
-------------------------------------
(XRPUSDT 1D chart)
The 3.618 (3.2983) point of the Fibonacci ratio drawn in the big picture corresponds to the last point.
To complement this, I added the Pobonacci ratio drawn in the small picture.
Accordingly, the point to watch is whether the price can be maintained by rising above the left Fibonacci ratio 3.618 (3.2983) ~ right Fibonacci ratio 0.618 (3.3750) range.
If it receives support near the right Fibonacci ratio 0.618 (3.3750) and rises, it is expected to rise to around 1 (4.2278).
The current important support and resistance range is the 25102-2.6013 range.
-
Thank you for reading to the end.
I hope you have a successful trade.
--------------------------------------------------
- Big picture
I used TradingView's INDEX chart to check the entire range of BTC.
(BTCUSD 12M chart)
Looking at the big picture, it seems to have been maintaining an upward trend following a pattern since 2015.
That is, it is a pattern that maintains a 3-year uptrend and faces a 1-year downtrend.
Accordingly, the uptrend is expected to continue until 2025.
-
(LOG chart)
As you can see from the LOG chart, the uptrend is decreasing.
Accordingly, the 46K-48K range is expected to be a very important support and resistance range from a long-term perspective.
Therefore, we expect that we will not see prices below 44K-48K in the future.
-
The Fibonacci ratio on the left is the Fibonacci ratio of the uptrend that started in 2015.
In other words, it is the Fibonacci ratio of the first wave of the uptrend.
The Fibonacci ratio on the right is the Fibonacci ratio of the uptrend that started in 2019.
Therefore, this Fibonacci ratio is expected to be used until 2026.
-
No matter what anyone says, the chart has already been created and is already moving.
It is up to you to decide how to view and respond to this.
When the ATH is updated, there are no support and resistance points, so the Fibonacci ratio can be used appropriately.
However, although the Fibonacci ratio is useful for chart analysis, it is ambiguous when used as support and resistance.
This is because the user must directly select the important selection points required to create Fibonacci.
Therefore, since it is expressed differently depending on how the user specifies the selection points, it can be useful for chart analysis, but it can be seen as ambiguous when used for trading strategies.
1st : 44234.54
2nd : 61383.23
3rd : 89126.41
101875.70-106275.10 (Overshooting)
4th : 134018.28
151166.97-157451.83 (Overshooting)
5th : 178910.15
-----------------
XRP EXPLOSION XRPUSD SeekingPips Magic! Perfect Time & Price !!!
Did you take your fill?
If not why not?
🟢SeekingPips will give you the heads up but you have to chuck your own net in with you own risk management.
👍SeekingPips is not a signal service BUT when the PICKING IS RIGHT I always like to share 😉
🌍SUBSCRIPTION NOW TO SeekingPips FOR THE NEXT SUPER CHART🌎
XRPUSDT Elliott Waves Analysis (Investment Idea)Hello friends.
Please support my work by clicking the LIKE button👍(If you liked). Also i will appreciate for ur activity. Thank you!
Everything on the chart.
Main(investment) target zone: 5 - 7.5$
Cancellation of setup - consolidation under ~0.3
RR: 1 to ~30
risk is justified
Good luck everyone!
Follow me on TRADINGView, if you don't want to miss my next analysis or signals.
It's not financial advice.
Dont Forget, always make your own research before to trade my ideas!
Open to any questions and suggestions
XRP's Biggest Rally Since 2018 as Futures OI Reaches All-Time HiXRP, the digital asset associated with Ripple Labs, has experienced a remarkable surge in price, reaching levels not seen since January 2018.1 This impressive rally is accompanied by a surge in trading volumes and a record high in perpetual futures open interest, signaling strong bullish sentiment among investors.2 This resurgence comes even as the U.S. Securities and Exchange Commission (SEC) continues its legal battle with Ripple, filing an appeal in their ongoing case.3 This article delves into the factors driving XRP's bullish momentum, the significance of the record futures open interest, and the potential implications for the cryptocurrency's future.
XRP's Price Surge and Market Performance
XRP's recent price action has been nothing short of spectacular. The cryptocurrency has broken through key resistance levels, achieving a seven-year high and demonstrating its strongest performance since the 2018 bull run.4 This surge has propelled XRP's market capitalization to impressive levels, even surpassing that of some traditional financial institutions.5
Several factors contribute to this impressive price appreciation. Positive developments in Ripple's legal battle with the SEC have instilled confidence in investors.6 The anticipation of clearer crypto regulations in the U.S. and the overall positive sentiment in the cryptocurrency market have also played a role.
Record Futures Open Interest: A Sign of Strong Bullish Sentiment
One of the most compelling indicators of XRP's bullish momentum is the record high in perpetual futures open interest.7 Open interest refers to the total number of outstanding derivative contracts, such as futures and options, that have not been settled.89 A rising open interest suggests that new money is flowing into the market and that traders are taking on new positions.10
In the case of XRP, the record open interest in perpetual futures indicates a strong belief among traders that the cryptocurrency's price will continue to rise.11 This metric is particularly significant because perpetual futures contracts do not have an expiration date, allowing traders to hold their positions indefinitely.12 The willingness of traders to maintain long positions in XRP perpetual futures underscores their conviction in the cryptocurrency's long-term prospects.
On-Chain Data and Trading Volumes
In addition to futures open interest, on-chain data provides further evidence of XRP's robust market activity.13 On-chain metrics, such as transaction volume, active addresses, and network growth, offer insights into the underlying health of a blockchain network.14 Positive on-chain data for XRP suggests increasing adoption and usage of the cryptocurrency.
The surge in trading volumes across various cryptocurrency exchanges further supports the narrative of strong bullish momentum. High trading volumes indicate increased liquidity and investor participation, which can contribute to price stability and further upward movement.15
XRP's Resilience Amidst SEC Appeal
XRP's impressive rally is particularly noteworthy considering the SEC's ongoing legal battle with Ripple Labs.16 The SEC's decision to appeal a court ruling in the case has introduced uncertainty into the market. However, XRP's price action suggests that investors are largely unfazed by this development.
This resilience can be attributed to several factors. The initial court ruling was seen as a partial victory for Ripple, clarifying the legal status of XRP in certain transactions.17 This clarity has provided a degree of reassurance to investors. Additionally, the cryptocurrency market has matured significantly since the SEC's initial lawsuit, with increasing regulatory clarity and adoption in various jurisdictions.18
Potential Challenges and Future Outlook
Despite the strong bullish momentum, XRP still faces potential challenges. The ongoing SEC case remains a source of uncertainty, and an unfavorable outcome could negatively impact the cryptocurrency's price.19 Regulatory developments in other jurisdictions could also introduce volatility.
However, the overall outlook for XRP appears positive. The cryptocurrency's strong fundamentals, increasing adoption, and growing institutional interest suggest that it has the potential for further growth.20 The record futures open interest and positive on-chain data indicate strong market confidence.
Conclusion
XRP's recent price surge, accompanied by record futures open interest and robust on-chain data, signals its strongest bullish momentum since January 2018.21 The cryptocurrency has demonstrated resilience in the face of ongoing legal challenges, and its market performance suggests growing investor confidence.22 While potential challenges remain, XRP's future outlook appears promising, with the potential for further growth and adoption in the evolving cryptocurrency landscape.
XRP: Is the $3.00 Breakout the Start of a New Rally!?XRP Token ( BINANCE:XRPUSDT ) , backed by Ripple , a pioneer in international financial transfers, this token has once again captured the market's attention. Is this growth sustainable or just a temporary surge?
Let's take a closer look.
Fundamental Analysis :
1- Legal Advancements(Recent Court Victories) : Ripple has achieved successes in its legal battles against the U.S. Securities and Exchange Commission (SEC), reducing legal uncertainties surrounding XRP and boosting investor confidence.
2- Strategic Partnerships(Collaborations with Major Financial Institutions) : Ripple has initiated partnerships with banks and financial institutions worldwide, especially in Europe and Asia, aiding in the broader adoption of XRP.
3- Increased Utility(Speed and Efficiency in Transactions) : Given its high speed and low transaction fees, XRP is being considered a suitable option for international transfers.
4- Institutional Investment(Approval of Exchange-Traded Funds (ETFs)) : The approval of ETFs related to XRP could lead to increased demand and, consequently, a rise in its price.
5- Leadership Changes(Changes in SEC Leadership) : With Gary Gensler stepping down as SEC Chair and the potential appointment of more crypto-friendly leaders, regulatory pressures on XRP are expected to decrease, potentially aiding its growth.
-----------------------------------------------------------
Now, let's take a look at the Technical Analysis of XRP .
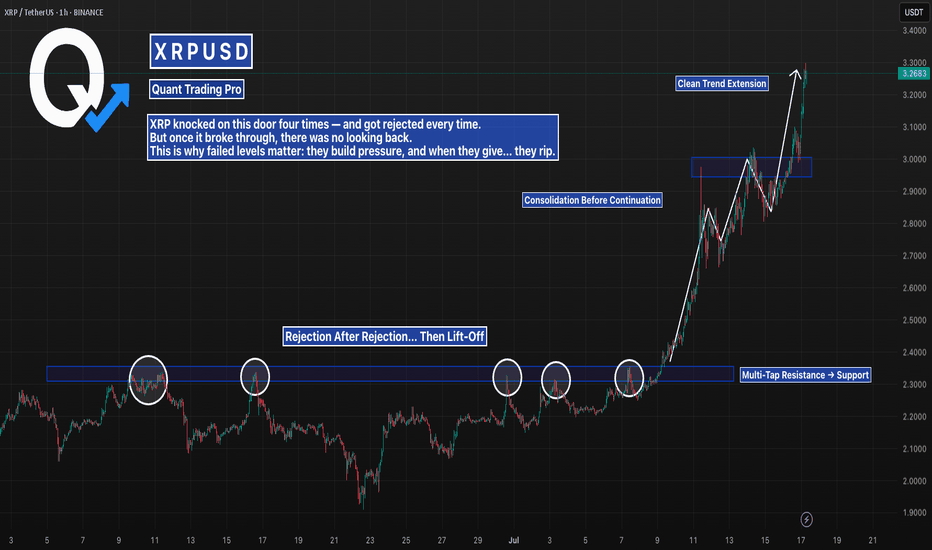
XRP is trying to break the Resistance zone($2.92-$2.68) . However, the $3.00 Resistance level(Round Number) is preventing XRP from continuing to rise.
Of course, with the large volume of the candle breaking the Resistance zone , we can hope for an increase in XRP .
Regarding Classic technical analysis , the Rising Wedge Pattern has failed and will act as a continuation Pattern when a reversal pattern fails. ==>> Educational Tip
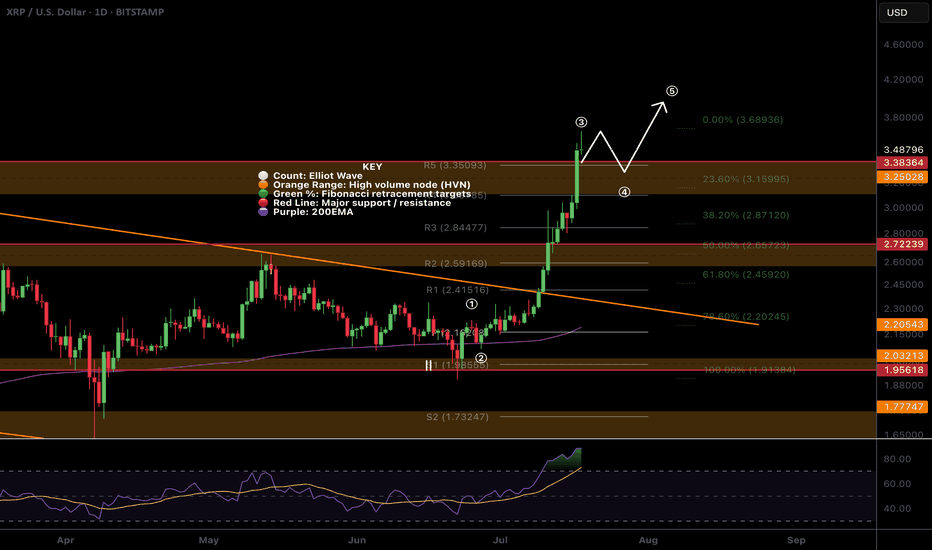
According to the theory of Elliot waves , it seems that XRP has succeeded in completing the main wave 3 and we should wait for the main wave 4 . It looks like the main wave 4 can end around $2.85 or $2.74 ( near the upper line of the failed wedge pattern ).
Looking at the chart of XRPBTC ( BINANCE:XRPBTC ) in the weekly time frame , we can see that it seems that XRPBTC has succeeded in breaking the Resistance lines and is currently trying to break the Resistance zone , and if this zone breaks , we can see a further increase in XRP compared to Bitcoin(if the crypto market is bullish ) and vice versa if the crypto market is bearish , we can hope that XRP will experience a smaller decline than Bitcoin.
Based on the explanation above, I expect XRP to rise to at least a Potential Reversal Zone(PRZ) after the pullback is completed .
Note: If XRP returns below the Resistance zone($2.92-$2.68) again, we can expect a further decline of XRP.
XRP Analyze (XRPUSDT), 4-hour time frame⏰.
🔔Be sure to follow the updated ideas.🔔
Do not forget to put Stop loss for your positions (For every position you want to open).
Please follow your strategy and updates; this is just my Idea, and I will gladly see your ideas in this post.
Please do not forget the ✅' like '✅ button 🙏😊 & Share it with your friends; thanks, and Trade safe.
XRP/USDT BREAKS OUT: 50% Surge Incoming?🚀 Hey Traders! 👋
If this setup excites you, hit that 👍 and smash Follow for trade ideas that deliver real results! 💹🔥
XRP: Ready for Takeoff! 🚀
XRP has shattered its symmetrical triangle on the 4-hour chart and is now retesting the breakout level. If this level holds, we're looking at a potential 50% surge to the upside! 📈 This could be your golden entry—don’t miss out.
Trade Setup:
Entry Zone: Current Market Price (CMP); add up to $2.30
Profit Targets: $2.62 / $2.86 / $3.12 / $3.38 / $3.66
Stop Loss: $2.16 (Stay safe!)
Leverage: Keep it conservative (Max 5x)
💬 What’s Your Take?
Do you see XRP’s explosive potential here? Let us know your analysis, strategies, or predictions in the comments below. Let’s conquer this market together and bag those profits! 💰🌊
XRP Price UpdateThe current situation for XRP is quite significant, as it finds itself at a crucial point in its price movement. The cryptocurrency is facing a resistance level and a trend line that have been pivotal in determining its recent performance. A breakout above these barriers would signal a strong bullish trend, indicating that buyers are gaining momentum. This is particularly important as increased trading volume during such a breakout can reinforce the strength of the move, suggesting that the upward trend could be sustained.
If XRP successfully breaks through the resistance and trend line, it opens the door to higher price levels. Traders and investors often look for these breakouts as indicators of potential future gains.
Ripple vs. SEC: The Battle Continues as XRP Faces New AppealThe legal tussle between Ripple Labs and the U.S. Securities and Exchange Commission (SEC) has taken another dramatic turn. On January 15, the SEC filed an appeal against the July 2023 ruling by Judge Analisa Torres, which declared that XRP tokens sold to retail investors are not securities. This appeal marks the latest chapter in a legal battle that has been ongoing since December 2020.
SEC’s Arguments
The SEC’s appeal asserts that the New York District Court erred in its judgment by distinguishing CRYPTOCAP:XRP sales to retail investors from those to institutions. The regulator contends that all CRYPTOCAP:XRP sales should be classified as unregistered securities offerings under the Howey test. This test defines an investment contract as one involving an investment of money in a common enterprise with the expectation of profits derived from the efforts of others.
The SEC’s filing argues that Ripple’s promotional efforts and its distribution of XRP as employee compensation or in business deals were sufficient to establish the token as a security. Furthermore, the regulator claims that retail investors would have expected profits based on Ripple’s activities, reinforcing their stance that XRP sales to retail investors were improperly excluded from the initial ruling.
Ripple’s Response
Ripple’s leadership has dismissed the SEC’s appeal as a repetition of failed arguments. Ripple CEO Brad Garlinghouse criticized the agency for “doing the same thing over and over and expecting different results.” Chief Legal Officer Stuart Alderoty labeled the appeal as “lackluster” and suggested it may be abandoned under the next administration.
Pro-crypto lawyer Jeremy Hogan also weighed in, highlighting the SEC’s lack of substantial evidence to prove that retail investors were aware of Ripple’s “promises” regarding XRP. Ripple has cross-appealed the aspects of the case it lost, including a $125 million civil penalty ordered by Judge Torres.
Outlook
The outcome of this appeal could have significant implications for the cryptocurrency industry. If the appeals court overturns the initial ruling, it may set a precedent for other cryptocurrencies to be classified as securities, tightening regulatory scrutiny across the sector. Conversely, a favorable ruling for Ripple could strengthen the case for digital assets being treated differently based on their use cases and distribution methods.
Technical Analysis
As of this writing, CRYPTOCAP:XRP is trading at $3.18, up 1.39% over the past 24 hours. The token is currently in a bullish pattern, with the Relative Strength Index (RSI) at 73. This suggests that while XRP is not yet overbought, traders should exercise caution as a correction could be imminent.
Immediate support lies at the 38.2% Fibonacci retracement level, which corresponds to $2.70. This level could serve as a potential buy zone for traders and investors looking to capitalize on the next upward move. The long-term target for XRP remains optimistic, with projections ranging from $5 to $10, especially as Ripple expands its stablecoin offerings across multiple networks.
Conclusion
The SEC’s appeal adds another layer of uncertainty to Ripple’s legal battle, but the fundamentals of XRP remain strong. With its expanding utility and growing adoption, XRP’s potential to reach new highs remains intact. However, traders and investors should monitor both the legal proceedings and technical indicators closely to navigate this volatile period effectively.
As the appeals court process unfolds, Ripple’s counterarguments and the court’s eventual decision will be pivotal in shaping the future of XRP and the broader cryptocurrency market.