XRP didn’t break down. It just returned to origin.There was no crash. Just a clean delivery.
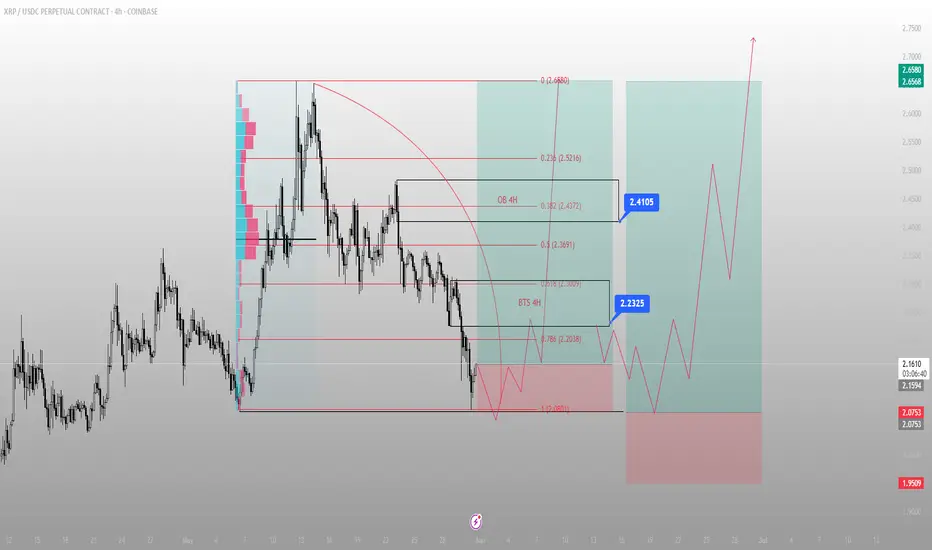
BINANCE:XRPUSDC swept the prior low and tapped directly into the 1.0 extension of the move — right at 2.0901 — closing below liquidity, only to reclaim it on the next candle. That’s not weakness. That’s Smart Money reloading.
Below that low sits the 4H BTS zone, overlapping the 0.618 and 0.786 retracements (2.2038–2.2325). That zone was engineered. Built. Not random. Price has already started responding.
The first draw is clear: 2.2325 — back into the inefficiency left behind on the breakdown. From there, we face a clean decision point at 2.4105. That’s where OB meets .382 retracement — and it’s a known trap zone for liquidity.
If price rips through it, 2.5216 becomes the magnet. If it rejects, I’ll be watching for a final mitigation before the full macro expansion.
Execution clarity:
✅ Entry: Inside BTS 4H zone (2.0901–2.2038)
🎯 Target 1: 2.2325
🎯 Target 2: 2.4105 (4H OB + liquidity pool)
🛑 Invalidation: Close below 1.9509
XRPUSDT
XRPUSDT: Bearish Move Likely Before the Next RallyXRPUSDT is currently exhibiting a bearish structure, with the price recently falling to around $2.28 and showing a decline of about 1.25% over the last week. Technical analysis across multiple timeframes reveals that bearish momentum is prevailing, but the setup is forming for a potential bullish reversal after further downside.
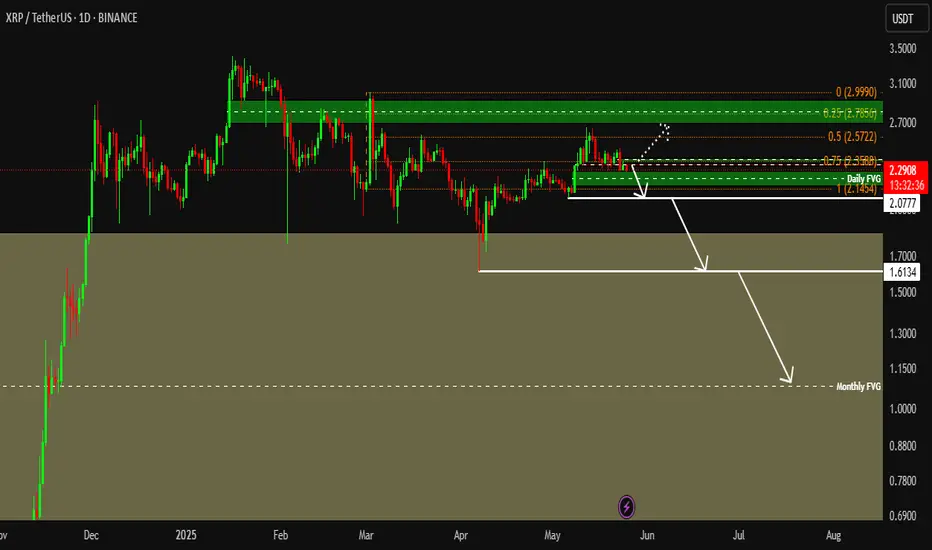
XRP's Correction Might Not Be OverIt looks like XRPUSDT can recover any minute now but the correction might not be over.
Good morning my fellow Cryptocurrency trader, what an unpredictable market we have today.
The action has been bearish since 12-May and bearish momentum continues to grow. It seems the bearish action is stopping now but XRP has not reached support. While a recovery can happen any day, the signals are bearish and we have three consecutive days the action being red, plus more than two weeks seeing lower prices.
We are bullish long-term but short-term anything can happen.
Bearish volume is very, very low which means that the down-move has no strength. How much lower can it go? Always a higher low because XRP will continue to grow long-term.
The correction might not be over.
Namaste.

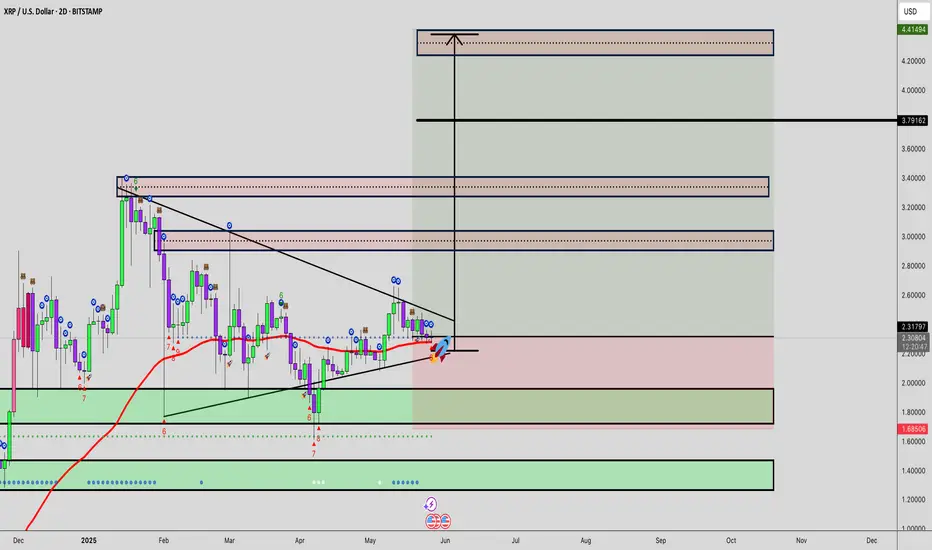
XRPUSD at weekly support, ready to aim for 3$XRPUSDT is currently sandwiched between weekly support WS1 and weekly resistance WR1.
The price is currently trading inside weekly support WS1.
This is the place from where it should find support and gather necessary momentum for a bounce.
The bounce from WS1 shall lead the price to the daily resistance around 2.57 marked with horzontal blue line on the chart.
There the price is likely to face some pullback towards 2..36 only to come back again with force to go beyond this daily resistance zone.
This next move upward after the pullback from daily resistance around 2.57, shall lead the price to weekly resistance WR1 around 3$.

XRP 5X Lev. Full PREMIUM Trade-Numbers (PP: 1380%)Good afternoon my fellow Cryptocurrency trader, this is a great weekend and a wonderful day.
The bullish bias for XRP has been confirmed more than enough. It is time. The time is right and the time is ripe to go LONG.
I am publishing to give you full trade-numbers for you to enjoy.
This is a high probability chart setup.
I am wishing you success and great profits. Crypto is going up.
We are doing mid-leverage on this pair. We are going with 5X because the action is already moving. Earlier, we would go higher, but we like to keep risk moderate.
Full trade-numbers below:
_____
LONG XRPUSDT
Leverage: 5X
Current price: $2.15
Entry levels:
1) $2.18
2) $2.12
3) $2.05
4) $1.98
Targets:
1) $2.50
2) $3.02
3) $4.51
4) $6.29
5) $8.08
Stop-loss:
Close weekly below $1.95
Potential profits: 1380%
Capital allocation: 5%
_____
I am wishing you great profits and tons of success.
This is for advanced traders.
You decide how to secure profits, how to adapt to market conditions and how to trade.
You also decide your own level of risk. If you win, all the profits are yours.
If you lose, that's ok, the market offers endless opportunities and life goes on.
It is not about winning them all. It is about winning and growing.
Thanks a lot for your continued support.
Namaste.

XRP 5X Lev. Full PREMIUM Trade-Numbers —New Entry (PP: 815%)When the market is over-leveraged, when there are too many people out of control, you can feel a kind of tension; anxiety in the air... Sure enough, the market starts to shake and all these over-leveraged hands are removed. Once removed, the market becomes calm... Can you feel the calm? It is as if the gamblers are now gone.
Good morning my fellow Cryptocurrency trader, we have many charts, my leveraged trades, all green. We have second entries for BTC, ETH and ADA but none for XRP.
So, if you missed the first one, here is another one... It is risky, but the show must go on.
We are set to experience a very strong wave of growth. Getting in before the breakout can be live changing, just keep in mind that nothing is certain, leveraged trading is high risk. High risk vs a high potential for reward.
The signals here are not strong, but I believe we have very good timing, and if the timing is good, the price must also be.
_____
LONG XRPUSDT
Leverage: 5X
Entry levels:
1) $2.45
2) $2.35
3) $2.30
4) $2.26
5) $2.07
Targets:
1) $3.05
2) $3.40
3) $3.82
4) $4.08
5) $4.50
6) $5.18
7) $5.67
8) $6.29
Stop-loss:
Close weekly below $2.05
Potential profits: 815%
Capital allocation: 3%
_____
When the market calms down, it means that no more gamblers are around. When no more gamblers are around, the growth process can continue.
This is an unconventional signal, but you can't deny the change. One day, everybody is going wild, the next day, only the usual suspects remain.
When the market grows and moves to resistance, everybody wants to go LONG. When prices are low, people tend to detach and ignore. It is the other way around, sell at resistance and buy at support.
Time to go LONG.
Namaste.

XRP Ready for PUMP or what ?Ripple has successfully broken out of the falling wedge pattern and retested the breakout zone,the price is holding firmly above previous resistance, which now acts as strong support.
Continued strength could lead to upward movement toward targets at $2.65, $2.95, and $3.35
Stay Awesome , CobraVanguard

XRP/USD LONG SET UPTitle: XRP/USD (RIPPLE) BUY
Asset: Crypto
Symbol: XRP/USD
Market Entry Price 1: $2.28
Limit Entry Price 2: $2.08
Stop Loss: $1.88
Take Profit 1: $2.48 (close 10%)
Take Profit 2: $2.78 (close 25%)
Take Profit 3: $3.38 (close 50%)
Take profit 4: $3.88 (close 75%)
Take profit 5: $4.38 (close 100%)
Status: ACTIVE
Ripple buy signalHello friends
Given the good growth we had, we entered a deep correction, and now we have the opportunity to buy step by step in the specified support areas with capital and risk management and move with it to the specified targets.
*Trade safely with us*

XRP $4.5 Followed by $6.29 Target ConfirmedThere is a small support zone around $2.30 that has been tested and retested since 17-May, it holds and it is now confirmed. You can truly hit the gas now, go all-in on XRP. I say this because the next advance (higher high) is about to get started in the coming hours and days. The full advance of course can take weeks or months to develop but the low entry prices and the buy-zone can be available only for a few more hours, maximum a day or two, before it is gone. I don't believe it will last days but we are still here today.
If the bears had the strength to move the market lower they had 10 days to do so, they failed. A bearish failure is a bullish success.
This is just a friendly reminder because I know you love XRP and I am happy to give you post/charts with great entry price and timing. A high probability of success.
There is no doubt in mind, 100% certain. XRPUSDT is set to grow next.
Thank you for reading.
If you agree follow & boost.
If you agree strongly leave a comment, just a few seconds of your time and it makes a difference. Share, how long have you been holding for? Did you manage to join the previous wave in late 2024? What about the buy zone in early April?
It is never too late, the market always gives a second chance.
This is the third one. The time is right and the time is ripe.
Prepare for financial success. Profits.
Namaste.

XRPUSDT 4H | Untested Demand Zone RevisitIn this 4-hour chart analysis of XRPUSDT, I’m focusing on a clear and well-defined untested demand zone between 2.05–2.13 USDT . Unlike the first demand zone (already tested and played out), this second zone has not been retested since its formation, making it a fresh area of interest for a potential long setup.
Why this matters :
Untested demand zones often act as powerful magnets for price when revisited, as they represent areas where large buy orders might be waiting to be filled. Because this zone has not been revisited yet, there’s a higher probability for a bullish reaction when price returns to it.
Key Technical Factors :
✅ The 2.05–2.13 demand zone was formed following a significant bullish impulse that created a clear break of structure to the upside.
✅ Price is currently consolidating above this demand zone and also above a potential bearish CHoCH at 2.0784 . This suggests that the bullish structure is still valid unless price breaks below 2.0784.
✅ My bullish target is 2.65 USDT , where previous highs were formed and potential liquidity exists.
✅ My stop loss is set just below the demand zone, around 2.05 , to protect against a deeper retracement or a shift in market structure.
My Thought Process :
I expect that if price returns to the demand zone, there will be a strong chance for buyers to step in and push the market higher. However, I’m aware that if price breaks below 2.0784 , it would signal a bearish CHoCH and invalidate the long scenario. Therefore, patience is key — I’ll wait for price to either test the zone and react strongly or stay above 2.0784 to keep the bullish bias intact.
Clear Trade Setup :
📌 Entry Zone : 2.05–2.13
🛑 Stop Loss : Below 2.05
🎯 Take Profit : 2.65
🧩 Invalidation : Break below 2.0784
💬 Let me know if you have a similar zone marked out or if you see a different setup! Let’s share ideas and refine our strategies together.

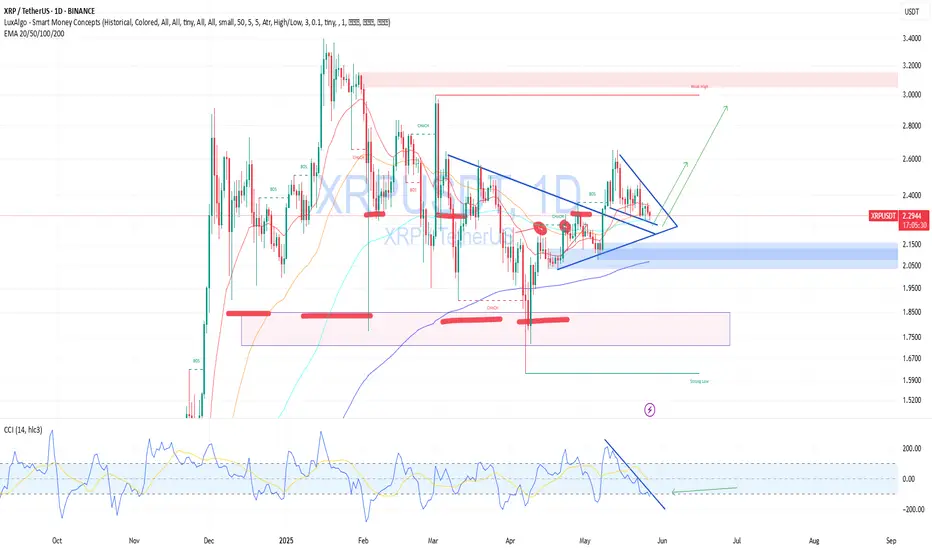
XRPUSDT — Buy From Support, Waiting for Triangle BreakoutOn the 4H chart, XRP is consolidating inside a symmetrical triangle and holding above an ascending trendline — a key support zone that has held multiple times.
🧠 Fundamentally:
Ripple continues expanding partnerships with fintech and banks.
The SEC lawsuit has lost its grip on price action.
A potential Fed rate cut could push crypto sentiment up again.
📌 I’m entering positions near $2.31, gradually accumulating. A breakout above the triangle could trigger a strong move.
🎯 Targets:
$2.50 — initial resistance
$2.65+ — if breakout is confirmed with strong momentum
🔽 If price breaks below $2.20, I’m looking to buy confidently near $1.80, where major demand sits. I don't expect such a dip, but markets can surprise.
Xrp- a small case for upsideRipple is a coin that is loved fervently by retail and despised vehemently by crypto natives. People who spend the bear market in the trenches tend to avoid it due to skepticism about FDV and other metrics and then retail comes in for a blip in time and pumps it to Valhalla and dumps on crypto natives and leaves without explaining.
If bitcoin hits 250k , retail is coming back and pumping this to $9.
Downside : price is currently trending near previous ATH of 2018 so there's a risk of double top and crash to 50¢
Upside : dark days are behind us. Why zoom out more than necessary. Worst is behind us. We're in an uptrend.
minor downside : oh no, we zoomed in too hard and the chart seems to be in a downtrend. well it doesn't matter unless you're high leveraged . Zoom out moderately, relax for a bit, and wait for retail to arrive.

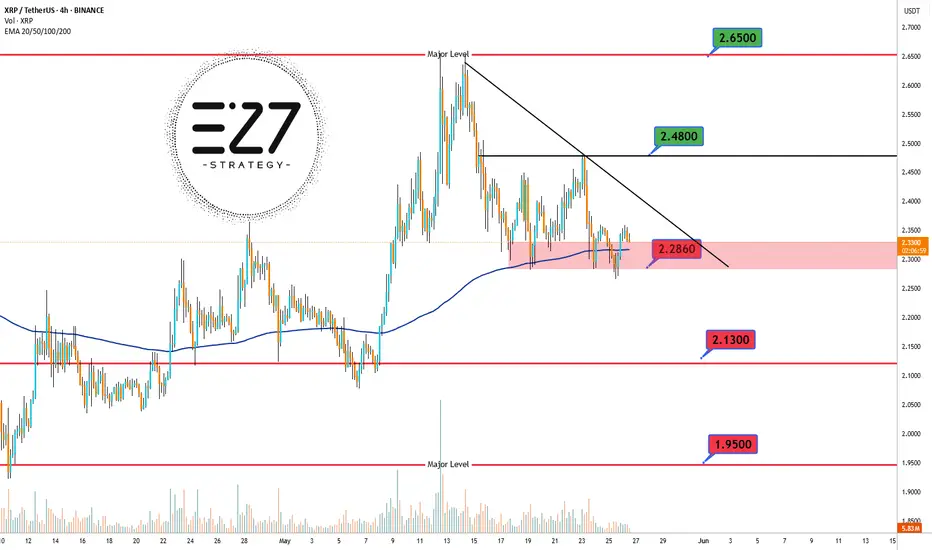
XRPUSDT The 4-hour chart of BINANCE:XRPUSDT shows that the overall trend remains bullish, but the price is currently in a corrective downward phase. 📉 At the moment, XRP is trading in a highly critical zone, right at the 2.2860 USDT support level, which aligns with the 200 EMA — often considered a dynamic support area. 🛡️ Despite this confluence, the price still sits below the descending trendline, indicating continued bearish pressure. ⚠️ If the price manages to hold this key zone and break above the trendline, a move toward the next resistance at 2.4800 USDT and potentially 2.6500 USDT could follow. 🚀 However, losing the 2.2860 support could trigger a deeper drop toward 2.1300 USDT and even 1.9500 USDT. ❗ This current level, where static support intersects with the 200 EMA, is a make-or-break zone that will likely define the short-term direction of XRP.
Support & Resistance Levels:
🔼 Major Resistance: 2.6500 USDT
🔼 Secondary Resistance: 2.4800 USDT
⚡ Dynamic Resistance (trendline): ~2.3500 USDT
🔽 Key Support (current price level): 2.2860 USDT
🔽 Secondary Support: 2.1300 USDT
🔽 Major Support: 1.9500 USDT
XRUSD Price Market Trend Day TF Long Term BUYXRPUSD is trading at 2.33674, with a strong recommendation to buy for long-term gains. The chart indicates a potential upward trajectory, with price targets set at:
TP1: 2.44200 (Near-term resistance)
TP2: 3.00500 (Mid-term target)
TP3: 3.40000 (Long-term bullish goal)
The mention of 3.40000 at the top of the chart suggests this is a psychological resistance level, reinforcing the optimistic outlook if bullish momentum sustains.

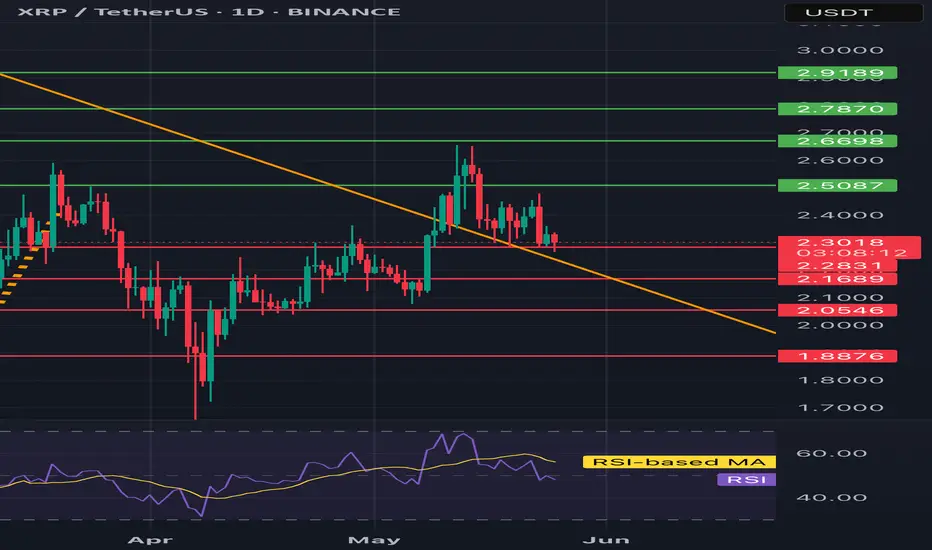
XRP/USDT 1D chart reviewHello everyone, let's look at the 1D XRP chart to USD, in this situation we can see how the price lasts above the downward trend line.
Going further, let's check the places of potential target for the price:
T1 = $ 2.51
T2 = $ 2.67
Т3 = 2.79 $ t4 = $ 2.92
Let's go to Stop-Loss now in case of further declines on the market:
SL1 = $ 2.31
SL2 = $ 2.17
SL3 = $ 2.06
SL4 = $ 1.89
Looking at the RSI indicator, you can see how he reacted and returned to the middle of the range, which creates a place for a panty growth.
#XRP/USDT#XRP
The price is moving within a descending channel on the 1-hour frame, adhering well to it, and is heading for a strong breakout and retest.
We are seeing a bounce from the lower boundary of the descending channel, which is support at 2.29.
We are seeing a downtrend on the RSI indicator that is about to break and retest, supporting the upward trend.
We are looking for stability above the 100 Moving Average.
Entry price: 2.30
First target: 2.33
Second target: 2.37
Third target: 2.42

#XRP/USDT#XRP
The price is moving in a descending channel on the 1-hour frame and is expected to continue upward.
We have a trend to stabilize above the 100 moving average once again.
We have a downtrend on the RSI indicator, which supports the upward move with a breakout.
We have a support area at the lower boundary of the channel at 2.25.
Entry price: 2.34
First target: 2.42
Second target: 2.47
Third target: 2.56

Skeptic | XRP Analysis: Can It Hit $6 After Bitcoin’s $111k?Hey everyone, Skeptic here! Bitcoin just smashed through the $107K resistance, shaking up the whole crypto scene! Is XRP ready to rocket to $6 ? Curious about spot and futures triggers? Stick with me to the end of this analysis for the full breakdown. 😊 Let’s dive in with the Daily Timeframe. 📊
Daily Timeframe: The Big Picture
After an epic 500% rally , XRP has entered a consolidation phase, which we can spot from the decreasing volume. It’s too early to call this a distribution or re-accumulation, but I’m leaning toward re-accumulation for a few reasons:
Bitcoin’s Uptrend: The ongoing bullish trend in Bitcoin is fueling crypto market liquidity.
Positive XRP News:
Ripple and the U.S. SEC reached a settlement in early May 2025, ending a long legal battle over XRP’s status as a security. Ripple paid a $50 million fine, with $75 million of a $125 million escrow returned. This cleared major regulatory uncertainty, boosting investor confidence and paving the way for broader U.S. adoption.
XRP Spot ETF Speculation: BlackRock reportedly discussed an XRP ETF application with the SEC, and firms like Franklin Templeton and Bitwise have filed for XRP ETFs. With the SEC’s new crypto-friendly leadership, the odds of ETF approval are 80-85% by the end of 2025, potentially unlocking massive institutional capital.
Spot Trigger:
The main trigger is a break and consolidation above 3.3684 , which aligns with breaking the daily consolidation box.
This could kick off a new momentum wave. Expect a sharp breakout, so don’t miss it!
If you’re aiming for a long-term buy, I’ll share lower timeframe triggers to front-run this breakout.
First Target :
After breaking the box’s ceiling, aim for 6.64 . I cloned the box and placed it above, as this often works for target setting. 🙂
Tip: Pay close attention to Bitcoin and USDT.D for better target spotting.
4-Hour Timeframe: Long & Short Setups
On the 4-hour chart, price action is getting tighter and tighter, which is awesome. Why? The longer we range, the more liquidity builds up, setting us up for a sharp move with smaller stop losses compared to trending markets. Here’s the breakdown:
Market Context:
The 4-hour timeframe shows stronger bearish momentum, but remember: the major trend is uptrend, and the secondary trend is consolidation.
For shorts, keep position risk low since we’re in a bullish major trend.
For longs, hold positions longer and, if possible, lock in profits early without closing the entire position.
Long Setup:
Trigger : Open a long after a break above 2.4742 .
Key Notes:
Ensure the break comes with rising volume to avoid a fake breakout.
Reduce profit-taking on this position. Why? Higher levels have more liquidity, leading to sharp moves, making it harder to open new positions.
Short Setup:
Trigger: Open a short after a break below support at 2.2926 .
Advice: Take profits quickly and close the position when you hit your targets.
The current candle looks like it failed to break out and formed a shadow, which could increase the odds of a return to the ceiling and a resistance break.
Front-Running Spot Trigger:
To front-run the daily box breakout, open a position after breaking 2.9789 on the 4-hour timeframe.
XRP/BTC Analysis
XRP/BTC had a solid rally but is now in a price correction, and it’s a weak correction at that. Here’s what to watch:
Key Level : A break above resistance at 0.00002548 could bring back uptrend momentum to XRP/BTC.
Implication: If this breaks, buying XRP becomes more logical than Bitcoin, as XRP could outperform.
Until Then: Stick with longs on BTC, as liquidity is flowing more into Bitcoin, giving it stronger growth potential.
Pro Tip: Checking the BTC pair is a game-changer—trust me! 😎
💬 Let’s Talk!
If this analysis sparked some ideas, give it a quick boost—it really helps! 😊 Got a pair or setup you want me to dive into next? Drop it in the comments, and I’ll tackle it. Thanks for joining me—see you in the next one. Let's grow together! 🤍

XRPUSDT - UniverseMetta - Signal#XRPUSDT - UniverseMetta - Signal
D1 - Formation of ABC structure in continuation of the upward trend. Stop behind the minimum.
Entry: 2.4470
TP: 2.6527 - 2.8878 - 3.0311 - 3.2662
Stop: 2.2670

XRPUSDT: Price has reversed, what's next? XRPUSDT has smoothly reversed from our designated reversal buy zone, as clearly pointed out in this chart and our previous analysis. We expect a smooth price reversal taking the price to $4 in the coming weeks. Please use accurate risk management while trading XRP. Crypto is likely to remain more volatile in the coming days.
Two targets are pointed out, which you can set based on your analysis.
If you’d like to contribute, here are a few ways you can assist us:
- Like our ideas
- Comment on our ideas
- Share our ideas
Team Setupsfx_🚀❤️

Next levels for XRP!This Gann arc held as support and price will go right to the next arc. I'm seeing a confluence with th 1.618!
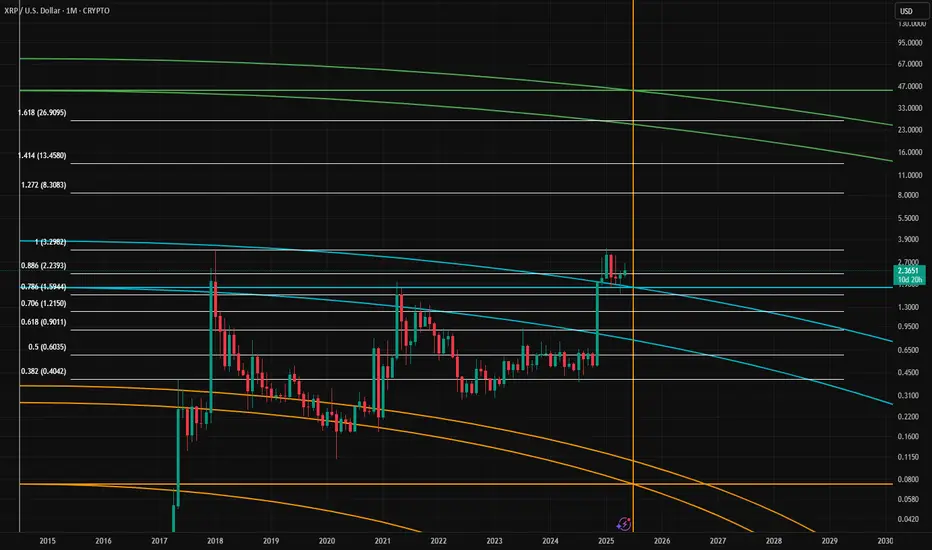
Next levels for XRPThis Gann arc held as support and price will go right to the next arc. I'm seeing a confluence with th 1.618!
