XRPUSDT: NO MAJOR MOVEMENT EXPECTEDXRPUSDT: we expect no major movement, as accumulation has not yet completed since all the gain have vanished, we expect no upcoming big movement on this pair.
Xrpusdtlong

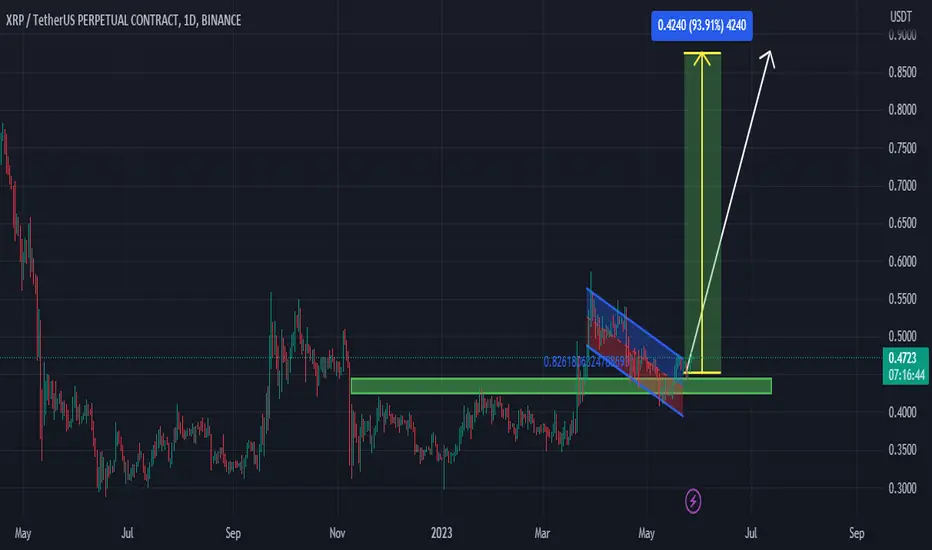
Xrp retest and bullish scenario #Xrp should go down to retest 0.55 level and then it should start pumping following blue arrow.
Below the red trend line is risk.

XRPUSDT at 4h support, likely to head towards 0.83The price is at 4h support 4HS1. It shall bounce here towards 4h resistance 4HR1. It still has the strength and volatility for the trade on both sides. A long is favorable here towards 4HR1 zone which is sitting around 0.825-0.832.

XRP forming a bullish BAT for next pumpHi dear friends, hope you are well and welcome to the new trade setup of XRP coin with US Dollar pair.
Previously we caught more than 105% pump of XRP as below:
Now on a 2-hr frame, XRP is about to complete a bullish BAT move for the next price reversal.
Note: Above idea is for educational purpose only. It is advised to diversify and strictly follow the stop loss, and don't get stuck with trade.

Is XRP Headed for the Stars? Weekly Analysis Suggests $660! By this point, it is widely acknowledged that XRP possesses significant potential, and when we say significant, we truly mean it. However, is it plausible for the scenario outlined in the weekly timeframe to actually materialize?
Should this scenario unfold as anticipated, it would imply a price surge to reach an astonishing 660 USD per unit of XRP.

XRP's Robust Run: Breakout Confirmed Above Major ResistanceAmidst turbulence in major cryptocurrency pairs, XRP remains resilient and continues its robust performance.
Technical analysis indicates an imminent confirmed breakout, with potential for continuity across larger timeframes.
Key points:
- MACD signals an upward crossover on the 2-hour chart.
- Breakout confirmed as the entire candle surpasses the major resistance point.

Can XRP reach $35+The top chart shows XRP market cap whereas the bottom chart shows XRP/USDT.
According to the trend analysis of XRP market cap, its highly likely that the peak will be somewhere around $1.3 TRILLION if flippening happens (overtaking BTC as the biggest crypto by market cap at the peak of the cycle).
Last flippening happened during 1st Jan 2018 when XRP became Rank 1 by market cap.
$35 derived from the percentage gain of the market cap sounds hypothetical because billions of XRPs are being released from escrow account to increase the supply, which is controlled by consensus.
In such scenarios the best possible thing to do is to observe the market cap.
Once market cap reaches $1.3 Trillion or 1.618 blue line of the fib channel, you can exit.
These are just my views on XRP token.
In the above statements, the term "market cap" refers to XRP market cap only.
Do your own due diligence before taking any action.
What is your target on XRP?
Do share your views as well.
Peace!!

XRPUSDT on hourly support, likely to head to 0.77-0.79The price has come back to our previous entry for long trade which is also an hourly support. This support is likely to provide a bounce which can allow for a long trade here. The price is likely to bounce to at least 4h resistance zone 0.77-0.79. Lets target that.

XRPUSDT Elliott Waves AnalysisHello friends.
Please support my work by clicking the LIKE button👍(If you liked). Also i will appreciate for ur activity. Thank you!
Everything on the chart.
Entry: market and lower
Targets: 0.58 and ~0.66
after first target reached move ur stop to breakeven
Stop: ~0.415 (depending of ur risk). ALWAYS follow ur RM .
RR: 1 to 3
risk is justified
Good luck everyone!
Follow me on TRADINGView, if you don't want to miss my next analysis or signals.
It's not financial advice.
Dont Forget, always make your own research before to trade my ideas!
Open to any questions and suggestions

XRPUSDT long ideaThe price is pulling back right now. I expect it to retrace to LTFS1 and then bounce from there. Therefore, a long is favorable from LTFS1 support. Next support is LTFS2 which is a bit stronger. In case the price retraces further, that would be another level to go long. However, as mentioned, I expect the price to bounce from LTFS1 itself. The target of the trade should be around 0.8176

XRP: The Ripple Effect of Opportunity!Today, I have some thrilling news to share that will surely make your heart skip a beat. Brace yourself for the Ripple Effect of Opportunity with XRP!
Now, let's dive right into it. You may have heard whispers in the crypto community about XRP's recent legal status. Well, I'm here to put those rumors to rest and spread some joyous tidings. XRP is NOT a security!
Yes, you read that right! The Securities and Exchange Commission (SEC) has lost so that XRP is not classified as a security. This monumental announcement has sent shockwaves through the market, igniting a rapid surge in XRP's value. And the best part? We're just getting started!
The beauty of this groundbreaking development is that it has unlocked a world of possibilities for us, the XRP enthusiasts. With the cloud of uncertainty lifted, we can now seize this golden opportunity to ride the XRP wave and make some serious gains.
So, what's the call to action, you ask? I encourage you to take advantage of this moment and immediately place your XRP market orders. Quick returns are within your reach, with the market poised for exponential growth. Don't miss the chance to capitalize on this exciting turn of events!
Remember, dear traders, opportunity knocks but once. The time to act is now! Let's ride this wave of positivity and embrace the immense potential of XRP. Together, we can make our dreams of financial prosperity a reality.

Learn to fly with XRP currencyXRP currency experienced up to 100% growth today!
According to Andrews fork, this currency will have the possibility of returning to Heman district.
On the other hand, due to approaching the price of one dollar, it is in an emotional resistance, so the possibility of a price return of up to 15% for this currency is not far from expected, but the failure of the 2-year downward trend promises to witness further growth of this currency in the long term. be a currency

Xrp As Expected | Now On Deciding Level Let's See Xrpusdt
As I shared in my previous idea xrp moving same
Now this is the main point to check how buyers and sellers fight
If we see momentum candles here we will definitely buy xrp
Or Incase of breakdown next entry is 45 / 43
Let's
Note : Ideas are personal opinion not financial advice do your own research and always manage your risk

Strong bounce for XRPWhat is seen in the chart is not enough
This analysis is based on fundamental analysis + complete price analysis + time analysis
The important trading points for buying are specified in the chart, which is the best blue trend point that you can use
We expect this climb to start from the date indicated in the chart, and don't forget that this time is weekly and the trigger is daily and 4-hour times.
Do not forget to like this analysis, thank you

XPR/USDT ::: wait !?XRP/USDT ::
Wait until it breaks .
The price is being supported by the middle line and is thrown higher every time the middle line is hit .
It is better to wait for the price to find its way and enter the transaction after stabilization .

XRP buy every dip XRP because this is accumulation zone Hi every one this is XRP buy zone
it is accumulating the xrp for big move in july august 2023

Xrp looking goodxrp looking good here
if we can break the ascending triangle up, we could see a nice move up
but be careful if we go below

XRPUSDT aiming for daily and weekly resistanceThe price is being held by weekly resistance and has been rejected multiple times from there. Currently it is trading between the weekly support and weekly resistance and to be precise between daily support and daily resistance. After getting rejected from weekly resistance, it came back close to weekly support and now heading towards the daily resistance. Looking at the chart, it seems likely that the price is aiming towards daily resistance and may further target the weekly resistance again. But I think hitting the daily resistance is looking more favorable at the moment.

XRP longXRP is experiencing a pullback after a strong move that happened yesterday. It is bouncing off the support level and the Fibonacci 0.5 level. Bullish movement to resistance level at 0.547 is possible.

XRPUSD 4June2023although there is an unresolved problem between Ripple & SEC but by looking at the current XRP price, it could be a positive sign if the results that will come out later will be in favor of Ripple. if this bullishness can last, there is a strong possibility of forming wave 3 after the price rises higher than wave 1. I see that the market is a form of human psychology, it could be a promising start to take XRP positions for the long term.

XRPUSDT-Bullish Momentum to continue Traders, XRPUSDT, likewise other crypto pairs that we have shared those setups are spot on, and right time entries but this one we missed out on, however, if we are correct then we will have next possible area to get into action so that we do not misses out on this crypto pair too.
Like and comment, that will helps send you the best ideas in future.

xrp full send it to the moonXrp is full bullish and fundamentally its also strong thats why it wants to pump hard and hard. More than 50% profit easily once it got started.
Are you ready for the next leg of $XRP?Hi Guys!
Im baaaaaaaaaack!!!
Bearmarket is over! and I will start to make ideas again!
Anywayssssss!
Lets get back on XRP
Will make this short analysis
Based on the chart, XRP is currently is consolidating in this Huge Ascending Broadening wedge and currently lookslike bounce on the support of this wedge and aiming to get the second leg for this wedge tapping the Resistance pertaining to the upward arrow.
Goodluck
Trade responsibly!!!!!
