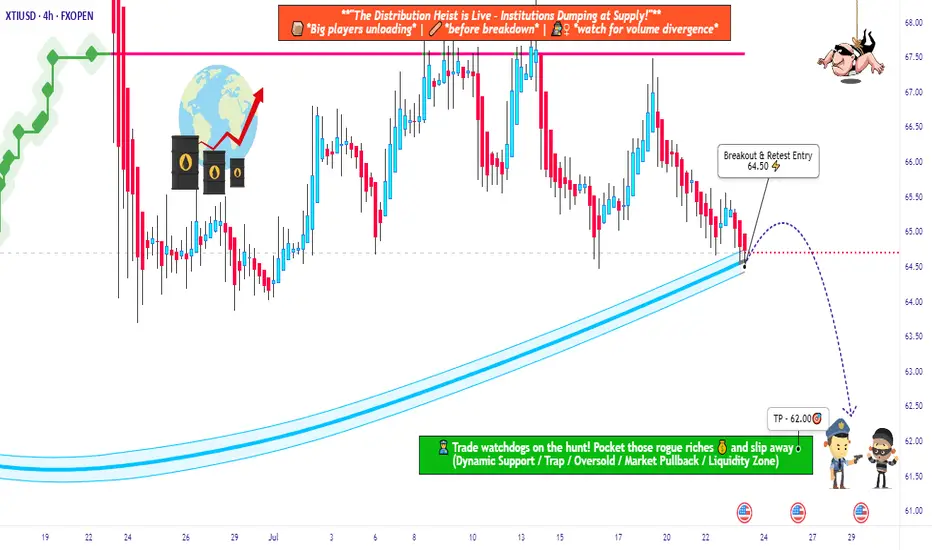
USOIL Robbery Alert! Smart Entry Plan Below Key MA Level🔐💥 “WTI Energy Heist: Thief Trader’s Bearish Master Plan” 💥🔐
The Official Robbery Blueprint for Smart Traders
🌟 Hi! Hola! Ola! Bonjour! Hallo! Marhaba! 🌟
💸 Welcome, Money Makers & Market Robbers! 💸
🚨 Get ready to break into the "US Oil Spot/WTI" market with precision-crafted bearish strategy from the one and only — Thief Trader Style!
📉💣 THE HEIST IS ON: SHORT PLAN LOADED! 💣📉
We’ve analyzed the charts using Thief Technicals + Fundamental Lockpick Tools and spotted a high-risk GREEN zone – a consolidation trap where greedy bulls usually get caught. This is where we strike.
🔑 ENTRY:
"Wait for the Neutral Moving Average to Break — Then Make Your Move!"
🎯 Focus zone: 64.50
☠️ Wait for the breakout – do NOT enter before it happens.
✅ Use sell stop orders above the MA line or place sell limit orders on the pullback after the breakout (target within the 15–30 min candle near swing high/low).
🧠 Thief Tip: Layer in entries using the DCA (layered attack strategy) to catch price on its way down. Set a chart alert so you don’t miss the strike moment.
🛑 STOP LOSS:
"Set it smart or don’t set it at all — you choose the fire you want to play with!"
📍 SL only gets placed AFTER breakout.
🎯 Recommended SL at 66.00 on the 4H swing level.
☠️ DO NOT place any orders or SL before confirmation breakout.
📊 Your SL depends on your risk %, lot size, and number of entries stacked.
🎯 TARGET ZONE: 62.50
💸 Lock profits before the bulls wake up. This level is based on market exhaustion zones and historical bounce areas.
🧠 WHY WE'RE SHORTING THIS?
This isn’t just a chart move — it’s backed by full-scale robbery research:
📰 COT Reports
📈 Macro & Seasonal Trends
🛢️ Crude Oil Inventories
💹 Sentiment & Intermarket Correlation
📉 Supply-Demand Dynamics
📚 Before pulling the trigger, educate yourself with the fundamentals. Dive into COT, Seasonal, and Macro reports. Don’t rob blindly — rob smart.
⚠️ Risk Management Alert:
Major news releases? Step back.
Trailing stops? Lock it in.
Position sizing? Know your risk.
Trade like a professional robber, not a street pickpocket.
💥💖 SUPPORT THE ROBBERY PLAN 💖💥
🧨 Smash that BOOST button to support this trading style and help more traders rob the market clean. Every like, every boost makes this community stronger.
💬 Drop a comment, share your entry levels, or post your winning trades.
This is a trading crew – we rob together, we profit together.
🔔 Stay tuned — more heist plans dropping soon.
Until then... Rob Smart. Trade Hard. Take Profits. 💰💪🎯
Xtiusdsignals
USOIL HEIST ALERT: Thief Entry Loaded – Target Locked!🚨 The Ultimate US OIL / WTI Heist Plan – Thief Trading Style 🎯💸
Hey Money Makers, Hustlers, Market Bandits! 🌍
Hola, Ola, Bonjour, Hallo, Marhaba! 👋🌟
We’re back with a slick WTI energy market heist based on our 🔥Thief Trading Style🔥—powered by a mix of technical & fundamental strategies. The vault is wide open and the bullish loot awaits!
🗺️ Strategy Brief:
We’re aiming for a clean bullish getaway near the high-risk MA zone—where traps are set and bearish robbers lurk. Watch out for overbought zones, trend reversals, and consolidation ambushes.
📈 Entry Point:
“The vault is open! Enter the bullish heist at will.”
Look to place Buy Limit Orders around swing highs/lows or pullback levels on the 15m–30m timeframe.
🛑 Stop Loss:
Set your Thief SL around the recent swing low using the 3H timeframe (example: 60.300).
Adjust based on your risk appetite, lot size, and number of entries.
🎯 Target: 65.200
That's where we celebrate the score, traders! 🥂💸
📊 Heist Justification (Fundamentals + Sentiment):
The WTI market is currently bullish, fueled by a mix of:
✅ Macro economics
✅ COT data
✅ Seasonal trends
✅ Intermarket signals
✅ Inventory & storage dynamics
📌 For full analysis and future target breakdowns, check the linkk in our profilee 🔗👀
⚠️ Important Alert – Manage Your Risk During News:
🚫 Avoid fresh entries during major news releases
✅ Use trailing stops to protect running gains
Stay sharp, stay safe.
💥 Hit the Boost Button if you support the Thief Strategy!
Join the crew, ride the wave, and let’s rob the market like pros 💼🕶️💰
📅 Stay tuned for the next master plan. Another heist is always around the corner.
Until then – steal smart, win big! 🐱👤🔥

Heading into 61.8% Fibonacci resistance?WTI Oil (XTI/USD) is rising towards the pivot which is a pullback resistance and could drop to the 1st support.
Pivot: 66.66
1st Support: 60.10
1st Resistance: 71.18
Risk Warning:
Trading Forex and CFDs carries a high level of risk to your capital and you should only trade with money you can afford to lose. Trading Forex and CFDs may not be suitable for all investors, so please ensure that you fully understand the risks involved and seek independent advice if necessary.
Disclaimer:
The above opinions given constitute general market commentary, and do not constitute the opinion or advice of IC Markets or any form of personal or investment advice.
Any opinions, news, research, analyses, prices, other information, or links to third-party sites contained on this website are provided on an "as-is" basis, are intended only to be informative, is not an advice nor a recommendation, nor research, or a record of our trading prices, or an offer of, or solicitation for a transaction in any financial instrument and thus should not be treated as such. The information provided does not involve any specific investment objectives, financial situation and needs of any specific person who may receive it. Please be aware, that past performance is not a reliable indicator of future performance and/or results. Past Performance or Forward-looking scenarios based upon the reasonable beliefs of the third-party provider are not a guarantee of future performance. Actual results may differ materially from those anticipated in forward-looking or past performance statements. IC Markets makes no representation or warranty and assumes no liability as to the accuracy or completeness of the information provided, nor any loss arising from any investment based on a recommendation, forecast or any information supplied by any third-party.

WTI Crude Oil Price Targets Fresh GainsWTI Crude Oil Price Targets Fresh Gains
WTI Crude oil prices are gaining bullish momentum and might even test $63.50.
Important Takeaways for WTI Crude Oil Price Analysis Today
- WTI Crude climbed above the $60.90 and $61.50 resistance levels.
- There is a key rising channel forming with support at $61.30 on the hourly chart of XTI/USD at FXOpen.
WTI Crude Oil Price Technical Analysis
On the hourly chart of WTI Crude Oil at FXOpen, the price started a fresh upward move from $60.10 against the US Dollar. The price gained bullish momentum after it broke the $60.90 resistance.
The bulls pushed the price above the 50% Fib retracement level of the downward move from the $63.45 swing high to the $60.08 low. The price even climbed above the 50-hour simple moving average.
It tested the $62.15 resistance zone and the 61.8% Fib retracement level of the downward move from the $63.45 swing high to the $60.08 low. There is now a key rising channel forming with support at $61.30.
The RSI is now near the 50 level and the price could aim for more gains. If the price climbs higher again, it could face resistance near $62.15. The next major resistance is near the $62.65 level. Any more gains might send the price toward the $63.45 level or even $65.00.
Conversely, the price might correct gains and test the $61.30 support level. The next major support on the WTI crude oil chart is near the $60.90 zone, below which the price could test the $60.10 zone.
If there is a downside break, the price might decline toward $58.50. Any more losses may perhaps open the doors for a move toward the $55.50 support zone.
This article represents the opinion of the Companies operating under the FXOpen brand only. It is not to be construed as an offer, solicitation, or recommendation with respect to products and services provided by the Companies operating under the FXOpen brand, nor is it to be considered financial advice.

XTIUSD Crude oil Raid Plan: Snag Profits Before the ATR Trap!🌍 Greetings, Wealth Warriors! Salut! Ciao! Salaam! 🌟
Fellow Profit Pirates, 🤑💰🚀
Crafted with 🔥Bandit Blueprint analysis🔥 (technical + fundamental), here’s our cunning scheme to raid the "XTIUSD / WTI Oil" Energy Market. Follow the charted course for a long entry, aiming to slip away near the high-stakes ATR Zone. Watch out—overbought signals, consolidation, or a trend flip could trap the unwary where bearish bandits lurk! 🏴☠️💸 "Cash out and celebrate, traders—you’ve earned it! 🎉💪"
**Entry 📈**: "The vault’s open! Await the MA breakout (64.00), then strike—bullish riches await!"
Pro tip: Set buy stop orders above the Moving Average or place buy limit orders at the latest 15/30-min swing low/high for pullback entries.
📢 Set a chart "alert" to catch the breakout moment!
**Stop Loss 🛑**: "📣 Heads up, crew! 🗣️ For buy stop orders, hold off on placing that stop loss until the breakout sparks 🚀. Stick to my marked spot 📍 or go rogue at your own peril 😎—it’s your gamble! ⚠️"
📍 Bandit SL set at the recent 3H swing low (60.00) for swing trades.
📍 Adjust SL based on your risk, lot size, and number of orders.
**Target 🎯**: 70.000 or bail out before the finish line.
🧲 **Scalpers, listen up** 👀: Stick to long-side scalps. Big bankrolls can dive in; smaller stacks, join the swing trade heist. Use trailing SL to shield your loot 💰.
💸 **US Oil Spot / WTI** Swing Trade Plan: Bullish vibes 🐂 are surging, fueled by key drivers. ☝
📰 **Dive Deeper**: Check Fundamentals, Macro Trends, COT Reports, Seasonal Patterns, Intermarket Insights, Inventory Data, and Future Targets 👉🔗
⚠️ **Trading Alert: News & Position Tips** 🗞️ 🚨
News drops can shake prices and volatility. To protect your haul:
- Skip new trades during news events.
- Use trailing stops to lock in gains.
💖 **Fuel our heist!** 💥Tap the Boost Button💥 to power up our profit raid. Join the Bandit Trading Crew, snatching wins daily with ease! 🏆🤝🎉
Stay sharp for the next caper—see you soon! 🤑🐱👤🚀
---
Real-Time Data (UTC+1, May 14, 2025) 📊
**WTI Oil (XTIUSD)**:
- **Price**: ~$63.80 (based on latest market data)
- **MA Breakout Level**: ~$64.00 (as per strategy)
- **Stop Loss Level**: ~$60.00 (3H swing low)
- **Target**: $70.00
- **Market Sentiment**: Bullish 🐂, driven by inventory draws and geopolitical factors (per recent analysis).
**Latest COT Data (Friday, May 9, 2025)**:
- **Commercial Hedgers**: Increased net long positions in WTI futures, signaling bullish bias.
- **Large Speculators**: Moderately net long, cautious due to overbought risks.
- **Data Source**: CFTC (official Commitment of Traders report).
**Key Fundamental Drivers**:
- **Inventory**: EIA reported a -2.5M barrel draw last week, supporting bullish momentum.
- **Geopolitical**: Middle East tensions continue to prop up oil prices.
- **Seasonal**: Summer demand expectations rising.
🔔 **Note**: Monitor upcoming EIA inventory data (Wednesday, May 14, 2025) for volatility.
---
💥 Boost this plan and let’s plunder the markets together! 🚀

Oil : April Could Be the Worst Month in Three and a Half YearsOil Prices: April Could Be the Worst Month in Three and a Half Years
As the XTI/USD chart shows:
→ at the beginning of April, WTI crude was trading above $71 per barrel;
→ this morning, on the last day of the month, the price has fallen below $60.
The overall decline may reach 16% — the worst monthly performance since November 2021.
Why Is Oil Falling?
The primary driver behind the sharp drop in oil prices earlier this month was the introduction of new US tariffs, particularly targeting China and the EU. This raised concerns that a potential global trade war could slow economic growth and, in turn, reduce global oil demand.
According to a Reuters poll, the tariffs imposed by Trump have made a global recession in 2025 a realistic risk.
In addition, growing attention is being paid to OPEC+ and its plans to increase oil production. The next meeting is scheduled for 5 May.
Technical Analysis of the XTI/USD Chart
Oil price fluctuations in 2025 have formed a descending channel (highlighted in red), with lower highs and lower lows reflecting continued bearish sentiment.
Bulls may hope for support to emerge around the $58.85 level, as:
→ this has acted as support before (as indicated by arrows);
→ this level aligns with the lower boundary of a local upward trend (shown in blue), which formed after news broke that Trump had postponed the implementation of some tariffs — triggering a sharp rebound in oil prices from the 9 April low.
Nevertheless, the broader structure remains bearish: the rise towards point C appears to be a corrective recovery following the impulse drop from A to B. Given the potential impact of upcoming news — including statements from the White House and OPEC+ decisions — a bearish breakout below the blue channel cannot be ruled out.
This article represents the opinion of the Companies operating under the FXOpen brand only. It is not to be construed as an offer, solicitation, or recommendation with respect to products and services provided by the Companies operating under the FXOpen brand, nor is it to be considered financial advice.

XTI/USD "WTI LIGHT CRUDE OIL" Heist Plan (Scalping/Day Trade)🌟Hi! Hola! Ola! Bonjour! Hallo! Marhaba!🌟
Dear Money Makers & Robbers, 🤑 💰💸✈️
Based on 🔥Thief Trading style technical and fundamental analysis🔥, here is our master plan to heist the XTI/USD "WTI LIGHT CRUDE OIL" Energy market. Please adhere to the strategy I've outlined in the chart, which emphasizes long entry. Our aim is to escape near the high-risk MA Zone. Risky level, overbought market, consolidation, trend reversal, trap at the level where traders and bearish robbers are stronger. 🏆💸"Take profit and treat yourself, traders. You deserve it!💪🏆🎉
Entry 📈 : "The heist is on! Wait for the MA breakout (64.00) then make your move - Bullish profits await!"
however I advise to Place Buy stop orders above the Moving average (or) Place buy limit orders within a 15 or 30 minute timeframe most recent or swing, low or high level for Pullback entries.
📌I strongly advise you to set an "alert (Alarm)" on your chart so you can see when the breakout entry occurs.
Stop Loss 🛑: "🔊 Yo, listen up! 🗣️ If you're lookin' to get in on a buy stop order, don't even think about settin' that stop loss till after the breakout 🚀. You feel me? Now, if you're smart, you'll place that stop loss where I told you to 📍, but if you're a rebel, you can put it wherever you like 🤪 - just don't say I didn't warn you ⚠️. You're playin' with fire 🔥, and it's your risk, not mine 👊."
📍 Thief SL placed at the recent/swing low level Using the 1H timeframe (59.00) Day trade basis.
📍 SL is based on your risk of the trade, lot size and how many multiple orders you have to take.
🏴☠️Target 🎯: 68.70
🧲Scalpers, take note 👀 : only scalp on the Long side. If you have a lot of money, you can go straight away; if not, you can join swing traders and carry out the robbery plan. Use trailing SL to safeguard your money 💰.
🛢️ XTI/USD "WTI LIGHT CRUDE OIL" Energy Market Heist Plan (Scalping/Day) is currently experiencing a bullishness,., driven by several key factors. ☝☝☝
📰🗞️Get & Read the Fundamental, Macro Economics, COT Report, Seasonal Factors, Intermarket Analysis, Inventory and Storage Analysis, Sentimental Outlook, Future trend targets and Overall outlook score..., Go ahead to check 👉👉👉🔗
⚠️Trading Alert : News Releases and Position Management 📰 🗞️ 🚫🚏
As a reminder, news releases can have a significant impact on market prices and volatility. To minimize potential losses and protect your running positions,
we recommend the following:
Avoid taking new trades during news releases
Use trailing stop-loss orders to protect your running positions and lock in profits
💖Supporting our robbery plan 💥Hit the Boost Button💥 will enable us to effortlessly make and steal money 💰💵. Boost the strength of our robbery team. Every day in this market make money with ease by using the Thief Trading Style.🏆💪🤝❤️🎉🚀
I'll see you soon with another heist plan, so stay tuned 🤑🐱👤🤗🤩

XTI/USD "WTI LIGHT CRUDE OIL" Energy Market Heist Plan🌟Hi! Hola! Ola! Bonjour! Hallo! Marhaba!🌟
Dear Money Makers & Robbers, 🤑 💰💸✈️
Based on 🔥Thief Trading style technical and fundamental analysis🔥, here is our master plan to heist the XTI/USD "WTI LIGHT CRUDE OIL" Energy market. Please adhere to the strategy I've outlined in the chart, which emphasizes long entry. Our aim is the high-risk Red Zone. Risky level, overbought market, consolidation, trend reversal, trap at the level where traders and bearish robbers are stronger. 🏆💸Book Profits Be wealthy and safe trade.💪🏆🎉
Entry 📈 : "The heist is on! Buy above (68.00) then make your move - Bullish profits await!"
however I advise to placing the Buy Stop Orders above the breakout Level (or) placing the Buy limit orders within a 15 or 30 minute timeframe, Entry from the most Recent or Swing low or high level should be in retest.
Stop Loss 🛑:
Thief SL placed at the recent / nearest low level Using the 4H timeframe (66.00) swing trade basis.
SL is based on your risk of the trade, lot size and how many multiple orders you have to take.
Target 🎯:
🏴☠️Primary Target - 71.00 (or) Escape Before the Target
🏴☠️Secondary Target - 74.00 (or) Escape Before the Target
🧲Scalpers, take note 👀 : only scalp on the Long side. If you have a lot of money, you can go straight away; if not, you can join swing traders and carry out the robbery plan. Use trailing SL to safeguard your money 💰.
🛢️ XTI/USD "WTI LIGHT CRUDE OIL" Energy Market is currently experiencing a neutral trend (high chance to bullishness),., driven by several key factors.
📰🗞️Read the Fundamental, Macro Economics, COT Report, Seasonal Factors, Intermarket Analysis, Inventory and Storage Analysis, Sentimental Outlook, Future trend predict.
Before start the heist plan read it.👉👉👉
📌Keep in mind that these factors can change rapidly, and it's essential to stay up-to-date with market developments and adjust your analysis accordingly.
⚠️Trading Alert : News Releases and Position Management 📰 🗞️ 🚫🚏
As a reminder, news releases can have a significant impact on market prices and volatility. To minimize potential losses and protect your running positions,
we recommend the following:
Avoid taking new trades during news releases
Use trailing stop-loss orders to protect your running positions and lock in profits
💖Supporting our robbery plan 💥Hit the Boost Button💥 will enable us to effortlessly make and steal money 💰💵. Boost the strength of our robbery team. Every day in this market make money with ease by using the Thief Trading Style.🏆💪🤝❤️🎉🚀
I'll see you soon with another heist plan, so stay tuned 🤑🐱👤🤗🤩

XTI/USD "WTI Crude Oil" Energy Market Heist Plan (Scalping/Day)🌟Hi! Hola! Ola! Bonjour! Hallo! Marhaba!🌟
Dear Money Makers & Robbers, 🤑 💰💸✈️
Based on 🔥Thief Trading style technical and fundamental analysis🔥, here is our master plan to heist the XTI/USD "WTI Light Crude Oil" Energy Market. Please adhere to the strategy I've outlined in the chart, which emphasizes long entry. Our aim is the high-risk Yellow MA Zone. Risky level, overbought market, consolidation, trend reversal, trap at the level where traders and bearish robbers are stronger. 🏆💸"Take profit and treat yourself, traders. You deserve it!💪🏆🎉
Entry 📈 : "The vault is wide open! Swipe the Bullish loot at any price - the heist is on!
however I advise to Place buy limit orders within a 15 or 30 minute timeframe most recent or swing, low or high level.
Stop Loss 🛑:
Thief SL placed at the recent/swing low level Using the 1H timeframe (68.00) Day / scalping trade basis.
SL is based on your risk of the trade, lot size and how many multiple orders you have to take.
🏴☠️Target 🎯: 70.90 (or) Escape Before the Target
🧲Scalpers, take note 👀 : only scalp on the Long side. If you have a lot of money, you can go straight away; if not, you can join swing traders and carry out the robbery plan. Use trailing SL to safeguard your money 💰.
🛢🔥XTI/USD "WTI Light Crude Oil" Energy Market Heist Plan (Day/Scalping Trade) is currently experiencing a bullishness,., driven by several key factors.
📰🗞️Get & Read the Fundamental, Macro, COT Report, Inventory and Storage Analysis, Seasonal Factors, Sentimental Outlook, Intermarket Analysis, Future trend targets.. go ahead to check 👉👉👉🔗
⚠️Trading Alert : News Releases and Position Management 📰 🗞️ 🚫🚏
As a reminder, news releases can have a significant impact on market prices and volatility. To minimize potential losses and protect your running positions,
we recommend the following:
Avoid taking new trades during news releases
Use trailing stop-loss orders to protect your running positions and lock in profits
💖Supporting our robbery plan 💥Hit the Boost Button💥 will enable us to effortlessly make and steal money 💰💵. Boost the strength of our robbery team. Every day in this market make money with ease by using the Thief Trading Style.🏆💪🤝❤️🎉🚀
I'll see you soon with another heist plan, so stay tuned 🤑🐱👤🤗🤩

Falling towards pullback support?WTI oil (XTI/USD) is falling towards the pivot and could bounce to the 1st resistance.
Pivot: 67.74
1st Support: 65.55
1st Resistance: 72.63
Risk Warning:
Trading Forex and CFDs carries a high level of risk to your capital and you should only trade with money you can afford to lose. Trading Forex and CFDs may not be suitable for all investors, so please ensure that you fully understand the risks involved and seek independent advice if necessary.
Disclaimer:
The above opinions given constitute general market commentary, and do not constitute the opinion or advice of IC Markets or any form of personal or investment advice.
Any opinions, news, research, analyses, prices, other information, or links to third-party sites contained on this website are provided on an "as-is" basis, are intended only to be informative, is not an advice nor a recommendation, nor research, or a record of our trading prices, or an offer of, or solicitation for a transaction in any financial instrument and thus should not be treated as such. The information provided does not involve any specific investment objectives, financial situation and needs of any specific person who may receive it. Please be aware, that past performance is not a reliable indicator of future performance and/or results. Past Performance or Forward-looking scenarios based upon the reasonable beliefs of the third-party provider are not a guarantee of future performance. Actual results may differ materially from those anticipated in forward-looking or past performance statements. IC Markets makes no representation or warranty and assumes no liability as to the accuracy or completeness of the information provided, nor any loss arising from any investment based on a recommendation, forecast or any information supplied by any third-party.

XTIUSD 30m previewICMARKETS:XTIUSD Oil broke the rotation and is heading down, I look for short positions and here is an example of such a short

Usoil buy analysis Usoil im looking for buy side
1:2 RR
FOLLOWING MM AND RM
stay safe geopolitical news there

Bearish drop off pullback resistance?WTI oil (XTI/USD) has reacted off the pivot and could drop to the 38.2% Fibonacci support.
Pivot: 72.56
1st Support: 70.33
1st Resistance: 74.76
Risk Warning:
Trading Forex and CFDs carries a high level of risk to your capital and you should only trade with money you can afford to lose. Trading Forex and CFDs may not be suitable for all investors, so please ensure that you fully understand the risks involved and seek independent advice if necessary.
Disclaimer:
The above opinions given constitute general market commentary, and do not constitute the opinion or advice of IC Markets or any form of personal or investment advice.
Any opinions, news, research, analyses, prices, other information, or links to third-party sites contained on this website are provided on an "as-is" basis, are intended only to be informative, is not an advice nor a recommendation, nor research, or a record of our trading prices, or an offer of, or solicitation for a transaction in any financial instrument and thus should not be treated as such. The information provided does not involve any specific investment objectives, financial situation and needs of any specific person who may receive it. Please be aware, that past performance is not a reliable indicator of future performance and/or results. Past Performance or Forward-looking scenarios based upon the reasonable beliefs of the third-party provider are not a guarantee of future performance. Actual results may differ materially from those anticipated in forward-looking or past performance statements. IC Markets makes no representation or warranty and assumes no liability as to the accuracy or completeness of the information provided, nor any loss arising from any investment based on a recommendation, forecast or any information supplied by any third-party.

US-Oil will further push upside After Testing TrendlineHello Traders
In This Chart XTIUSD HOURLY Forex Forecast By FOREX PLANET
today XTIUSD analysis 👆
🟢This Chart includes_ (XTIUSD market update)
🟢What is The Next Opportunity on XTIUSD Market
🟢how to Enter to the Valid Entry With Assurance Profit
This CHART is For Trader's that Want to Improve Their Technical Analysis Skills and Their Trading By Understanding How To Analyze The Market Using Multiple Timeframes and Understanding The Bigger Picture on the Charts

XTIUSD SELLHi fellow traders, XTIUSD is ready to make a move lower from the blue box after completing the ABC correction. Target the 67.86 level. Good luck and trade safe!

XTIUSD (US OIL/ WTI) : 1800+ Pips Opportunity| Setupsfx_ |Dear Traders,
Hope you are doing great, US OIL still has high chances of touching the 90.00 region and beyond. Price made correction after rejecting at 87.00, price dropped to 80.00 from where we think price is likely to continue the bullish momentum. However, it is crucial to keep next week news in mind as well.
Good Luck

XTIUSD/US OIL: On the way to 100$? Dear Traders,
Hope you are doing great, US OIL has been extremely bullish since our last three entries and there is huge chance that we can get fourth entry on the point. There is gap spotted and in our view price can fill the area and bounce straight up from that region. Please use accurate risk management and take entry accordingly.
Please like and comment for more.

#XTIUSD/WTIOIL: 2000 Pips Buying Opportunity! Do not miss outFirst prediction on XTIUSD turned out to be a successful one where take profit '1' hit . successfully which gave us nice 900 pips in profit. Now we are looking at the broader picture on XTIUSD, targeting 96.00 region which remain crucial for many traders. Price is at the right zone to enter swing, take entry with accurate stop loss that suits your trading style. Please do your own research too before taking any buying entry on XTIUSD.
Like and share for more!

XTIUSD(US OIL): Swing Buying | Targeting $100 |
XTIUSD, this is our third entry, price currently showing strong bullish behaviour, expecting price to grow steadily. Also, we have news on this coming Friday on NFP, depending on that news if news does come out in our support then we can reach our target one area. Please, keep in mind to take extra care while trading OIL as it has same risk factor as gold.
Good Luck

XTIUSD(USOIL): 07/04/2024 We are pleased to inform you that our previous four setups on XTIUSD have been successfully respected. We maintain our belief that our initial target of $100 is highly achievable. The price has rebounded effectively from our initial concept. At this juncture, we anticipate a minor correction before the price reaches our designated area. Our immediate target is $92, which represents a substantial 1000 pips from our entry point. Our ultimate take profit objective remains at 1800 pips.

xtiusd long term trading ideaHello Traders
In This Chart XTIUSD HOURLY Forex Forecast By Forex Planet
today XNGUSD analysis 👆
🟢This Chart includes_ (XTIUSD market update)
🟢What is The Next Opportunity on XTIUSD Market
🟢how to Enter to the Valid Entry With Assurance Profit
This Video is For Trader's that Want to Improve Their Technical Analysis Skills and Their Trading By Understanding How To Analyze The Market Using Multiple Timeframes and Understanding The Bigger Picture on the Charts.

XTIUSD( US OIL ) LONG term Trade AnalysiHello Traders
In This Chart XTIUSD HOURLY Forex Forecast By Forex Planet
today XNGUSD analysis 👆
🟢This Chart includes_ (XTIUSD market update)
🟢What is The Next Opportunity on XTIUSD Market
🟢how to Enter to the Valid Entry With Assurance Profit
This Video is For Trader's that Want to Improve Their Technical Analysis Skills and Their Trading By Understanding How To Analyze The Market Using Multiple Timeframes and Understanding The Bigger Picture on the Charts.

XTIUSD( US OIL ) LONG term Trade Analysi
Hello Traders
In This Chart XTIUSD HOURLY Forex Forecast By Forex Planet
today XNGUSD analysis 👆
🟢This Chart includes_ (XTIUSD market update)
🟢What is The Next Opportunity on XTIUSD Market
🟢how to Enter to the Valid Entry With Assurance Profit
This Video is For Trader's that Want to Improve Their Technical Analysis Skills and Their Trading By Understanding How To Analyze The Market Using Multiple Timeframes and Understanding The Bigger Picture on the Charts.
