XTZ LONG POSITIONMarket just finished 1 to 5 Elliot wave and a Flat ABC correction, we are expecting to see retrace to a 50% fib zone, since we just bounced off of a strong demand zone
Indicators:
AROON: Shows strong bullish momentum
EMA: We crossed 20 EMA zone and close to crossing 50 that means we are going bullish
entry: 3.30
Invalidation: 2.82
Target: 5.99
Xtz

XTZ Yükselen Trend HareketiXTZ bu trend içinde kaldıkça trade işlemlerine devam edicem. Tabi ki $BTC paritesinde ters bir durum yaşanmadığı sürece

#Xtz / #Usdt#Futures / #Scalp
❇️Buy zone 1 : 3.044
lev 5~10x
🎯Targets : 3.09 / 3.119 / 3.155 / 3.19 / 3.22
⛔️Stop loss : 2.951
🛑Don't risk more than 3% of capital.

Buy Tezos/ XTZUSDTLooking at the market, Tezos looks nice to buy at this current moment on the 15 minute chart based on market trends.

Tezos (XTZUSDT) TA: 22.2.27Tezos is located at the bottom of the canal for a long time, which is well supported every time it hits the bottom of the canal. If it leaves the red channel, it can continue its long-term upward trend. But if it leaves the blue channel, it can see 1.85 support.
⚠️ This Analysis will be updated ...
👤 Sadegh Ahmadi: @SDQ_Crypto
📅 27.Feb.22
⚠️(DYOR)
❤️ If you apperciate my work , Please like and comment , It Keeps me motivated to do better

XTZ: A cryptocurrency to watch in 2022Hello and welcome,
I expect a strong move higher in wave 3 in 2022, the best alternate count as i mentioned is the 9 wave up.
invalidation at 2.10

XTZ - Detailed Video Analysis!Hello everyone, if you like the idea, do not forget to support with a like and follow.
Here is the top-down analysis for XTZ , feel free to request any pair/instrument or ask any questions in the comment section below.
Best of luck!

XTZ/BTC Fractal. Potential trend initiation. Big pumpingXTZ / BTC Timeframe 1 week. I deliberately made a large timeframe to show the entire section of the chart, which is necessary for the clarity of the formation. Fractal. The possible start of the trend, possibly near the minimum price values.
The coin is suitable for accumulation, which means for positional trading. The previous price inflation was about + 300%. This time, if a bullish trend develops, we have every chance of seeing a much larger percentage increase in prices. Let's hope that April-May will make smart people obscenely rich, and stupid as always ...
My idea of learning how to work with market cycles, where I showed potential work using this coin as an example, which is quite successfully implemented in reality.
Pivot points (zones) of Tezos (XTZ) / USDT market cycles. Psychology
Those people who count on quick profits without effort and waste of time are doomed to give their modest contribution to the smarter and more hardworking ones.

XTZ bearish at $3.5The Tezos price analysis is bearish as the cryptocurrency has experienced a crash in the past few days. Bears have engulfed the market, and the coin value fell from $3.9 on January 17, 2022, and capped at $3.5 on January 19, 2022; bears continue to rule the market today, as well as a further decrease in price is imminent. The market has shown bearish dynamics. The price for XTZ is currently available at $3.5, struggling just the $3.6 mark.

XTZ Tezos at 10$ soonFollowing the path I can say that XTZ can reach $10 within this summer. There are signals that the bulls will be trying within a month.
Hopefully no wars or any catastrophe that influences the momentum.

As our universe expands so does Tezos! XTZ to $15Their no easier chart than how XTZ was formed!
XTZ targets:
T1: $11
T2: $15
T3: $18

XTZ a low risk midterm investmentHi guys,
XTZ has a key position at current prices, It's experiencing an expanding harmonic pattern and in the midterm, can have a decent profit.
Follow and comment

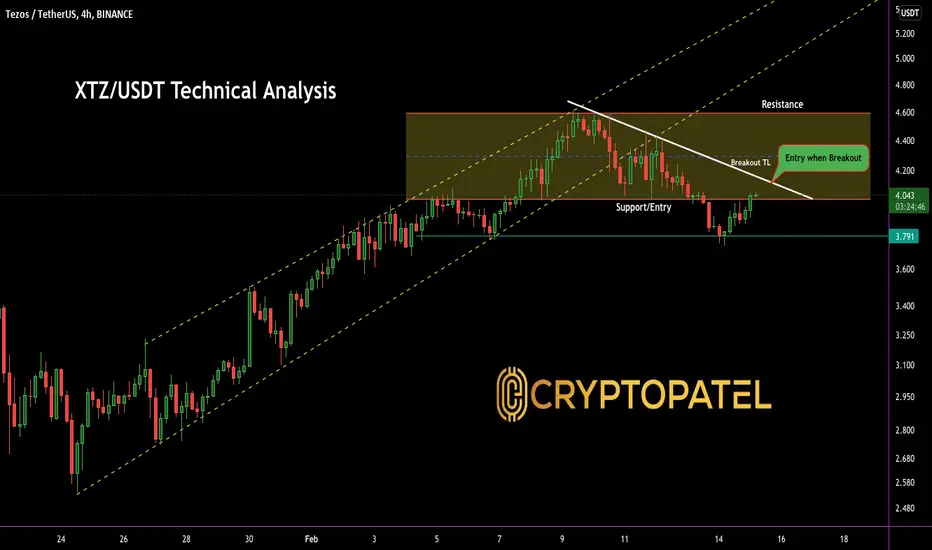
XTZ/USDT Current update after break down#XTZ/USDT
$XTZ dumped -7% after break down.
What now..?
Still not In trade zone.
I am buying only if Breaks White line Resistance.
White Line Resistance = $4.20
If break the Resistance then we can aee $6 in coming days.
But wait for Confirmations.
Support:- $3.80
Resistance:- $4.20
$XTZ two cases.$XTZ broke the biggest bearish trendline, but:
We have two scenarios right here:
-Retest the trendline;
-W pattern at 2.53;
Or I am wrong in both cases:))

XTZ/USDT 1DAY UPDATE BY CRYPTOSANDERSWelcome to this quick XTZ/USDT analysis.
I have tried my best to bring the best possible outcome to this chart.
Reason of trade:- XTZ/USDT Triangle pattern create and buy the dip and green zone
Entry:- $2.1
$2.6
Traget:- 75% to 100%
Stop loss:-$1.5
Remember:-This is not a piece of financial advice. All investment made by me is under my own risk and I am held responsible for my own profit and losses. So, do your own research before investing in this trade.
Happy trading.
Sorry for my English it is not my native language
Do hit the like button if you like it and share your charts in the comments section.

XTZ/USDT Technical Overview#XTZ/USDT Technical Overview:-
$XTZ trading at $4.04
This is Good support.
If $XTZ prize hit $4.40 thats would be good price to Enter because of Confirmations.
I am buying some here around $4.00
If Price go below $3.90 then I will exit.
Targets:- $4.40
If Hit $4.50 then New Target would be $6
Need to break White TL.
Support:- $4
Resistance:- $4.60/$5.60


Sending XTZ to the moon Ascending triangle and ascending channel spotted in XTZ 4H chart. Considering the weekly moving average support and price movements, it's pulling back to both "horizontal S/R of ascending channel" and "ascending channel midline" which both will operate as strong supports. So fasten your seatbelts after the pullback is done.
Trade Safe ...

XTZ at range resistance, breakout or burnout?Seems to be bottoming out, but hasn't formed a bearish divergence as it usually does. Volume looks like it can take more time to squeeze down. RSI also in a squeeze.
I am going to theorize that this time XTZ is going to breakdown from the 2 year long ascending channel and not breakout upward. because in the last run to $8 there was exceptionally huge volumes at the top, suggesting an old large hodler unloading, maybe a founder. Shake and bake baby.

Tezos Breakout✔ #XTZ $XTZTezos, which has been on a low-slope ascending channel for 836 days, is now moving from the bottom of the channel to the top of the channel, breaking a 126-day downtrend line and after stabilizing the price, it is ready to move to the midline and The roof of the canal. There is also a positive divergence in the chart, which could be a sign that the trend is moving up.
I hope you find this analysis useful🌹
Follow for more...
#DYOR

XTZ : SUPPORT & RESISTANCE Just trying to find the laggard coins
I did less homework actually now it's quite dangerous to trade
coz BTC is in the middle of the way
Don't forget to place the stop loss at ur acceptable risk.
Trade safe and fun
.
Feel free to comment & share ur ideas

TRX 3 scenario#TRX/USDT
$TRX rejected from support zone, and reached a resistance zone.
🐮 if price hold the support zone, and break out from resistance zone around $0.077, so it is going up to touch upper line of triangle around resistance zone of $0.09.
🐮🐮 break out from triangle will help price increase more to complete double bottom pattern at $0.15 and $0.176.
🐻 break down from lower line of triangle and support zone, will drop price to complete AB=CD pattern around $0.03

XTZ Target Price 4.4599Price closed above 4.0809 support level and exposed 4.4599 resistance level as a target for take profit.
